Research Report No. 88 July, 1982
Measured
Crop Performance
SMALL GRAIN
1982
D. T. BOWMAN, Assistant Professor In Charge of Variety Testing
Department of Crop Science
NORTH CAROLINA STATE UNIVERSITY
TABLE OF CONTENI'S
mI'RODUCI'ION •••••••••••••••••••••••••••••••••••••••••••••••••••• 1
<n1l?ARrnG VARIEI'IES ••••••••••••••••••••••••••••••••••••••••••••• 1
EXPERIMENTAL PROCEDURE •••••••••••••••••••••••••••••••••••••••••• 5
Erltries ...•••••..••.•...•...••.••..•..••••••..•..•.. 5
Field Plot I:>esigIl ...•.••...•.•.••.••...••.•••.••.• 5
CreJJ? Managerrent .•.•...•...•...•...••...•... 5
Agencies Sponsoring Entries ..•..••...•.•••••.••...•• 8
Cooperators ••....•...•...••..•.•.••..•.•.•..••••.•• 8
~~ C<Jt.IDITICNS ••••••••••••••••••••••••••••••••••••••••••••• 9 RESlJI.,TS .AIDDIOClJSSION •.•.••••.•..••...•...•..•.•.•••.... 10
Barley ...•••...•....••...•...•.•..•....•••....•.... 10
oats 10 Wleat ...•....•.•••...••.•••.•.•.•.•.•.•.•••••••••. 11
t'Vl1.eat and Flour Arlalyses •...••••.•...••...•.•.••••••... 12
TABLES 1. Characteristics of barley varieties .•..••....•...•....•. 3
2. Characteristics of oat varieties ••...••...••.•...•...••. 3
3. Characteristics of wheat varieties ...•..••...•...•.•...••.. 4
4. Cultural practices for small grain tests, 1981-82 •.•.•..•.. 7
5. SUIrrnal:y of barley perfonnance trials across the state .•.... 13
6. Surcmary of barley performance trials in the Piednont •..•... 14
7. Surcmary of barley perfonnance trials in the Coastal Plain •. 15 8 • Surcmary of oat perfo:rmance trials across the state ••... 16
9. Surcmary of oat perfonnance trials in the Piedrront •.•....••. 17
10 . simnary of oat performance trials in the Coastal Plain ....• 18
11. Sumnary of wheat perfo:rmance trials across the state 19 12. Stmmary of wheat perfonnance trials in the Piednont ...•.. 20
1982
PERFORMANCE OF SMALL GRAIN VARIEI'IES IN NORrH CAROLINA!!
mrRCDUcrICN
Across the State of North carolina during the spring of 1981, growers
harvested 62,000 acres of barley, 83,000 acres of oats, and 410,000 acres
of wheat. Average yields across the state were 55, 53, and 39 bushels per
acre for barley, oats, and wheat, respectively.
with the large nunber of camercia11y available and prospective
varieties of barley, oats, and wheat, it becanes difficult for growers to
select a superior variety suited for their particular area of the state.
To make this decision the grower needs up-to-date, unbiased, reliable
infomtion. The Official Variety Testing Program, through this report,
seeks to provide that type of infonnation.
Information on varietal perfonnance is presented fran six test
locations in the state-three in the Piedrront, and three in the Coastal
Plain. Also included are multiple-year perfo:rmance data on a selected
nurrber of varieties.
CCMPARING VARIEI'IES
Perfonnance of a variety cannot; be detennined with absolute precision.
Even though the tests are conducted in a unifonn marmer, as much as
posaihle , uncontrollable variability exists arrong experimental plots due
to soil , fertility, noisture, insects, diseases, and other sources of
variation. Because this variability exists, statistics are used as a tool
2
to detennine differences arrong varieties. The size of difference anong
varieties which nay have been due to chance variation is listed in each
table as the B.L.S.D. (least significant difference). Those varieties
which do not differ byrrore than the B.L.S.D are not statistically different.
varietal perfonnance may appear inconsistent anong locations within
an area or arrong years at a particular location, thus i t is important for
the reader to examine results fran rrore than one location within an area
or rrore than one year at a particular location to obtain a rrore accurate
picture of relative varietal perfonnance. An effort has been made to
facilitate canparisons arronq locations and years in this report.
The varieties which do not yield significantly less than the. highest
yielding variety are denoted by an asterisk (*) next to their yields. The
relative perfonnance of a variety across locations within an area can be
easily evaluated by going across the table; those varieties which are rrost;
frequently marked by an asterisk would be highly desirable. Other agronanic
characteristics may be as equally inp:>rtant as yield. All available data
regarding pathologic and agronanic characteristics of the varieties are
found in Tables 1, 2 and 3 for barley, oats, and wheat, respectively.Y
It is suggested that the grower plant a small number of acres in a
new varietywhen first deteJ:mi.ning if it is adapted to his farm.
Table 1. Characteristics of barley varieties*
Mildew Rust Scald lDdging Winter Test length
resist- resist- resist- resist- hardi- Maturity weight of
Variety ance anee ance ance ness lb/bu awns
Bcx:m.e Fair Good Fair Good Good Early High Short
Clayton Good Excellent Fair Good Good Early Medium Awnless
Keowee Good Poor Fair Good Good Early High Short
Milton Fair Good Poor Excellent Good Early High Short
Redhill Good Good Fair Good Good Early High Awnless
McNair 601 Good Good Good Good Good Early TJ::M Awnless
Table 2. Characteristics of oat varieties* w
Rust Smut fusaic Winter IDdging Test
resist- resist- resist Maturity hardi- resist- weight
Variety ance anee ance ness anee lb/bu
Coker 227 Excellent Good Good Med. Early Good Good Med. High
Brooks Fair Good Good Early Good Excellent Med. High
Coker 716 Fair Good Good Mediun Good Excellent Med. High
Table 3. Characteristics of wheat varieties*
Leaf Soft
rust Mildew Mosaic Winter Lodging Height Test Wheat
resist- resist- resist- Maturity Hardi- resist- of Weight Milling
Variety anee ance ance ness anee Straw lb/bu Quality
Auburn Good Good Good Late Excellent Excellent Medium High Good
Caldwell Good Good Good Medium Good Fair Meditm High Good
Coker 747 Good Fair Good Medium Good Good Semi.-Dwarf High Good
Coker 762 Excellent Good Good Medium Fair Fair Semi-Dwarf Medium Good
Coker 797 Good Good Fair Early Fair Excellent Semi-IMarf High Good
Delta Queen Good Fair Good Medium Good Good semi.-Dwarf High Excellent
~
Hunter Good Good Good Early Fair Excellent Semi-Dwarf High Good
Massey Poor Good Good Medim Good Good Medium Medium Good
McNair 1003 Poor Good Good Medium Excellent Excellent Medium Medium Good
Pioneer brand 2550 Good Fair Excellent Medium Good Good Mediun High Fair
Roy Good Poor Good Medium Good Excellent Semi-Dwarf Medium Good
Southern Belle Good Fair Good Early Fair Excellent Semi-Dwarf High Excellent
Tyler Poor Good Good Late Good Good Medium Medium Excellent
Wheeler Fair Fair Good Medim Good Good Medium Good Excellent
5
EXPERIMENrAL PRCX:EDURE
The state is divided into three physiographic regions and tests were
located in the Piedmont, Coastal Plain, and Tidewater (Figure 1). Four
tests were located on private fanns
Y
and~
were on research stations.Entries: Carrrercial varieties and experimental lines developed by public
and private agencies are included in these tests. Any individual or finn
maymake application for having entries included by writing the Depart:rrent
of Crop Science, North carolina State University at Raleigh. A fee is
charged en an entry basis for all private entries. Entries about which
further infonnation was desired may have been included on a no-fee basis.
Atotal of 9, 8, and 20 camercial varieties and experimental lines of
barley, oats, and wheat, respectively, were evaluated in the 1981-82 season.
Field Plot Design: A randanized, carplete block design with four zepl.i>
caticns was used at each location.
Y
Each plot consisted of seven xos«,seven inches apart, sixteen feet long with two feet between each plot.
Crop Management: Cultural practices, such as seed bed preparation, date of
planting, fertilization and topdressing were in accordwith good fanning
practices and were unifo:rm for all entries at a given locatien (Table 4) •
severalnonths prior to planting each test, soil samples were obtained fran
the test field and fertilizer and Line applications were made accordingly .
.¥
The cooperatdve spirit and civic-minded service rendered by the famers who provided the land and the necessary cultural practices for these trials and the cooperation of the county agents are gratefully acknowledged.1982
• Signifies Official Variety Test Locations
Table 4. Cultural practices for small grain tests, 1981-82.
Area and Fertilizer Topdress Soil Date of Date of
Cooperator lbsjA
s
Grade pH lbsjA Type Planting HarvestPiednont Area
Chatham County 300 lbs. 33.5 N 6.2 200 lbs. 33.5% N Georgevi11e November 9 June 21
J. R. Thanpson 300 lbs. 0-46-0 Silt !.Dam
100 Ibs. 0-25-25
Lincoln County 500 lhs. 8-24-24 225 lbs. 33.5% N Cecil sandy October 20 June 16
Bess Fanrs, Inc. 1 ton 1ilre !.Dam
ReMan County 700 lbs. 10-20-20 5.6 Cecil Sandy october 19 June 16 -...J
Clyde MCSwain 1 ton line !.Dam
Coastal Plain Area
Chewan County 600 lbs. 0-15-15 6.2 300 lbs. 33.5% N Tetotum Fine November 4 June 9
Richard saunders 120 lbs. 33.5% N sandy !.Dam
lenoir County 300 lbs. 10-10-20 5.6 320 lbs. Norfolk October 22 June 8
sandy Barnes 30% Nit. Sol. loamy Sand
Wayne County 500 lbs. 5-10-30 3.3 300 lbs. 33.5% N ExumVery Fine October 21 June 15
wayland Price 100 lbs. 30% Sandy!.Dam
8
Agencies Sponsoring Entries
CokerIs Pedigreed Seed Ccnpany
Northrup King Ccnpany
North Arrerican Plant Breeders
North Carolina Agricultural Expt. Station
Pioneer Hi-Bred International, Inc.
Purdue University Agricultural Expt. Station
Rohm and Haas Catpany
South carolina Agricultural Expt. Station
Virginia Agricultural Expt. Station
Cooperators
Piedrront
Hartsville, South Carolina
laurinburg, North carolina
Brookston, Indiana
Raleigh, North Carolina
Tipton, Indiana
lafayette, Indiana
lafayette, Indiana
Clemson, South Carolina
Blacksburg, Virginia
Chatham County: J. R. Thanpson, Route 4, Siler City, North Carolina Agricultural EXtension Agent, carl OUtz
Ravan County: Clyde Mcswain, SUperintendent, Piedrront Research
station, Sallsbw:y, North Carolina
Agricultural Extensicn Agent, Steven Gatton
Linooln County: Bess Fanns, Inc., Route l, Lincolnton, North Carolina Agricultural EXtension Agent, Ben Knox
Coastal Plain
Wayne County: Wayland Price, Route 4, Mt. Olive, North Carolina Agricultural ~ensionAgent, B:ryan Page
ChCMan Cotmty: Richard Saunders, Route 2, Edenton, North Carolina County EXtension Chairman, J. Michael Williams
lenoir County: Sandy Barnes, SUperintendent, Lower Coa.stal Plain Tobacoo Research Station, Kinston, North Carolina
9
SFASCNAL CCNDITICNS
The 1981-82 small grain grcMing season was characterized by below
normal, temperatures and above normal rainfall. Rainfall at three locations
is shown below:
M:>nthly Rainfall Totals (Inches)
No- De- Jan-
Feb-IDeation october vernber cernber ~ rua:ry March April ~
lenoir County 1.92 0.72 4.48 4.71 4.60 2.40 4.76 2.52
LincoJn County 4.20 0.59 6.64 5.11 4.88 1.44 1.42 3.64
ReMan County 2.85 0.66 5.79 3.71 4.69 1.40 1.30 3.60
'It1ecool, wet weather in the spring set the stage for powdery mildew
which was evident at all locations. Later in the spring septaria glume blotch
wasseen in nurrerous fanrers' fields but did not appear to a significant
degree in plots of the Official Variety Test. rl.heat varieties were rated
for their susceptibility to pcMdery mildew. All other diseases were not
present to the extent that resistance or susceptibility could be rated.
Heavy rains in January and February delayed topdressing of nitzoqen and
caused nitrogen leaching at locations where all nitrogen was applied
preplant. Rains in early to mid-June delayed harvest of small grains and
resulted in a significant arrormt of lodging of barley at rrost; locations.
Small grains were extremely difficult to thresh at the LincoJn County
location and as much as 20-30% of the grain was left in the plots; consequently
10
RESULTS AND DISCUSSICN
Barley
Barley perfonnance is sumrrarized across the state inTable 5. Boone
and NC 75-140 were the two top yielding varieties_ this year. Test
weights were lCM and i t is thought to be a result of the unique weather
conditions prior to harvest. The Chatham County test was planted later
than normal, and the maturity data reflect the late planting date.
In the Piednont (Table 6), the Chatham County test was not harvested
due to severe lodging. Redhi11 led all entries with 69 bushels per acre
while Boone had the highest two and three year averages for yield. In the
Coastal Plain (Table 7), Boone and NC 75-140 were the top yielders across
locations. Yields in the Coastal Plain tended to be higher than in the
Piednont and may have been the result of late spring frosts experaenced to
a greater extent in the Piedrront.
oats
Coker 716 averaged 125 bushels per acre across the state (Table 8)
to lead the oat varieties. Again test weights were low although not as
dramatic as the barley and wheat test weights. Frequent rains in June
prevented rapid and tmifarm drying of the grain and consequently all entries
dried dCMIl to 18% rroisture at nearly the same ti.ne. Since date of maturity
was calculated when the grain reached this noisture level, nearly all
entries were detennined to be mature within a day 'or two of each other.
In the Piedmont (Table 9) Coker 716 was the top yielding variety for
1982 and had the highest yield for the past two and three years. In the
Coastal Plain (Table 10), the experinental NC 77-28 yielded 128 bushels
per acre follCMed closely by Coker 716 with 125 bushels per acre averaged
across locaticns. Test weights tended to be higher in the Coastal Plain
11
Wheat
Wheat yields ranged fran 30 bushels per acre for HW 3005 and HW 3006
to 56 bushels per acre for Cd<er 916 when averaged across all locations
(1able 11). Coker 797, Delta Queen, and Hunter had headed out prior to
late spring freezes and they may have received sore freeze damage resulting in
reduced yields. Test weights were ICM and again it is thought to be the
result of the unique weather conditions prior to harvest. IDdging was of
no consequence at any location. As seen in the barley, frequent rains in
Jtme prevented rapid and unifom drying, masking differences inmaturity.
Although the extent that pcMdery mildew affects yield is not known, poor
yields were evidenced in those entries that had high powdery mildew ratings.
In the Piedrront (Table 12) , Wheeler and McNair 1003 yielded significantly
morethan all other entries when averaged across locations. ~ averaged
over two and three years, McNair 1003 and Tyler had the highest two averages
for yield.
Coker 916 yielded significantly better than all other entries across
the Coastal Plain (Table 13) and was the highest yielder at every location
except Wayne County. Massey and Tylerwere the two top yielders at Wayne
County, Coker 916 and McNair 1003 have averaged 65 bushels per acre for
the last ~ years across the Coastal Plain while McNair 1003 leads the
three-year average with 60 bushels per acre. Test weights follow the sane
pattern as in barley and oats with Coastal Plain test weights being higher
12
Wheat and Flour Analyses
Coded samples of wheat were sul:mitted for wheat and flour analyses
to Statesville Flour Mills in Statesville. Such analyses are helpful in
detennining whether released varieties or potential varieties are suitable
for the mills in tenns of quality. Test weights of 60 pounds per bushel
or greater are desired. Moisture should not be over 15% because of keeping
qualities. In general, a protein content of 8-11% is desirable for soft
red winter wheat. Flour yield is a general indicator of milling quality
and a value of 72 is considered gocx:1 with higher values desirable. Ash is
a measure of the mineral content of the flour and the lower values are
desired. Since soft red winter wheat is used mainly for crackers and
cookies, a viscosity test was conducted to get a further indication of
quality. Table 14 lists the results of these tests. Special acknow1edgrrent
is due Statesville Flour Mills and Jane Cosby, In Charge of Statesville
13
Table 5. SUImaIy of barley perfonnance trials across the state.
Variety Yield Test wt. IDdging Plant Ht. Date 1/
or Line bU/A lbs/bu % in. Mature-:
Boone 85 44.0 47 33 JlIDe 4
Clayton 80 41.7 32 33 JlIDe 4
I<eavee 74 43.9 29 34 Jrme 5
Milton
McNair 601
Redhi11
+NC75-140
+NC 77-11
+Va. 75-42-55
69
72
78
84
73
65
40.8
40.9
40.0
40.7
42.2
40.1
29
30
26
25
32
24
30
33
35
38
33
35
Jrme 2
May31
Jnne 2
June 6
June 5
May31
!I
Data taken fran Chatham County test.14
Table 6. SUrrmary of barley performance trials in the Piedrront.
Variety
or Line
Boone
Clayton
Keavee
1982 Average 'IWo Year Average Three Year Average Yield Testwt. Yield Test wt. yield TestWt.
bu/A lbs/bu bu/A lbs/bu buiA lbs/bu
68* 42.5 82 44.7 81 45.1
61* 40.0 72 41.9 71 42.4
63* 42.5 76 44.5 74 45.3
Milton
McNair 601
Redhill
+NC 75-140
+NC 77-11
+Va. 75-42-55
57*
54
69**
60*
53
49
39.0
37.5
36.5
37.5
41.5
38.2
73 43.1 74 44.4
Mean of Test 61
-B.L.S.D. K-50 15
C.V. ( % ) 14.1
+Experimentals.
*Not significantly different fran highest yielder.
Table 7. SUnmal:y of barley performance trials in the Coastal Plain.
Chowan renoir Wayne 1982 Average 'IWo Year Average Three Year Average Varie1:Y County Cormty County yield Test Wt. yield Test wt. Yield Test wt.
or Line hulA hulA hulA buiA lbs/bu bu/A lbs/bu buiA Iba/bu
Boone 101** 82* 90* 90* 45.4 89 45.8 81 46.2
Clayton 100* 79* 79 85 43.4 83 45.7 77 45.7
Keowee 89* 71 74 78 45.3 82 46.4 76 46.9
Milton McNair 601 Redhill +NC 75-140 +NC 77-11 +Va. 75-42-55
Mean of Test
B.L.S.D. K-50
c.v. (
% )98* 96* 92* 99* 94* 88* 96 NS 7.5 50 65 84** 82* 72 54 72 7 8.0 69 72 68 94** 74 68 77 9 7.9 70 76 82 91** 79 68 81 4 7.8 42.5 44.2 43.4 43.8 42.9 41.9
83 45.4 78 46.2
~
U1
+Experirrentals.
*Not significantly different fran highest yielder.
16
Table 8. Suamary of oat performance trials across the state.
Variety Yield Test wt. Lodging Plant Ht. Date 1/
or Line bU/A lbs/bu % in. Mature--:
Brooks 107 32.0 16 37 June 12
Coker 227 102 28.7 22 36 June 12
Coker 716 125 30.8 21 40 June 13
+Coker 80-2oY 95 31.9 6 36
-
-
- -
-
- - -
-
-
-
-
-
-
- -
-
-
-
-
-
- - -
-
-
- -
-
-
-
- - -
-
-
-+NC 77-3 115 30.3 9 38 June 14
+NC77-28 118 29.5 2 31 Jrme 13
+NC 77-32 112 29.8 9 30 Jrme 14
+NC 78-17 110 32.1 8 38 Jrme 14
.!!Data taken fran Chatham County test.
Y
Enter ed only in Coastal Plain tests.17
Table 9. smmary of' oat perfar:rrance trials in the Piednont.
1982 Average TwoYear Average Three Year Average Variety yield Test Wt. Yield Test wt. Yield Test wt.
or Line bulA lbsjbu bulA Thsjbu buiA lbs/bu
Brooks 97* 30.2 116 33.3 107 33.5
Coker 227 92* 25.3 109 33.0 100 33.4
Coker 716 121** 28.6 130 35.2 114 35.2
+NC 77-3 120*
+NC 77-28 88*
+NC 77-32 77*
+NC 78-17 99*
28.2
26.8
26.7
29.7
Mean ofTest
-B.L.S.D. K-50
c.v. (
% )100
NS
22.5
+Experirrentals .
*Not significantly different fran highest yielder.
Table 10. Surrmaryof oat perfonnance trials in the Coastal Plain.
Chowan Lenoir Wayne 1982 Average Two Year Average Three Year Average Variety Connty County County Yield Test wt. Yield Test wt. Yield Test wt.
or Line buIA bu/A bu/A bu/A lbs/bu bu/A lbs,lbu bu/A lbsjbu
Brooks 105 105 121* 109* 33.2 119 35.0 109 35.0
Coker 227 117* 83 116* 103 31.0 107 34.7 100 35.3
Coker 716 122* 118* 139** 125* 32.3 129 35.7 116 35.9
-+Coker 80-20 85 83 124* 95 31.9
+NC 77-3 109* 98 133* 112* 32.0
+NC 77-28 131** 125* 127* 128** 31.9
+NC77-32 119* 126** 124* 123* 30.9
+NC 78-17 124* 112 106* 115* 34.2 ...
co
Mean of Test
B.L.S.D. K-50
c.v. (
%r
114 23 13.5
106 10
8.3
124
NS
11.9
114 20
11.5
+Experinentals •
19
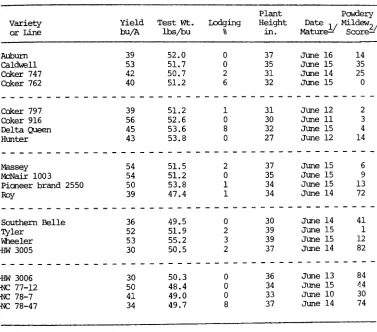
Table 11. 8umnaIy of wheat perfonnance trials across the state.
Plant P~ery
Variety Yield Test wt. Lodging Height Date
II
Mi1dew21or Line bulA lbs/bu % in. Mature-: Score-:
Auburn 39 52.0 0 37 June 16 14
caldwell 53 51.7 0 35 J\me 15 35
Coker 747 42 50.7 2 31 June 14 25
Coker 762 40 51.2 6 32 June 15 0
Coker 797 Coker 916 Delta Queen Hunter 39 56 45 43 51.2 52.6 53.6 53.8 1
o
8o
31 30 32 27 Jtme 12 June 11 June 15 June 12 2 3 4 14-
- -
-
- -
- -
-
- -
-
- - -
-
- -
-
-
-
-
- -
-
-
-
-
-
-
-
-
- -
- -
-
-
-
-
-Massey 54 51.5 2 37 June 15 6
~Nair 1003 54 51.2 0 35 June 15 9
Pioneer brand 2550 50 53.8 1 34 June 15 13
Roy 39 47.4 1 34 June 14 72
-
-
-
-
-
- -
-
-
-
- -
- -
-
-
-
- -
- - - -
-
-
-
-
-
-
-
-
- - - - -
--
-Southern Belle 36 49.5 0 30 Jtme 14 41
Tyler 52 51.9 2 39 June 15 1
Wheeler 53 55.2 3 39 June 15 12
+HW 3005 30 50.5 2 37 June 14 82
-
-
-
-
- -
-
-
- - -
-
-
-
-
-
-
- - -
-
- -
- -
- -
-
-
-
- -
-
-
-
-
- -
- -
-+HW 3006 30 50.3 0 36 June 13 84
+NC 77-12 50 48.4 0 34 June 15 t!4
+NC 78-7 41 49.0 0 33 J\me 10 30
+NC 78-47 34 49.7 8 37 Jrme 14 74
11
Data taken from ChathamCounty test.Y
Data taken fran Lenoir and Wayne oourrty tests. Scale 0 - 100 with 0 indicating no signs of the organism and 100 indicating carp1ete leaf coverage by organism.Table 12. SurtnlalY of wheat perfonnance trials in the Piedm:>nt.
Chatham ReMan 1982Average 'IWo Year Average Three Year Average
Variety Cormty ColIDty Yield Test wt. Yield Test wt. Yield Test Wt.
or Line bul A bu/A bulA lbs/bu bulA lbs/bu bu/A lbs/bu
Auburn 39 43 41 51.0 56 55.8
caldwell 48 52* 50 47.1 59 53.9
Coker 747 41 39 40 49.9 54 55.0 52 57.0
Coker 762 38 24 31 47.5 51 53.2 50 54.4
Coker 797 Coker 916 Delta Queen Hunter 40 52* 41 44 26 42 39 27 33 47 40 36 43.8 48.8 50.0 51.6 62 54 54.4
54.7 48 56.2
Massey 58** 43 51 48.2
McNair 1003 56* 48 52* 47.9 66 53.4 59 55.0
Pioneer brand 2550 47 45 46 51.4 tv
Roy 41 33 37 44.5 55 51.8 54 53.7 0
- -
- -
- -
- - - - -
-
-
-
-
- -
-
- -
-
-
~- -
-
-
-
-
-
-
-
- -
-
-
- -
- - -
-
- -
-
-
- -
- -
-
-
-Southern Belle 36 26 31 45.0 52 52.8 51 55.8
Tyler 52* 42 47 50.4 65 55.1 60 56.4
Wheeler 53* 55** 54** 52.5 61 56.4 56 57.9
+HW 3005 36 26 31 47.0
+HW 3006 -f-NC 77-12 +OC 78-7 +NC 78-47 33 47 28 38 27 45 28 24 30 46 28 31 46.8 43.9 46.3 46.4
- -
-
-
-
-
-
- -
-
-
-
-
-
-
-
_
..~--- - - - - - - - - - - - --
- - --
- - - --
- - - - - - - - - --Mean of Test B.L.SJ). K-50 C.V. (% )
43
-,-13.5 365
10.2 403"
7.5 +ExperiIrentals.Table 13. Sumnary of wheat perfannance trials in the Coastal Plain.
Chowan lenoir Wayne 1982 Average 'Th7o Year Average Three Year Average Variety County Coilllty COilllty Yield Test Wt. Yield Test Wt. yield Test wt.
or Line bu/A bulA bulA buiA lbs/bu bu/A lbs/bu btl/A lbs/bu
Auburn 33 36 45 37 52.8 47 57.2
caldwell 58 48 61 55 55.4 59 58.3
Coker 747 39 34 55 42 51.3 53 56.4 52 57.9
Coker 762 39 42 58 45 53.5 55 56.1 53 56.3
-
-
-
-
-
-
- -
-
-
-
-
-
-
- - -
-
-
-
-
-
-
- -
-
-
-
-
-
-
-
- -
-
-
- -
- -
-
- - - -
-
-
-
-
- - - -
-Coker 797 41 37 53 43 53.4 53 57.3
Coker 916 66** 58** 63 62** 56.0 65 58.5
Delta Queen 47 43 53 47 56.6 55 58.4 51 58.5
Hunter 43 42 61 48 55.9
Massey 57 43 69**- 55 54.4
McNair 1003 57 44 63 54 54.5 65 57.7 60 57.9
Pioneer brand 2550 50 48 59 52 56.0 N
Roy 38 33 51 40 48.8 56 54.5 52 55.2 ...
-
- - -
- - -
- -
- -
-
-
-
-
-
-
-
-
- -
- -
-
-
-
-
-
-
-
-
-
-
- - -
- - - -
-
--
-
-
-
--
-
-
-Southern Belle 33 33 51 38 51.2 52 56.5 50 58.3
Tyler 50 48 66* 54 52.7 63 56.6 58 57.5
Wheeler 55 43 60 52 57.7 60 59.7 55 60.0
+HW 3005 27 22 39 28 52.9
+HW 3006
+NC 77-12 +NC 78-7 +NC 78-47
Mean of Test B.L.S:D. K-50 C.V. ( % )
25 52 41 32 44
S-10.8 23 42 45 33 40 i f 9.1 42 63 62 43 56"6
8.5 29 51 48 35 46 3" 9.6 52.1 50.9 50.4 52.4 +Experi.rrentals.Table 14. Carrparism of wheat entries for wheat and flour qualities.
Wheat Analysis Flour Analysis
Variety % % Test Flour Quality!! % % Flour
. . 2/
or Line Moisture Protein Weight Yield Score Moisture Ash Protein Color V1SCOSltyScor~
Auburn 17.4 11.8 59.0 74 E 14.0 .47 7.82 56 44 1
Caldwell 12.9 10.0 57.5 74 G 14.5 .45 7.66 55 42 1
Coker 747 13.2 10.6 61.0 72 F 14.3 .41 8.69 64 59 1
Coker 762 14.1 9.5 58.8 71 F 14.4 .47 8.34 46 63 1
Coker 797 12.1 10.4 56.5 73 F 14.1 .47 8.21 59 53 1
Coker 916 13.0 10.7 58.5 72 G 13.7 .50 7.93 56 45 1
Delta Queen 17.6 12.8 59.0 72 G 14.2 .51 9.29 67 73 1
Hunter 13.0 10.7 61.3 73 G 14.1 .48 8.66 60 73 3
Massey 14.0 11.0 60.0 72 G 14.2 .47 8.98 62 55 1
McNair 1003 13.7 11.5 60.0 72 G 14.2 .52 9.31 49 42 2 f'V
f'V
Pioneer brand 2550 14.4 10.0 58.8 71 F 14.8 .46 7.20 60 43 1
Roy 13.3 9.9 57.8 74 G 13.7 .50 7.89 57 35 1
Southern Belle 12.0 11.2 58.3 73 G 13.9 .48 8.86 56 55 1
Tyler 14.2 9.6 57.5 74 G 14.1 .48 7.57 59 55 3
Wheeler 14.1 10.7 59.5 74 E 14.5 .44 8.79 58 59 1
+HW 3005 14.7 10.3 NA 71 F 14.3 .45 9.16 56 60 2
+HW 3006 12.3 11.7 NA 74 G 14.2 .43 8.63 62 66 2
+NC 77-12 12.8 10.2 56.5 74 E 14.3 .47 8.29 45 44 2
+NC 78-7 12.4 9.7 53.0 71 F 13.6 .47 7.01 60 35 1
+NC 78-47 14.6 12.1 55.3 69 F 13.6 .49 7.63 58 41 1
+Experirnenta1s.
Y'Milling Quality Score - E= Excellent, G= Good, F = Fair