18th International Conference on Structural Mechanics in Reactor Technology (SMiRT 18) Beijing, China, August 7-12, 2005 SMiRT18-K04-2
LARGE SCALE VIBRATION TESTS ON PILE-GROUP EFFECTS
USING BLAST-INDUCED GROUND MOTION
Katsuichirou Hijikata
The Tokyo Electric Power Company Power Engineering R&D Center
Hideo Tanaka
The Tokyo Electric Power Company Power Engineering R&D Center
Takayuki Hashimoto
The Japan Atomic Power Company Projects Development Department
Kazushige Fujiwara
The Japan Atomic Power Company Projects Development Department
Yuji Miyamoto
Kobori Research Complex Inc.
Osamu Kontani*
Kobori Research Complex Inc.
6-5-30, Akasaka, Minato-ku, Tokyo, 107-8502 Japan
Phone:+81-3-5561-2434 Fax:+81-3-5561-2345 E-mail: [email protected]
ABSTRACT
Extensive vibration tests have been performed on pile-supported structures at a large-scale mining site. Ground motions induced by large-scale blasting operations were used as excitation forces for vibration tests. The main objective of this research is to investigate the dynamic behavior of pile-supported structures, in particular, pile-group effects.
Two test structures were constructed in an excavated 4m-deep pit. Their test-structures were exactly the same. One structure had 25 steel piles and the other had 4 piles. The test pit was backfilled with sand of appropriate grain size distributions to obtain good compaction, especially between the 25 piles.
Accelerations were measured at the structures, in the test pit and in the adjacent free field, and pile strains were measured. Dynamic modal tests of the pile-supported structures and PS measurements of the test pit were performed before and after the vibration tests to detect changes in the natural frequencies of the soil-pile-structure systems and the soil stiffness.
The vibration tests were performed six times with different levels of input motions. The maximum horizontal acceleration recorded at the adjacent ground surface varied from 57 cm/s2 to 1,683 cm/s2 according to the distances between the test site and the blast areas.
Keywords: vibration test, blast-induced ground motion, pile-supported structure, pile-group
1. INTRODUCTION
Pile foundations have become very widely used for ordinary buildings, including high-rise buildings in Japan. Since they are very flexible, pile foundations can be particularly useful to promote the siting of new nuclear facilities. However, before they can be used in nuclear facilities, it is very important to experimentally demonstrate their applicability. Since very strong earthquake motions are employed in designing nuclear facilities, understanding of dynamic behaviors of the soil-pile-structure system needs to be incorporated in the structural design of pile foundations.
The authors have conducted vibration tests at a mining site to investigate liquefaction phenomena and dynamic behaviors of pile foundations (Kamijo, 2001)(Kontani, 2001). In this research, the same test methods were employed to investigate (1) pile-group effects of pile-supported structure, (2) vertical responses of pile-supported structure, (3) non-linear response of pile itself and (4) verification of response analysis methods.
In order to meet the above objectives, vibration tests of pile-supported structures were performed at a large-scale mining site. Ground motions from large-scale blasting operations were used as excitation forces for the vibration tests. A significant aspect of this test method is that vibration tests could be performed several times with different levels of input motions, because the blast areas moved closer to the fixed location of the test structure.
This paper outlines the vibration tests and presents test results.
2. VIBRATION TEST METHOD USING BLAST-INDUCED GROUND MOTIONS
The vibration test method using ground motions induced by mining blasts is shown schematically in Figure 1. Common ways for performing vibration tests on structures are Shaking Table Tests, Forced Vibration Tests and Earthquake Observations. These methods are very
useful in many ways. However, none are capable of shaking a large-scale soil-pile-structure system at large amplitude. The vibration test method shown in Figure 1 had the following advantages over the conventional test methods.
• Large-scale structures could be tested.
• Ground motions of various amplitudes could be applied in accordance with the distances between the test site and blast areas.
• Three-dimensional effects and soil-structure interaction in the actual ground could be considered.
Vibration tests on pile-supported structures were conducted at Black Thunder Mine of Arch Coal, Inc. Black Thunder Mine is the largest coal mine in North America and is located in northeast Wyoming, USA. Since its operation is very active, there were many opportunities to take advantage of large ground motions at the test site. At the mine, there is an overburden (mudstone layers) over the coal layers. The overburden is dislodged by large blasts called "Cast Blasts" and the rubble is removed by huge earthmoving equipment. After the coal surface is exposed, smaller blasts called "Coal Shots" are applied to loosen the coal
Explosive
Blast Area
Clay and Mudstone Layer Test Structure
Test Pit
Coal Layer
Explosive
Blast Area
Clay and Mudstone Layer Test Structure
Test Pit
Coal Layer
layers. The coal is then mined out by truck and shovel operation. The ground motions induced by Cast Blasts were used for the vibration tests conducted in this research. The smaller Cast Blasts or Coal Shots were mainly used to check and calibrate instruments.
3. DETAILS OF VIBRATION TEST
Vibration tests were performed several times with different levels of input motions. Accelerations of the test pit, the adjacent free field, and both the test structures were measured. Strains of the pile
foundations were also measured. Soil properties, shear wave velocities and densities of the test pit were measured using several different methods. Dynamic modal tests were performed before and after the vibration tests in order to detect changes in soil stiffness and the natural frequencies of the soil-pile-structure systems.
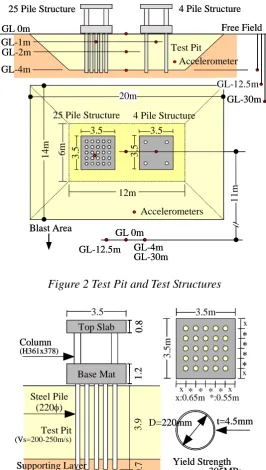
Figure 2 shows the outlines of the sand test pit and the test structures. Figure 3 shows the details of the 25-pile structure. Two test structures were constructed in an excavated 4m-deep pit. The test structures were exactly the same; one had 25 steel tubular piles and the other had 4 piles. The test pit was backfilled with sand with a grain size distribution suitable for good compaction, especially between the 25 piles. Spaces were formed underneath the base mat slabs to minimize friction between the slabs and the test pit surface.
Figure 2 shows the locations of accelerometers in the adjacent free field. Figure 4 shows the locations of accelerometers at the test structures. Figure 5 shows the locations of strain gauges on the piles. There were 47 channels for accelerometers and 108 for strain gauges. The sampling frequency was 500 Hz. The locations of accelerometers in the vertical array at the free field were determined from the soil profile, as shown in
11
m
Accelerometers
Accelerometer Test Pit
25 Pile Structure 4 Pile Structure
GL 0m Free Field
25 Pile Structure 4 Pile Structure
Blast Area GL-1m
GL-2m
GL-4m
GL-12.5m GL-30m
3.5
3.5
3.
5
3.5
14
m
20m
GL-12.5m GL 0m
GL-4m GL-30m
6m
12m
11
m
Accelerometers
Accelerometer Test Pit
25 Pile Structure 4 Pile Structure
GL 0m Free Field
25 Pile Structure 4 Pile Structure
Blast Area GL-1m
GL-2m
GL-4m
GL-12.5m GL-30m
3.5
3.5
3.
5
3.5
14
m
20m
GL-12.5m GL 0m
GL-4m GL-30m
6m
12m
Figure 2 Test Pit and Test Structures
0.8
Steel Pile (220φ)
Test Pit
(Vs=200-250m/s)
3.
9
0.7
1.
2
t=4.5mm Column
(H361x378)
3.5 Top Slab
Base Mat
3.5
m
3.5m
* * * * x
x
* * * *
x
x
x:0.65m *:0.55m
Yield Strength =305MPa D=220mm
Supporting Layer
(Vs=340m/s)
0.8
Steel Pile (220φ)
Test Pit
(Vs=200-250m/s)
3.
9
0.7
1.
2
t=4.5mm Column
(H361x378)
3.5 Top Slab
Base Mat
3.5
m
3.5m
* * * * x
x
* * * *
x
x
x:0.65m *:0.55m
Yield Strength =305MPa D=220mm
Supporting Layer
(Vs=340m/s)
Figure 6. Strain gauges were installed on the piles to measure the bending moments and axial forces at different locations. Pile B had 4 strain gauges at its top. Pile A had 12 more strain gauges to investigate the vertical strain distributions.
4. CONPACTION OF TEST PIT
In investigating the soil-pile-structure interaction of test structures it was very important to make soil properties of the test pit uniform. Sand having a grain size distribution suitable for good compaction was selected based on laboratory tests of several sand samples. During backfilling, the sand densities and water contents of each layer after compaction were measured using radiation measurement equipment. Figure 7 shows the sand densities and water contents of each layer. The properties of the compacted sand were fairly uniform throughout the depth of the test pit.
5. VIBRATION TEST RESULTS
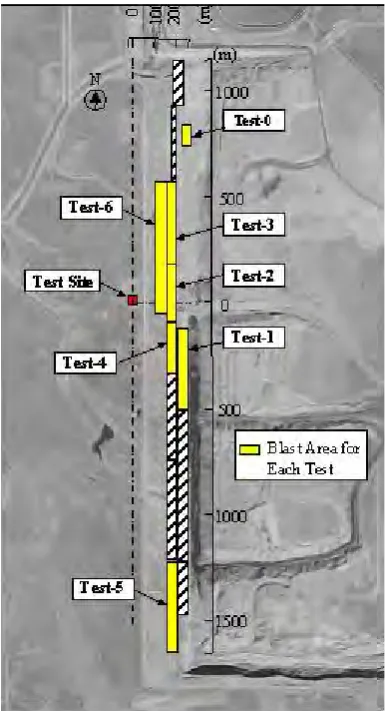
Figure 8 shows the scene of vibration Test-4 at Black Thunder Mine. Figure 9 shows the locations of the test site and blast areas for each test. Six vibration tests were performed, from Test-1 to Test-6. Test-0 was conducted to evaluate the initial properties of the soil-pile-structure interaction system with
A1 B11
B10 B5
A4 B12
B8
B6 B7
B9
B14
A2
A3 B15
B13
Figure 4 Locations of Accelerometers Top Slab
UD UD :
a20v EW :a21e
EW : a24e EW : a29e
NS : a27n EW : a26e
UD
UD EW
NS
EW UD
EW NS EW
Blast Area
Uni-Axial Accelerometer Base Mat Top Slab
UD UD :
a20v EW :a21e
EW : a24e EW : a29e
NS : a27n EW : a26e
UD
UD EW
NS
EW UD
EW NS EW
Blast Area
Uni-Axial Accelerometer Base Mat
Base Mat
Pile B Pile A -0.80
-1.55
-2.30
-3.05
-3.80 +0.05 -0.05
GL(m) Base Mat
Pile B Pile A -0.80
-1.55
-2.30
-3.05
-3.80 +0.05 -0.05 GL(m)
Pile A Pile B
Strain Gage A1
B11 B10 B5
A4 B12
B8
B6 B7
B9
B14
A2
A3 B15
B13
Figure 4 Locations of Accelerometers
0 1000 2000 3000
-30 0
-25 -20 -15 -10 -5
(m/sec)
G
L
(m
)
Silty Sand
Gray Clay Shale
Brownish Clay Shale
Gray Clay Shale
▼
Vs
Vp
Figure 5 Locations of Strain gauges Figure 6 Soil Profile at Test Site
1.6 1.8 2.0 2.2
-4.0 0.0
-3.0 -2.0 -1.0
Density(g/cm3)
GL
(m
)
0 5 10 15 20
Water Content (%)
Average 1.86g/cm3
Average 11.3%
1.6 1.8 2.0 2.2
-4.0 0.0
-3.0 -2.0 -1.0
1.6 1.8 2.0 2.2
-4.0 0.0
-3.0 -2.0 -1.0
Density(g/cm3)
GL
(m
)
0 5 10 15 20
Water Content (%)
Average 1.86g/cm3
Average 11.3%
Figure 7 Densities and Water Contents of Sand measured during Backfilling
a much smaller input motion.
The test results are summarized in Table 1. The distances between the test site and the blast areas varied from 110m to 1230m, and produced different levels of ground motions in the free field. Since the blast area was the closest to the test site and its blast area was the largest, Test-6 shows the maximum ground acceleration of the six vibration tests. They were 1,683 cm/s2 in the EW direction and 1,496 cm/s2 in the NS direction.
The horizontal accelerations at the top slab varied from 136cm/s2 to 1,857cm/s2 for the 25-pile structure, and from 52cm/s2 to 1,396cm/s2 for the 4-pile structure for the six tests. The maximum strain was 13400 micro strains at the pile top of the 4-pile structure during Test-6, which exceeded the yield strain of the steel pile. Accordingly, the steel piles of the 4-pile structure were found to have yielded. However, those of the 25-pile structure were still in the elastic region.
6. ALTERNATION OF DYNAMIC
PROPERTIES OF TEST PIT AND TEST STRUCTURES
It was observed that some space (about 3cm) was generated between the piles and the surrounding soil of the 4-pile structure during the
strong ground motions of Test-2, as shown in Figure 10. However, no space was observed in the 25-pile structure.
Figure 11 shows the shear wave velocities (Vs) of the test pit measured by PS measurement using geophones after each test. Seven geophones were located at the bottom of the test pit (GL-4.0m) and one at GL-2.0m. The average Vs throughout the depth of the test pit stayed at the same level, around 250m/s, after five vibration tests. After Test-6, that brings the largest ground motions, the average Vs decreased because of the nonlinearity of the soil in the whole test pit.
Figure 9 Locations of Test Site and Blast Areas
Table 1 Summary of Vibration Tests Max. Acc. at Ground Surface (cm/s2)
Max. Strain of Piles (micro strain) Free Field Test Bed 25-Pile Structure 4-Pile Structure
Test
No. (m) EW NS UD EW NS UD EW NS UD EW NS UD 25-Pile 4-Pile
0 770 - - - 17 25 17 - - 44 61 21 22 41
1 250 439 422 279 304 267 284 573 586 198 487 382 233 209 653
2 160 794 567 408 432 534 314 1244 748 246 560 451 352 464 1335
3 240 349 382 283 227 366 296 355 541 225 227 384 288 130 778
4 190 410 607 357 272 401 337 939 689 223 425 423 315 309 820
-Distance*
Max. Acc. at Top Slab (cm/s2)
* Distance between Test Site and the Center of Blast Area 5
6
1230 57 100 33 44 107 39 136 318 28 52 66 56
110 1683 1496 4065 1066 1356 3122 1449 1857 1955 1396 1077 1506 13399
74 207
Figure 12 shows the alternation of the natural frequencies of the soil-pile-structure interaction system after each test. The natural frequencies were evaluated by dynamic modal tests. The natural frequencies of the 25-pile structure stayed at the same levels in the NS direction as well as in the EW direction until Test-5. However, there were large decreases in the natural frequencies of the 4-pile structure in both NS and EW directions, especially after Test-2. This was due to the space generated between the piles and surrounding soil resulting from the severe vibration of the structures during Test-2. The natural frequency of the 25-pile structure decreased slightly after Test-6, but that of the 4-pile structure increased. The reason for the change of the 25-pile structure is thought to be nonlinearity of the surrounding soil. For the 4-pile structure, the test structure settled and a part of the base mat touched the test pit surface. This caused the increment of the natural frequency.
7. RESPONSES OF TEST PIT AND ADJACENT FIELD
Figure 13 shows the distributions of the maximum accelerations in the EW and vertical directions measured by the vertical array at the test pit and the adjacent free field. The maximum accelerations in the EW direction were amplified as the ground motions propagated upward, except for Test-6. Amplification of acceleration of the free field in Test-6 is thought to be different from the other tests because the ground
Figure 10 Spaces generated during Test-2
150 200 250 300
Test-1 Test-2 Test-3 Test-4 Test-5 Test-6 Average of 7 points measurement
GL0m - GL-2m
Sh
e
a
r
W
a
v
e
V
e
lo
c
it
y
(
m
/s
)
GL0m - GL-4m
Figure 11 Shear Wave Velocities of Test Pit (measured after Vibration Test)
0 1000 2000 Test-6 0 200 400 600
Test-4
0 500 1000 Test-2 -30
-25 -20 -15 -10 -5 0
0 200 400 600
GL (m)
Test Field
Free Field
Test-1
0 2000 4000 6000 Test-6 0 200 400 600
Test-4
0 200 400 600 Test-2 -30
-25 -20 -15 -10 -5 0
0 200 400
GL (m)
Test Field
Free Field
Test-1
EW Direction (cm/s2) Vertical Direction (cm/s2)
Figure 13 Distributions of the Maximum Accelerations at Adjacent Free Field and Test Pit 0
1 0
2 4 6 8
Hz
T e s t- 0 T e s t- 1 T e s t- 2 T e s t- 3 T e s t- 4 T e s t- 5 T e s t- 6
25pile
4pile
NS EW NS EW
N
atu
ra
l Fr
eque
ncy (
H
z)
acceleration amplitude was much larger than in the other tests. The amplification in the test pit was smaller than in the adjacent field above GL–4.0m because of the non-linearity of the sand in the test pit. The maximum accelerations in the vertical direction were amplified as the motions propagated upward. The amplifications were much greater above GL-4.0m than below GL-4.0m.
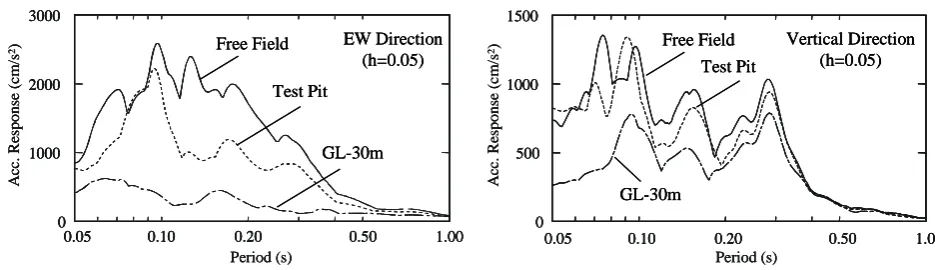
Figure 14 shows the acceleration records in the EW and vertical directions at the ground surface in the test pit as well as in the adjacent free field in Test-2. The duration of the motions were 2 to 3 seconds and the peak values occurred at the same time. Figure 15 shows the response spectra at the ground surface together with that at GL-30m. The responses in the EW direction were greater at the free field surface than at the test pit surface over the entire frequency region because of the non-linearity of the compacted sand. However, the responses in the vertical direction at the free field surface were the same as those at the test pit surface.
Figure 16 shows amplifications obtained from Fourier spectrum ratios of the test pit surface against GL-4.0m for Test-0 and Test-2 together with the resonance curve evaluated from one-dimensional wave propagation
theory (SHAKE). The resonance curve shows a peak at 0.06 seconds, which shows good agreement with the peak at 0.07 obtained from Test-0 of the small blast. The peak at 0.07 seconds corresponded to a Vs of 230m/s in the test pit. The peak obtained from Test-2 is shifted to 0.09 seconds due to non-linearity of the sand. This period corresponds to Vs of 175m/s in the test pit. 10. (sec.) cm/sec 2
500
-500 cm/sec 2
500
-500 (Free Field, EW)
(Test Pit, EW)
10.
(sec.)
cm/sec 2
300
-300
cm/sec 2
300
-300 (Free Field, UD)
(Test Pit, UD)
cm/s2 cm/s2 (s) cm/s2 cm/s2 (s) 10. (sec.) cm/sec 2
500
-500 cm/sec 2
500
-500 (Free Field, EW)
(Test Pit, EW)
10.
(sec.)
cm/sec 2
300
-300
cm/sec 2
300
-300 (Free Field, UD)
(Test Pit, UD)
cm/s2 cm/s2 (s) cm/s2 cm/s2 (s)
Figure 14 Acceleration Records at Surface of Test Pit and Adjacent Free Field (Test-2)
0.05 0.10 0.20 0.50 1.00
0 3000 1000 2000 Period (s) Free Field Test Pit GL-30m EW Direction (h=0.05) A cc. R esponse ( c m /s 2)
0.05 0.10 0.20 0.50 1.00
0 1500 500 1000 Free Field Test Pit GL-30m Vertical Direction (h=0.05) Period (s) A cc. R esponse ( c m /s 2)
0.05 0.10 0.20 0.50 1.00
0 3000 1000 2000 Period (s) Free Field Test Pit GL-30m EW Direction (h=0.05) A cc. R esponse ( c m /s 2)
0.05 0.10 0.20 0.50 1.00
0 3000
1000 2000
0.05 0.10 0.20 0.50 1.00
0 3000 1000 2000 Period (s) Free Field Test Pit GL-30m EW Direction (h=0.05) A cc. R esponse ( c m /s 2)
0.05 0.10 0.20 0.50 1.00
0 1500 500 1000 Free Field Test Pit GL-30m Vertical Direction (h=0.05) Period (s) A cc. R esponse ( c m /s 2)
0.05 0.10 0.20 0.50 1.00
0 1500
500 1000
0.05 0.10 0.20 0.50 1.00
0 1500 500 1000 Free Field Test Pit GL-30m Vertical Direction (h=0.05) Period (s) A cc. R esponse ( c m /s 2)
Figure 15 Response Spectra Evaluated from Acceleration Records (Test-2)
0.05 0.10 0.20 0.30 0.400.50 0 15 1 5 10 Period (s) SHAKE (h=0.05) Test-0 Test-2 Am plifi cat io n
0.05 0.10 0.20 0.30 0.400.50 0
15
1 5 10
0.05 0.10 0.20 0.30 0.400.50 0 15 1 5 10 Period (s) SHAKE (h=0.05) Test-0 Test-2 Am plifi cat io n
Figure 16 Amplifications obtained from
8. RESPONSES OF TEST STRUCTURES
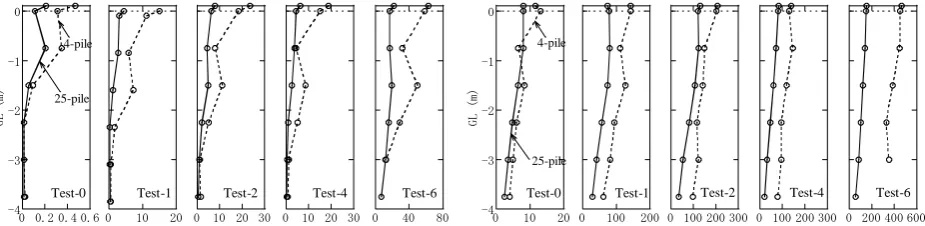
Figure 17 shows the distributions of the maximum accelerations of the test structures and the test pit from Test-1 to Test-6. The maximum accelerations of the 25-pile structure in the EW direction were amplified as the vibration propagated upward from the bottom (GL-4.0m) of the test pit to the top slab for all the tests. The maximum accelerations of the 4-pile structures in the EW direction were amplified as the vibrations propagated upward from the bottom of the test pit to the top slab only for Test-1. For Test-2 and Test-4, the maximum accelerations of the structure stayed at the same levels as the accelerations in the test pit. This is because there were spaces generated between the piles and surrounding compacted sand in the 4-pile structure. For Test-6, the maximum acceleration at the top slab was amplified to more than 1000cm/s2 because of the larger acceleration input motion than the other tests.
In the vertical direction, the maximum accelerations were amplified in the test pit, but not in the test structures. The maximum accelerations in the test pit were amplified as the vibration propagated upward, while the
accelerations at the top slab and the base mat remained at the same level.
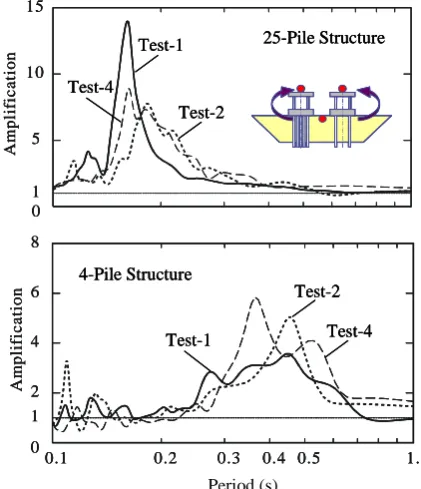
Figure 18 shows the amplification evaluated as Fourier spectrum ratios from the top slab to the test pit surface in the EW direction. For the 25-pile structure, there was a small shift in the first natural period during Test-2 and Test-4. After the test, however, the period seemed to almost return to the value before the test, as indicated in Figure 12. For the 4-pile structure, however, there was no clear peak in the Fourier spectrum ratio of Test-1 because the natural frequency changed during the ground motions. Peaks are found at 0.45 seconds for Test-2, and at 0.35 and 0.53 seconds for Test-4. The peaks shifted into longer periods as the vibration tests were repeated. This is because the spaces between the piles and the surrounding sand imparted strong
0 1000 2000 Test-6
0 500 1000 1500 Test-4
0 500 1000 1500 Test-2 -4
-3 -2 -1 0 1 2 3 4 5
0 200 400 600
GL
(m
)
4-pile
25-pile
Test-1 Top slab
Base mat
0 2000 4000 Test-6
0 200 400 600 Test-4
0 200 400 600 Test-2 -4
-3 -2 -1 0 1 2 3 4 5
0 200 400
GL
(m
)
4-pile
25-pile
Test-1 Top slab
Base mat
EW Direction (cm/s2) Vertical Direction (cm/s2)
Figure 17 Distributions of Maximum Accelerations at Test Structures and Test Pit
0 15
1 5 10
Am
pl
if
ic
at
io
n
0.1 0.2 0.3 0.4 0.5 1.0
0 8
1 2 4 6
Period(sec)
A
m
p
li
fic
a
tio
n
Test-1
Test-2 Test-4
25-Pile Structure
Test-1
Test-2
Test-4 4-Pile Structure
Period (s) 0
15
1 5 10
Am
pl
if
ic
at
io
n
0.1 0.2 0.3 0.4 0.5 1.0
0 8
1 2 4 6
Period(sec)
A
m
p
li
fic
a
tio
n
Test-1
Test-2 Test-4
25-Pile Structure
Test-1
Test-2
Test-4 4-Pile Structure
0 15
1 5 10
Am
pl
if
ic
at
io
n
0.1 0.2 0.3 0.4 0.5 1.0
0 8
1 2 4 6
Period(sec)
A
m
p
li
fic
a
tio
n
Test-1
Test-2 Test-4
25-Pile Structure
Test-1
Test-2
Test-4 4-Pile Structure
Period (s)
non-linearities to the 4-pile structure.
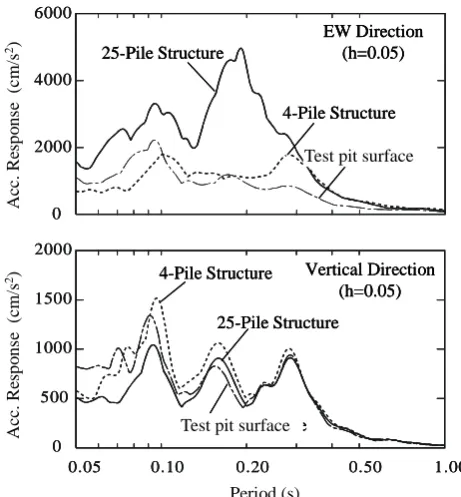
Figure 19 shows the response spectra at the top slab for Test-2 together with the responses at the test pit surface. The responses of the 25-pile structure in the EW direction were the same as those of the 4-pile structure in the region of more than 0.3 seconds, and greater than those of the 4-pile structure in the region less than 0.3 seconds. The response of the 25-pile structure in the vertical direction was smaller than those of the 4-pile structure in the region of less than 0.3 seconds. This is because the ground motions with high frequencies were filtered out by the pile-group effects of the 25-pile structure.
Figure 20 shows the relationship between the inertia forces (Q) of the test structure and the relative displacements (d) between the base mat and the test pit surface, as well as the gradient lines. The inertia forces were calculated from the response accelerations at the test structures and the weights of the test structure. The gradient of Q-d stands for the soil spring of the soil-pile-structure interaction system and the lines were drawn between the origin and the points corresponding to the maximum relative displacements. The gradient of Q-d at the maximum displacement of Test-2 is smaller than those of Test-1. In particular, the Q-d of the 4-pile structure gives a relatively large hysteresis loop, and those of the 25-pile structure give a smaller loop
area. The hysteresis loop for the 4-pile structure is S-shaped, which is different from that of the 25-pile structure. This is because the spaces generated between the piles and the surrounding soil changes the characteristics of the soil spring. Because of the pile group effect, the soil spring per one pile for a 25-pile structure is about 60 to 70% of that for the 4-pile structure.
9. BENDING MOMENT AND AXIAL FORCE OF PILES
Figure 21 shows the vertical distributions of the maximum bending moments and axial forces of piles
-200 200
-100 0 100
-1.0 -0.5 0.0 0.5 1.0 -200 200 -100 0 100 Relative Disp.(cm) -1.0 -0.5 0.0 0.5 1.0
-600 600 -400 -200 0 200 400 Relative Disp.(cm) Sh ear F orce (k N ) -400 400 -200 0 200 S hea r F o rc e(kN ) Test-1 25-pile Test-1 4-pile Test-2 25-pile Test-2 4-pile 1290kN/cm
(52kN/cm) 270kN/cm
750kN/cm (30kN/cm)
180kN/cm
(45kN/cm)
Figure 20 Relationship between inertia forces (Q) of test structure and relative displacements (d) between base mat and test pit surface.
0 6000 2000 4000 A cc. R e sp o n se (c m /sec ) 2
0.05 0.10 0.20 0.50 1.00
0 2000 500 1000 1500 Period(sec) A cc. Respo n se( cm /sec ) 2 EW Direction (h=0.05) 25-Pile Structure 4-Pile Structure
Test bed Surface
4-Pile Structure
25-Pile Structure
Test bed Surface
Vertical Direction (h=0.05) Period (s) Acc . Re sp o n se (c m /s 2) Ac c. Re sp o n se (c m /s 2) 0 6000 2000 4000 A cc. R e sp o n se (c m /sec ) 2
0.05 0.10 0.20 0.50 1.00
0 2000 500 1000 1500 Period(sec) A cc. Respo n se( cm /sec ) 2 EW Direction (h=0.05) 25-Pile Structure 4-Pile Structure
Test bed Surface
4-Pile Structure
25-Pile Structure
Test bed Surface
Vertical Direction (h=0.05) 0 6000 2000 4000 A cc. R e sp o n se (c m /sec ) 2
0.05 0.10 0.20 0.50 1.00
0 2000 500 1000 1500 Period(sec) A cc. Respo n se( cm /sec ) 2 EW Direction (h=0.05) 25-Pile Structure 4-Pile Structure
Test bed Surface
4-Pile Structure
25-Pile Structure
Test bed Surface
Vertical Direction (h=0.05) Period (s) Acc . Re sp o n se (c m /s 2) Ac c. Re sp o n se (c m /s 2)
Figure 19 Response Spectrum at Top Slab(Test-2)
Test pit surface
located at the corner of the base mat. The bending moments and the axial forces show maximum values at the tops of the piles for both structures. The shape of the bending moment distributions of the 4-pile structure varied with the amplitude of the input ground motions. The bending moment shows maximum values at GL-0.8m for Test-0 and at GL-1.55m in the soil for Test-1 to Test-6. The axial force ratios of the top to the bottom of the pile are 3 for Test-0 and 1.5 for Test-2 to Test-6. This is because a large portion of the axial forces propagated though the piles without radiating into the surrounding soil after the spaces are created between the piles and the surrounding soil.
Figure 22 shows bending moment records and axial force records of the corner piles, A1 and A4, at the top (GL+0.05m) and below ground level (GL-1.55m). Since the bending moments and axial forces are subjected to the effects of vibrations of the structures, the 25-pile structure and the 4-pile structure provided different timing of yielding under maximum forces with different phase shifts. The bending moments at the pile top and underground level show vibrations 180 degrees out of phase, and the axial forces show vibrations with the same phase.
Figure 23 shows horizontal distributions of the maximum bending moments and axial forces of Test-2. The bending moments and the axial forces are greater in the outside piles than in the inside piles, and take maximum values at the corner piles. This tendency is more obvious in the axial force distributions than in the bending moment distributions because the pile group effects of the outside and inside piles are different, and because three dimensional vibration of the structure (especially rocking motions in two horizontal directions) has greater effects on the outside piles than on the inside piles. Along Line-1 (a line of piles in the EW direction), the bending moments are greater in the outside piles than in the inside piles, which can be regarded as pile-group effects.
0 10 20 30 Test-4
0 10 20 30 Test-2
0 10 20 Test-1 -4
-3 -2 -1 0
0 0.2 0.4 0.6
GL
(m
)
4-pile
25-pile
Test-0
0 40 80 Test-6
0 100 200 300 Test-4
0 100 200 300 Test-2
0 100 200 Test-1 -4
-3 -2 -1 0
0 10 20
GL
(m
)
4-pile
25-pile
Test-0
0 200 400 600 Test-6
MaxBending Moment Max Axial Force
Figure 21 Vertical Distributions of Bending Moments and Axial Forces (25-Pile Structure : Pile A4, 4-Pile Structure : Pile A1 )
N
● ●
● ●
発破領域 Blast Area
N
● ●
● ●
発破領域 Blast Area
25-Pile Structure (A4)
4-Pile Structure (A1)
(kN*m) 15
-15 (kN*m) 5
-5
10.0 (sec.)
10.0
(sec.) (kN)
200
-200 (kN) 200
-200 25-Pile Structure (A4)
4-Pile Structure (A1) (s) (s)
10.0
(sec.) (kN)
200
-200 (kN) 200
-200 25-Pile Structure (A4)
4-Pile Structure (A1) (s) (s)
Bending Moment Axial Force
Figure 24 shows the vertical distributions of the maximum bending moments and axial forces of A2, A3 and A4 piles of the 25-pile structure from Test-2. The bending moments and the axial forces take maximum values at the pile top regardless of the pile locations. Although the magnitude of the bending moments varies in different locations, the shapes of the distributions are similar. However, the piles at different locations show different shapes of axial force distributions. In the outside piles, the axial forces decrease as the level goes down.
Figure 25 shows the distributions of the maximum bending moments along Line-1. The magnitude of the bending moments are in the order of Test-6, Test-2, Test-4, Test-1, Test-3 and Test-5, and correspond to the amplitudes of the acceleration responses of the test structure. The distributions show the same tendency regardless of the amplitudes of the input motions. The bending moments are greater in the corner piles than in the other piles.
KN*m
0 5 10 15
A2 Pile A3 Pile
Line-1
0 100 200 300 400
A3 Pile
A2 Pile A4 Pile KN
Line-1 A4 Pile
Bending Moment Axial Force
Figure 23 Horizontal Distribution of Maximum Bending Moment and Axial Force for Test-2
0 5 10
-4 -3 -2 -1 0
(kN*m)
GL
(m
)
0 200 400
(kN)
A4 Pile
A2 Pile
A3 Pile
0 5 10
-4 -3 -2 -1 0
0 5 10
-4 -3 -2 -1 0
(kN*m)
GL
(m
)
0 200 400
(kN*m)
GL
(m
)
0 200 400
(kN)
A4 Pile
A2 Pile
A3 Pile
0 5 10 15 20
Ben
di
ng
Mome
nt
(k
N*m)
Test-1 Test-2
Test-3 Test-6
Test-4 Test-5
B7 B9 A3 B14 B7
Bending Moment Axial Force
Figure 24 Vertical Distribution of Maximum Figure 25 Distribution of Maximum Bending Bending Moment and Axial force Moment along Line-1
-10 0 10
-300 300
0
Moment(kN*m)
Ax
ia
l F
o
rc
e(
kN
)
時 刻 秒
3.5 ●
-10 0 10
Moment(kN*m) 3.5秒
●
-10 0 10
Moment(kN*m) 3.5秒
●
3.6秒
■
3.5 Second
3.5 Second 3.5 Second
3.6 Second
(A3 Pile) (A2 Pile) (A4 Pile)
-10 0 10
-300 300
0
Moment(kN*m)
Ax
ia
l F
o
rc
e(
kN
)
時 刻 秒
3.5 ●
-10 0 10
Moment(kN*m) 3.5秒
●
-10 0 10
Moment(kN*m) 3.5秒
●
3.6秒
■
3.5 Second
3.5 Second 3.5 Second
3.6 Second
-10 0 10
-300 300
0
Moment(kN*m)
Ax
ia
l F
o
rc
e(
kN
)
時 刻 秒
3.5 ●
-10 0 10
Moment(kN*m) 3.5秒
●
-10 0 10
Moment(kN*m) 3.5秒
●
3.6秒
■
3.5 Second
3.5 Second 3.5 Second
3.6 Second
(A3 Pile) (A2 Pile) (A4 Pile)
Figure 26 Moment-Axial force Relationship at Different Locations for Test-2
Figure 26 shows the hysteresis between the bending moments and the axial forces of Piles A3, A2 and A4. The axial forces of the pile-group foundation could be greatest at the corner piles when the piles are subjected to rocking motion in the EW and NS directions at the same time. In investigating the axial forces, it is very important to incorporate rocking motions of the structure in two horizontal directions, since inertia forces from the test structure show different effects on piles at different locations.
10. CONCLUSIONS
(1) Six sets of extensive vibration tests have been conducted at Black Thunder Mine using ground motions induced by large-scale mining blasts. Acceleration responses of the soil-pile-structure interaction systems and strain data of the piles have been obtained with different levels of input motions.
(2) Compaction of sand in order to obtain uniform properties in the test pit was accomplished by controlling sand densities and water contents of each layer using radiation measurement equipment.
(3) The maximum horizontal acceleration recorded at the adjacent ground surface varied from 57 cm/s2 to 1683 cm/s2 depending on the distance from the test site to the blast areas. This was one advantage of the vibration test method employed in this project.
(4) The horizontal accelerations at the top slab varied from 136 cm/s2 to 1857 cm/s2 for the 25-pile structure, and from 52 cm/s2 to 1,396 cm/s2 for the 4-pile structure. The maximum strains were 13400 micro strains at the pile top of the 4-pile structure during Test-6, which exceeded the yield strain level.
(5) The 1st natural frequencies of the 4-pile structure were reduced from 6 Hz to 2 Hz through a series of vibration tests, since some spaces were generated between the piles and the surrounding soil of the 4-pile structure during strong ground motions. However, the 1st natural frequency of the 25-pile structure remained at 8 Hz to 6 Hz even after the series of the vibration tests, because no space was formed.
(6) The average Vs in the test pit stayed at the same level of around 250m/s during the series of vibration tests, except for Test-6.
(7) The maximum accelerations in the test pit and adjacent free field in EW direction were amplified as the ground motions propagated upward. The amplification in the test pit was smaller than in the adjacent field above GL–4.0m because of non-linearlity of the sand in the test pit.
(8) The maximum accelerations of the 25-pile structure in the EW direction were always greater than those of the 4-pile structure because of the spaces generated between the piles and the surrounding soil of the 4-pile structure. The maximum accelerations of the 25-pile structure in the vertical direction were always smaller than those of the 4-pile structure because high-frequency ground motions were filtered out by the pile-group effects of the 25-pile structure.
(9) The soil springs per a pile of the 25-pile structure, which were evaluated from the relationship between inertia force and relative displacement, were about 60 to 70% of those of the 4-pile structure because of the pile-group effect.
(10) The bending moments and the axial forces showed maximum values at the top of the piles for both the 25-pile structure and the 4-pile structure.
ACKNOWLEDGMENTS
We greatly appreciate the guidance we received from Dr. Aoyama, Professor Emeritus of the University of Tokyo, throughout this experimental research. We also acknowledge Dr. Tokimatsu, Professor of the Tokyo Institute of Technology, for his review of the experimental results.
We would also like to thank the management and staff of Arch Coal's Black Thunder Mine for their valuable assistance right through the project. Paul Lang, Steve Beil and Gordon Shinkle in particular were always generous in their support. We could not have carried out this research project without their help.
REFERENCES
Kamijo, N., Saito, H., Kusama, K., Kontani, O. and Nigbor, R., (2001) "Seismic Tests of a Pile-Supported Structure in Liquefiable Sand Using Large-Scale Blast Excitation," Proceeding of the 16th International Conference on Structural Mechanics in Reactor Technology (SMiRT-16), Washington