ISSN(Online): 2320-9801
ISSN (Print): 2320-9798
I
nternational
J
ournal of
I
nnovative
R
esearch in
C
omputer
and
C
ommunication
E
ngineering
(An ISO 3297: 2007 Certified Organization)
Vol. 3, Issue 9, September 2015
A Survey and Cost Classification of Big Data
Analytics and Decision Tools
Dr. Akazue Maureen Ifeanyi, Ajenaghughrure Ighoyota Ben
Lecturer I, Dept. of Computer Science, Delta State University, Abraka, Delta State, Nigeria1
P.G student, Dept. of Computer Science, Vels University, Chennai, Tamilnadu, India2
ABSTRACT: Big data is changing the way business decisions are made and it’s still early in the game. However, big
data demands new problem-solving approaches because it exceeds the capacity and capabilities of conventional storage, reporting and analytics systems. Hence, prompting the need for sophisticated data analytics tools for proper processing and mining to acquire adequate information from these voluminous data, which traditional data analytics tools cannot handle. Data analytics tools development effort has been high, producing tools from open source to license. This research paper surveys some top big data analytics and decision tools available, classifying them into license, open source, and versions combining both, highlighting their features briefly, to enhance end user choice of tools based on cost and capabilities, as well as developers knowledge of development efforts in various classes of tools and their capabilities. The survey covered forty-four tools and showed that twenty six were licensed, eight were open source, and ten were versioned tools having both license and open source.
KEYWORDS: Open source, licensed, Big Data, data analytics tools, capabilities of data analytics tools I. INTRODUCTION
The technological advancements enables data collection from the environmental data (sensor based systems), surveillance system (video and audio), and human physiological data (ECG, EEG). These data are voluminous, varying, valuable and generated with high velocity, leading to large complex dataset which cannot be handled by traditional data analytic tool, termed big data. According to O’Reilly [7], a data driven organization is one that ―acquires, processes and leverages data in a timely fashion to create efficiencies, iterate on and develop new products to navigate the competitive landscape.‖
II. RELATED WORK
A Big Data Insight Group survey [8] of 300 senior personnel from a broad range of industry sectors revealed that many organizations acknowledges Big Data to be an important player in their growth, as shown in the fig.1 below. Big data solutions attempt to cost-effectively solve the challenges of large and fast-growing data volumes and realize its potential analytical value [1, 9]. Thus, many organizations that are faced with data analytics challenges as indicated in fig.1 have realized it. Hence there is a need for advanced methodology for analyzing, storing and presenting these data. Specific new big data technologies and tools have being continuously developed [2]. Much of the new big data technology relies heavily on huge parallel processing databases that concurrently distribute the processing of very large sets of data across many servers [2]. For instance, specific database query tools have been developed for working with the massive amounts of unstructured data that are being generated in big data environments [2]
ISSN(Online): 2320-9801
ISSN (Print): 2320-9798
I
nternational
J
ournal of
I
nnovative
R
esearch in
C
omputer
and
C
ommunication
E
ngineering
(An ISO 3297: 2007 Certified Organization)
Vol. 3, Issue 9, September 2015
Currently it seems that users of data analytics tools are responsible for searching, provisioning and aggregating the data. Data aggregation is not a trivial task and is nearly as complex as the task of developing suitable questions by data scientists to gain new information from data.
While the market for solutions used to aggregate data from multiple sources is relatively limited, it is also characterized by a variety of very different approaches [4]. Currently, big data are dominated by analytics solutions that often assume that data to be analyzed are already available within the company's IT systems or that data streams, for instance, from social media, are entered directly into an application software through cooperation agreements with respective providers[3]. Hence the need to survey available big data tools and their feature is imminent to understand and guide properly in choosing a proper tool for big data analysis.
Fig.1:Big Data investment chart[4]
III.BIGDATASTACK
Big Data technology can be broken down into two major components [4] – the hardware component and the software component, as demonstrated in the Fig.2. The hardware component refers to the component and infrastructure layer. The software component can be further divided into data organization and management software, analytics and discovery software, and decision support and automation software [5].
Fig. 2: Bit data technology stack [4]
A. Infrastructure: This is the main component of big data, it comprises of the storage and network infrastructure, which is usually x.86 servers.
B. Data organization and management: This layer refers to the software that processes and prepares all types of structured and unstructured data for analysis [4]. This layer extracts, cleanses, normalises and integrates data. The layer is supported by two architecture, which are relational database management system (RDBMS) and NoSQL databases for optimizing, scaling, and speedy processing of large relational datasets. Also, the NoSQL is meant to compliment the drawback of standard SQL transaction queries.
C. Data Analytics and Discovery
ISSN(Online): 2320-9801
ISSN (Print): 2320-9798
I
nternational
J
ournal of
I
nnovative
R
esearch in
C
omputer
and
C
ommunication
E
ngineering
(An ISO 3297: 2007 Certified Organization)
Vol. 3, Issue 9, September 2015
automated, rule-based transactional decision making. Data analytics and discovery tools can also be categorized by the type of data being analysed (text, audio and video) and the tools levels of sophistication.
D. Decision support and automation interface
This layer handles the decision support task of data analytics task, which usually includes track, analyse, decide, and act [4]. There are two decision support and automation software categories: transactional decision management, which is embedded within applications and project-based decision management software is an independent solution.
IV.CHARACTERISTICSOFBIGDATA
Big data is characterized by four Vs (volume, velocity, variety and value) which are briefly described below;
A. Volume: Data anytime, anywhere, by anyone and anything Volume is the only distinction between big data and other data analytics domain. As it incorporate analysis of large varying datasets more effectively than traditional data mining. The size of the data is not specific but the nature of the dataset size is absolutely of concern. For example three tweets per/seconds One million HD movies download per minutes etc.
B. Velocity: Every millisecond counts The speed of decision making – the time taken from data input to decision output – is a critical factor in the big data discussion.21 Emerging technologies are capable of processing vast volumes of data in real or near real time, increasing the flexibility with which organizations can respond to changes in the market, shifting customer preferences or evidence of fraud. Big data systems also need to be capable of handling and linking data flows entering at different frequencies. Long championed by high-frequency traders in the financial services market, the race for velocity and tight feedback loops is a key part of gaining competitive advantage in a number of industries.
C. Variety: data are generated through human activities with machines and machines to machines interactions. Similarly these datasets are in different format. For example the U.S military drone will collect video data, as well as other numerical data from sensors onboard the drone to accurately identify and hit target, also industrial systems will comprise of sensors monitoring the production line triggering actions that enable the smooth operation of the production line as well as monitor the state of each production plant automation parts thereby generating numerical data. Thus the format of datasets varies from source and application to source and application. The capacity of a system to analyze a variety of source data is crucial as it can yield insights not achievable by consulting one type of data in isolation.
D. Value: Datasets were only generated and stored for archive purpose. Big data is all about extracting the meaning out of these archived data as well as the embedded benefits. For future decision. Hence there is an immediate need for a system with the necessary features to segregate, analyze, and weigh numerous datasets in order to sustain veracity.
V. SURVEYOFBIGDATAANALYTICTOOLS
In this survey, we classify big data analytics and decision tools into three major categories
License tools
Open source tool
Versioned open
A. LICENSE TOOLS: big data licensed tools are those that require end users to acquire license, before usage is allowed. examples are;
1. ERWIN
A collaborative data-monitoring environment, ERwin offers an intuitive, graphical interface with a centralized view of key definitions, enabling the leveraging of data as strategic business asset. The product is comprised of a number of editions designed for different stakeholders within an organization, providing a targeted level of information availability and display and configurations for better understanding and usability.
Key Features:
Achieve business agility through model-driven collaboration
Collaborate via web or desktop
ISSN(Online): 2320-9801
ISSN (Print): 2320-9798
I
nternational
J
ournal of
I
nnovative
R
esearch in
C
omputer
and
C
ommunication
E
ngineering
(An ISO 3297: 2007 Certified Organization)
Vol. 3, Issue 9, September 2015
Display themes, custom data types, macro language and API
Custom reporting
Metadata integration tools
Cost:
CA ERwin Data Modeler Standard Edition r9.5 – Product plus 1 Year Enterprise Maintenance – $4,794
CA ERwin Data Modeler Standard Edition r9.5 – Product plus 3 Years Enterprise Maintenance – $6,392
CA ERwin Data Modeler Workgroup Edition r9.5 – Product plus 1 Year Enterprise Maintenance – $6,708
CA ERwin Data Modeler Workgroup Edition r9.5 – Product plus 3 Years Enterprise Maintenance –
$8,944
CA ERwin r9.5 Data Modeler for Microsoft SQL Azure – Product plus 1 Year Enterprise Maintenance –
$1,679.94
CA ERwin r9.5 Data Modeler for Microsoft SQL Azure – Product plus 3 Years Enterprise Maintenance –
$2,239.92
CA ERwin r9.5 Web Portal Standard Edition 1-5 Users – Product plus 1 Year Enterprise Maintenance –
$8,399.70
CA ERwin 9.5 Web Portal Standard Edition 1-5 Users – Product plus 3 Years Enterprise Maintenance –
$11,199.60
2. PMONE’S
pmOne’s cMORE enables users to quickly build, flexibly grow and efficiently administer solutions. It leverages and extends SQL Server functionality, as well as that of Excel, SharePoint, and other components in the Microsoft BI stack.
Key Features:
Simplified standard and ad hoc reporting
Credible alternative to SAP-based data warehouse
Consistent reporting company-wide
Personalize reports; distribute books
Easy access to SAP data and other systems
Based on Microsoft BI
Cost: Contact for a quote
3. OPENDATASOFT
OpenDataSoft is a comprehensive discovery tool with maps, charts, and graphs to explore public data sets. A cloud-based platform, OpenDataSoft is designed for seamless and unlimited data publishing, sharing, and reuse.
Key Features:
Reuse data through APIs and apps models
Collect data from any source
Read and understand all formats
Make databases findable and reusable
Standard access formats
Interactive & shareable visualization
API factory
Web extensions and open source
Cost (pricing based on Euros):
FREE – Civic initiatives and academic projects
200/month – 100k records, 20K UI/API queries/day
700/month – 10M records, 100K UI/API queries/day
Contact for a quote – Unlimited records, UI/API queries/day
4. ANGOSS
A comprehensive marketing analytics solution, Angoss offers real-time Big Data insights for a variety of verticals and business sectors. From credit scoring to opportunity and lead scoring, fraud deterrence and claims management, Angoss is capable of capturing and analyzing data for a multitude of applications.
Key Features:
Automated workflows to develop scorecards
ISSN(Online): 2320-9801
ISSN (Print): 2320-9798
I
nternational
J
ournal of
I
nnovative
R
esearch in
C
omputer
and
C
ommunication
E
ngineering
(An ISO 3297: 2007 Certified Organization)
Vol. 3, Issue 9, September 2015
Advanced predictive modeling
Angoss Decision and Strategy Trees
Data preparation and profiling
Model validation and deployment
Cost: Contact for a quote
5. MU SIGMA
Mu Sigma is a powerful tool for machine learning, operational research, artificial intelligence, and more. With a set of proprietary platforms to enable rapid decision-making and comprehensive data collection and integration that eliminates information silos.
Key Features:
Hosts Mu Sigma problem DNAs
Real-time analytics and event stream processing
Load models into an enterprise ecosystem for consumption
Embedded advanced analytics engine
Influence analysis and topic modeling
Sentiment evaluation
Easily scaled on commodity hardware
Cost: Contact for a quote
6. LAVASTORM ANALYTICS
Lavastorm platform is faster, better, and cheaper analytics for achieving business goals. Lavastorm eliminates the need for a disjointed approach with visualization tools, spreadsheets, BI applications, databases and other information silos with a seamless solution delivering end-to-end analytics.
Key Features:
Reduce analytic development by 90% or more
Large volumes of data in short amounts of time
Reuse and share analytics knowledge across teams
Detect hard-to-find issues with 40% less false positives
Visibility control for management and executives
Cost: Contact for a quote
7. GRIDGAIN
GridGain reimagines in-memory computing for a competitive edge in the modern business environment for high-performance computing, first release of GridGain in 2007.
Key Features:
In-Memory Data Grid
Supports SQL, K/V, MongoDB, MPP, MapReduce
Hyper Clustering
Zero Deployment
Advanced Security
Fault Tolerance
Load Balancing
Customizable Event Workflow
Programmatic Querying
Minimal or no integration
No ETL required
Eliminate MapReduce overhead
Works with any Hadoop distribution
Cost: Contact for a quote
8. STATSMIX
This is a complete dashboard solution suitable for all business need. StatsMix dashboards are customized for each specific requirement, with the data you need from sources like Salesforce, MySQL, Google Analytics, and other tools and services.
Key Features:
ISSN(Online): 2320-9801
ISSN (Print): 2320-9798
I
nternational
J
ournal of
I
nnovative
R
esearch in
C
omputer
and
C
ommunication
E
ngineering
(An ISO 3297: 2007 Certified Organization)
Vol. 3, Issue 9, September 2015
Measure KPIs
Track any metric with API
Automatic social monitoring
Share metrics and dashboards via email, embed them, or create guest accounts
Aggregate metrics to eliminate silos
Custom dashboards
Cost:
Basic – $24/month – 100k API requests
Standard – $49/month – 300k API requests
Pro – $99/month – 1M API requests
Premium – $199/month – 3M API requests
Enterprise – $499/month – 8M API requests
9. PLATFORA
Platfora hides the complex nature of Hadoop, making it simpler for enterprises to discover and understand facts in their business across events, actions, behaviors and time.
Key Features:
Vizboards for self-service, interactive data visualization
Analytics Engine, In-Memory Accelerator, and Hadoop Processor
Entity-centric data catalog
Build interest-driven pipelines of facts
Analyze data iteratively with segmentation
Collaboration features
On-premise or cloud deployment
Cost: Contact for a quote
10. CONTINUUITY
Continuity enables developers to build Big Data applications quickly, easily, and seamlessly, deploying ins0iitantly on-premise or to the cloud. It’s all made possible through simple APIs that can be used with virtually any platforms.
Key Features:
User-implemented real-time stream processors (Flows)
Process a batch of data objects with the same transaction
More than one instance possible with each Flowlet
Programmatic control with REST interfaces
Three partitioning strategies to choose from
Datasets for higher-level abstractions
Cost: Contact for a quote
11. BITDELI
BitDeli is an analytics tool for GitHub, enabling developers to gather data on who is viewing their repositories, where and when. With a one-click install, you can easily add analytics to your repositories and start gathering valuable data, including aggregate statistics across all forks for a given repository.
Key Features:
One-click install
Automatically generated pull requests
Trending badge indicator shows repository popularity
Global rankings for comparison
Fork aggregation for a broad picture of project health
Cost: Based on GitHub Enterprise pricing
12. SKYTREE
Skytree is a comprehensive Machine Learning platform emphasizing the growing importance of Predictive Analytics in Big Data. Skytree offers the ideal platform for fully exploiting the opportunities presented by Big Data. With a multitude of industry-focused solutions as well as solutions encompassing everything from predictive analytics to algorithmic pricing,
Key Features:
ISSN(Online): 2320-9801
ISSN (Print): 2320-9798
I
nternational
J
ournal of
I
nnovative
R
esearch in
C
omputer
and
C
ommunication
E
ngineering
(An ISO 3297: 2007 Certified Organization)
Vol. 3, Issue 9, September 2015
Marketing Analytics offer solutions ranging from ad optimization to lead scoring and recommender
systems
Only general purpose scalable Machine Learning system on the market
Highest accuracy on the market; unprecedented speed and scale
Power Packs modules are plugged into the Skytree Server Foundation
Cost: Contact for a quote
13. INFOCHIMPS CLOUD
A cloud service solution for Big Data, Infochimps Cloud makes it possible to deploy Big Data applications rapidly and without the typical time commitment. For applications requiring real-time analysis, multi-source streaming data, a NoSQL database, or a Hadoop cluster, Infochimps Cloud offers a solution that facilitates rapid implementation. Real-time analytics, ad hoc analytics, and batch analytics comprise Infochimps Cloud’s three essential cloud services.
Key Features:
Integrate with any data source – CRM solutions, etc.
Log analysis
Mobile data analytics
Fraud detection and risk analysis
Ad targeting
Customer insights via social media sources, website clickstreams and more
Cost: Contact for a quote
14. PENTAHO
Pentaho brings IT and business users together by joining data integration and business analytics for integrating, visualizing, analyzing and blending Big Data in ways never before possible for better business results. Pentaho’s open, embeddable and extensible analytics platform makes it easy to visualize, explore, and predict — turning data into value.
Key Features:
High-volume data processing
Adaptive Big Data layer
Data mining and predictive analysis
Instaview – data to insights in 3 steps
Cost: Contact for a quote
15. KARMASPHERE
Karmasphere is a key solution for self-service analytics on Hadoop. Designed for teams of analysts who need to explore and analyze Big Data on Hadoop
Key Features:
Organized dashboard
SQL data explorer
250-plus pre-packaged Hadoop algorithms
SAS, SPSS and R Analytic Models
Dynamic data lenses for self-service analytics
Cost: Contact for a quote
16. PLACED
Placed facilitates data collection from offline sources, enabling enterprises to derive actionable insights through a combined analysis of both offline and online behavior and data metrics. Placed targeting and placed attribution facilitates better results from mobile advertising by mapping the relationship between people and places by capitalizing on Big Data capabilities.
Key Features:
Measure visitation trends over time
Measures 100 million locations a day, across more than 100,000 opted-in US smart phones
Inference Pipeline references a place database with nearly 300 million features for the US alone
Largest repository of offline insights into the paths and behaviors of consumers
Audience segmentation by demographics and other data points
Affinity modeling for understanding relationships between data
ISSN(Online): 2320-9801
ISSN (Print): 2320-9798
I
nternational
J
ournal of
I
nnovative
R
esearch in
C
omputer
and
C
ommunication
E
ngineering
(An ISO 3297: 2007 Certified Organization)
Vol. 3, Issue 9, September 2015
Cost: Contact for a quote
17. SAP
SAP’s HANA is a platform, compactable with Apache Hadoop, enabling the capability to integrate and analyze massive loads of data in real time. The platform makes it possible to derive actionable insights.
Key Features:
Infinite storage
Flexible data management for all types of data
Discover insights with analytics solutions
Runs processes 1,000 to 100,000 times faster in-memory
SAP IQ analytics holds the Guinness World Record for data loading
Cost: Contact for a quote
18. CAMBRIDGE SEMANTICS
Cambridde Semantics makes collecting, integrating, and analyzing Big Data an effortless task, through its Anzo Software Suite, an open platform for building Unified Information Access (UIA) solutions.
Key Features:
Combine data from a multitude of sources
Customized, interactive web dashboards for analysis
Share spreadsheets in sync automatically
Useful for CRM, billing, project management and more
Cost: Contact for a quote
19. FUSION CHARTS
Fusion Charts simplifies the development of sophisticated, cross-device compatible JavaScript charts with animation, rich interactivity, and impressive design with ease.
Key Features:
Developer resources centre
Interactive zooming and scrolling
Real-time charts and gauges
Multi-lingual charts
Visually editable charts and gauges
Linked charts and a variety of effects
Cost: Contact for a quote
20. MARKLOGIC
MarkLogic is built to support the world’s biggest data loads, bringing all types of relevant content back to users who can turn it into action. With real-time updates and alerts, connections between information make new opportunities immediately obvious. MarkLogic is ideal for enterprises that count on revenue through paid content search. With geographic data combined with content, location relevance is built in, and geographic boundaries make advanced data filtering possible.
Key Features:
Range of Big Data solutions
Speeds development
Flexible APIs
NoSQL
Real-time analysis and updates
Bring all types of content back to end users
Cost: Contact for a quote
21. SYNCSORT
Syncsort is a GUI based solution that enables developers to create solution for collecting, processing, and distributing more Data in less time. It s support multi platforms, from UNIX, to windows, and mainframe as well as popular Hadoop framework
Key Features:
Solutions for Hadoop, Mainframe, Windows, Linux, Unix
Lowers the barriers to Hadoop adoption
ISSN(Online): 2320-9801
ISSN (Print): 2320-9798
I
nternational
J
ournal of
I
nnovative
R
esearch in
C
omputer
and
C
ommunication
E
ngineering
(An ISO 3297: 2007 Certified Organization)
Vol. 3, Issue 9, September 2015
High-performance sorting
Improve efficiency
Cost: Contact for a quote
22. DATASTAX
This is a Big Data analytic tool, commonly used by Oracle, eBay, and Adobe due to its cost effectiveness, high speed processing of large datasets making the tool suitable for handling massive data loads at maximum speed for real-time analysis, DataStax comprises of a robust visual query tool for developers.
Key Features:
Visual query tool for developers
Create and run Cassandra Query Language (CQL) queries and commands
Visually navigate and interact with data clusters
Works with DataStax Community and Enterprise editions
Cost: Contact for a quote
23. GUAVUS
It is a Big data analytical system, suitable for enhancing real-time processing, analysis and decision making, with powerful analytics capabilities integrated with advanced data science.
Key Features:
Analyze-First Analytics Architecture
Analyze high-volume data streams in near real time
Handles multiple data sources with ease
Continual data analysis from moment of capture
Cost: Contact for a quote
24. SPLICEMACHINE
Splice Machine is a real-time SQL-on-Hadoop database that takes Big Data beyond analytics with the ability to derive real-time, actionable insights for rapid decision-making. Not only can Splice Machine process real-time updates, but it offers the ability to utilize standard SQL and is capable of scaling out on commodity hardware. Splice Machine compliments the scaling incapability in any case of MySQL or Oracle.
Key Features:
SQL-99 compliant, with standard ANSI SQL
Easily scales from gigabytes to petabytes using cost-effective, commodity hardware
Real-time updates with transactional integrity
Distributed computing architecture
Multiple Version Concurrency Control (MVCC)
Cost: Contact for a quote
25. PALANTIR
Palantir is a Big Data analytics tool for integrating, visualizing and analyzing information with emphasis on scalability, security, ease of use, and collaboration. Hence, making it suitable for use in intelligence, defense, financial and law enforcement applications, where they are commonly used. But it’s quickly growing in other verticals.
Key Features:
Solutions for integrating, visualizing and analyzing data
Serves a multitude of industries with custom solutions
Exploit and analyze data
Extract data from multiple sources
Privacy and data protection policies
Simplify workflows by integrating data into a single dashboard
Cost: Contact for a quote
26. ATTIVIO
ISSN(Online): 2320-9801
ISSN (Print): 2320-9798
I
nternational
J
ournal of
I
nnovative
R
esearch in
C
omputer
and
C
ommunication
E
ngineering
(An ISO 3297: 2007 Certified Organization)
Vol. 3, Issue 9, September 2015
Key Features:
Combines Big Data and Big Content
Eliminates information silos
Adds context and signals from human-generated information sources
Supports BI/data visualization tools
In-engine analytics
Cost: Contact for a quote
27. RAPIDMINER
this is a Big Data analytic tool that requires no programming knowledge of coding. it provides application wizard for all operations such as reduction, sentiment analysis, predictive maintenance and direct marketing in RapidMiner 6.0, this tool is one of the fastest advanced analytics solutions available.
Key Features:
Hundreds of methods for data integration
Runs on every major platform
No programming required
Drag-and-drop interface
Cost: Contact for a quote B. OPEN SOURCE TOOL
1. HPCC SYSTEMS
A proven and battle-tested platform for manipulating, querying, transforming, and data warehousing Big Data, HPCC Systems solves Big Data problems facing modern enterprises in any vertical.
Key Features:
Processing clusters use off-the-shelf hardware
Clusters typically homogeneous, but not required
Distributed, Thor, Roxie file systems
Linux operating system
Build multi-key, multi-field (aka compound) indexes on DFS files
Data warehouse capabilities for structured queries and data analysis applications
Supports thousands of users with sub-second response time, depending on application
Cost: FREE
2. ORANGE
Orange is an open-source data visualization and analysis tool for both novices and experts. Data mining is conducted either through visual programming or Python scripting, with components for machine learning and ad-ons for bioinformatics and text mining.
Key Features:
Remembers choices and makes suggestions
Intelligently chooses communication channels between widgets
Packed with visualization options from bar charts to dendograms
Integration and data analytics
Combine widgets to design the framework of your choice
Toolbox with more than 100 widgets
Cost: FREE
3. SPAGOWORLD
From business intelligence to middleware, SpagoWorld offers a range of solutions for enterprises, all on an open-source platform. SpagoWorld’s Big Data BI solution enables the collection of massive quantities of data, in rapid timeframes, for use across SpagoWorld’s other platforms for further analysis and business intelligence derivatives.
Key Features:
Extract data from various platforms, from database and analytics platforms to NoSQL databases or
enriched distributions
Supports real-time analysis of streaming data
Charts, reports, thematic maps, cockpits
ISSN(Online): 2320-9801
ISSN (Print): 2320-9798
I
nternational
J
ournal of
I
nnovative
R
esearch in
C
omputer
and
C
ommunication
E
ngineering
(An ISO 3297: 2007 Certified Organization)
Vol. 3, Issue 9, September 2015
Reporting, multi-dimensional analysis
Ad hoc reporting
Location intelligence
Real-time dashboards and console
Cost: FREE
4. DEEPDIVE
A new type of system to help developers analyze data on a deeper level, DeepDive is an open-source project with a simple four-step process for writing applications on the platform. With calibrated probabilities for every assertion it makes, Deep Dive is designed to navigate around the problematic nature of human error in development.
Key Features:
Handles large amounts of data from multiple sources
Write simple rules and offer feedback on prediction accuracy
―Distantly‖ learns, rather than requiring a tedious machine-learning process for training predictions
Scalable, high-performance inference and learning engine
Cost: FREE
5. INFINIDB
InfiniDB is a 100% open-source platform, enabling Big Data, power l cost.
Key Features:
Three open-source versions available
Completely MySQL-accessible
Familiar, MySQL interface for large-scale, ad hoc BI
Dimensional and predictive analytics
Integrates with the Hadoop ™ Distributed File System (HDFS)
Real-time, ad hoc analytics within an Apache Hadoop cluster
Cost: FREE
6. SPRING DATA/PIVOTAL
Spring Data also know as pivotal constitutes set of projects specially for databases, aimed at easing the use new data access technologies and provide improved support for relational database technologies.
Key Features:
Support for Hadoop, mongoDB, Data Rest and more
Also provides consulting services
Customized, all-in-one Eclipse-based distribution
Tool suites for ready-to-use solutions
Cost: FREE
7. HORTONWORKS
Hortonworks, enables processing and analysis of everything from Sentiment to Sensors with a 100% open-source, integrating enterprise-grade distribution of Hadoop for every platform.
Key Features:
Interact with all data, in multiple ways, simultaneously
Stable, tested, complete package of all services required for the platform
Integrates with other tools
HDP is built and supported by original architects, builders and operators of Hadoop
Cost: FREE
8. TALEND
Talend Open Studio is Big Data sophisticated and versatile open source products for developing, testing, deploying and administrating data management and application integration projects. It has an integrated environment for managing the whole process, across enterprise boundaries,
Key Features:
Data integration at a cluster scale
No need to write or maintain code
Works with leading Hadoop distributions
Pull source data from anywhere, including NoSQL
ISSN(Online): 2320-9801
ISSN (Print): 2320-9798
I
nternational
J
ournal of
I
nnovative
R
esearch in
C
omputer
and
C
ommunication
E
ngineering
(An ISO 3297: 2007 Certified Organization)
Vol. 3, Issue 9, September 2015
9. MONGODB
mongoDB is a saleable, flexible, and powerful solution for Big Data. It is a rich document- based query for storing files of any size in a database without stack overflow problems. MongoDB is used for precise control over final results of processing for handling Big Data, with full indexing capability, enhancing flexibility to index and scale Big data without compromising functionality
Key Features:
Open-source platform
Document-oriented storage
Flexible aggregation and data processing
Full index support
GridFS
Cost: FREE
10. GOOGLE CHARTS
Google Charts is a free tool with varying capabilities for visualizing data from a website. Offering simple to complex chart, implemented easily with JavaScript embedded on web pages
Key Features:
Charts exposed as JavaScript classes
Customize to match the look and feel of a website
Charts populated using DataTable class
Sort, modify, filter data
Populate data from a variety of sources
Cost: FREE
C. BOTH OPEN SOURCE AND LICENSE BIG DATA TOOLS
1. PERVASIVE
Pervasive Big Data analytic tool has a number of Big Data tools, including several solutions for Hadoop and a free RushLoader for Hadoop. From DataFlow Analytics to ParAccel Dataflow ETL/DQ for designing end-to-end ETL and quality data workflows, Pervasive is a Big Data power suite.
Key Features:
Partnership with Actian for powering Big Data 2.0
Predictive Analytics for Big Data
Simple interface for loading massive amounts of data at rapid speeds
Fastest data-crunching engine in the world
Cost:
RushLoader for Hadoop – FREE
ParAccel Dataflow Loader for Hadoop – FREE for 12 months
All other products – Contact for a quote
2. FLURRY
Flurry a Big Data end-to-end solution for analyzing consumer behavior, advertising to the right audience, at the right time, and discovering new ways to monetize audiences. Flurry makes use of 3.5 billion app session reports per day totaling more than 3 terabytes to provide valuable insights for app developers, such as a deep understanding of the user base, engagement benchmarks, and other key metrics.
Key Features:
Demographic estimations
App engagement benchmarks
App category and consumer interests
World’s largest app-audience data set
Reach more than 250 million customers per month
Data-powered targeting
Cost:
Flurry Analytics – FREE
ISSN(Online): 2320-9801
ISSN (Print): 2320-9798
I
nternational
J
ournal of
I
nnovative
R
esearch in
C
omputer
and
C
ommunication
E
ngineering
(An ISO 3297: 2007 Certified Organization)
Vol. 3, Issue 9, September 2015
3. SPLUNK
Splunk is a Big Data analytic tool that harnesses all the machine data created by websites, applications, servers, networks, sensors, mobile devices, and other sources to monitor actions, activities and events, analyzing those data sources to derive actionable insights. Splunk is a self-contained software package downloadable and functional on any device.
Key Features:
Derive insights from Big Data with speed and simplicity
Works on most major Hadoop distributions, including including first-generation MapReduce and YARN
Splunk Hadoop Connect enables bi-directional integration
Real-time collection, indexing, and analyzing
Cost:
Splunk Storm – FREE cloud service for developers
Splunk Enterprise – Perpetual License – Starts at $4,500 for 1 GB/day, plus annual support fees
Splunk Enterprise – Term License – Start at $1,800 per year, which include annual support fees
Hunk – One-year term license of Hunk starts at $2,500 per Hadoop TaskTracker or Compute Node with a
minimum of ten TaskTrackers or Compute Nodes
Splunk Cloud – Annual subscription pricing, data volumes of 5GB/day to 1TB/day
4. JASPERSOFT
JasperSoft is a Big Data tool that is used to connect and visualize data for Hadoop Analytics, MongoDB Analytics, Cassandra Analytics, and other platforms in one central repository. Using Jaspersoft Big Data, developers can configure reports, analytics, dashboards, and more, without having to move data to multiple databases.
Key Features:
Real-time analytics
Integrate all your data
Blend data through innovative data virtualization metadata layer or traditional data warehouse using ETL
Present integrated visualizations and dashboards within your apps
Create intuitive design tools for non-designers to create visualizations
Cost:
Free
Jaspersoft for AWS – Less than $1/hour
5. KEEN IO
Keen IO is a Big Data tool that has powerful APIs for gathering all the data you need and deriving the actionable insights needed to drive business forward, Keen IO is a powerful, flexible, and scalable solution that’s literally Big Data, easy-to-implement and at your fingertips.
Key Features:
Send as much data as you want, from any source
Set up event data on any action, such as upgrades, impressions or purchases
Arbitrary JSON format
Custom properties
Cost:
Developer – FREE – 50,000 events/month
Startup – $20/month – 100,000 events/month
Growth – $125/month – 1M events/month
Premium – $300/month – 4M events/month
Professional – $600/month – 8M events/month
Business – $1,000/month – 15M events/month
Enterprise – $2,000/month – 50M events/month
Custom – Negotiable – 50M – 100B events/month
6. TABLEAU SOFTWARE
ISSN(Online): 2320-9801
ISSN (Print): 2320-9798
I
nternational
J
ournal of
I
nnovative
R
esearch in
C
omputer
and
C
ommunication
E
ngineering
(An ISO 3297: 2007 Certified Organization)
Vol. 3, Issue 9, September 2015
Key Features:
In-memory analytics database eliminates memory silos
Leverages the complete memory hierarchy from disk to L1 cache
Tableau Public – free tool bringing data to life on the web
Touch, swipe and tab functionality for mobile
Easily layer in additional data sources
Access any data with a few clicks
Cost:
Tableau Public – FREE
Tableau Desktop, Tableau Server, and Tableau Online – Contact for a quote
7. UPSIGHT
Upsight, formerly Kontagent, provides actionable analytics for developers to understand what’s happening with your apps and derive actionable insights from data to impact acquisition, engagement, retention and revenue. The platform also enables the creation of targeted in-app and out-of-app metrics in line with KPIs.
Key Features:
Free, enterprise-grade analytics
Unlimited data storage
Data mining with Hadoop
Measure anything from social apps to games and mobile dating apps
Funnel analysis
Cohort explorer
Predictive LTV
Cost:
FREE – Analytics and unlimited data storage, 250k push
Core – $500/month – Custom Events up to 100k MAU, 500k push
Pro – $2,000/month – Custom Events up to 250K MAU, 1M push
Enterprise – Starting at $3,000/month – Unlimited Data Storage & Custom Events + Data Mine +
Predictive LTV + A/B, unlimited push
8. MORTAR
Mortar is a ―general purpose platform for high-scale data science‖ designed to help data scientists spend more time analyzing their data and deriving actionable insights, instead of dedicating valuable time to building infrastructure and re-configuring systems. With Mortar, you can build a custom-built recommendation engine in days, not months.
Key Features:
Open-source tools for building a recommendation engine
Built on Hadoop and Apache Pig
Create, test and run jobs from in-browser IDE
Snapshots monitor changes and progress
Instant feedback on code for fewer bugs
Cost:
Public – FREE
Solo – $99/month
Team – $499/month
VI. SUMMARYOFBIGDATATOOLS
ISSN(Online): 2320-9801
ISSN (Print): 2320-9798
I
nternational
J
ournal of
I
nnovative
R
esearch in
C
omputer
and
C
ommunication
E
ngineering
(An ISO 3297: 2007 Certified Organization)
Vol. 3, Issue 9, September 2015
Open source
License Both open source
and license
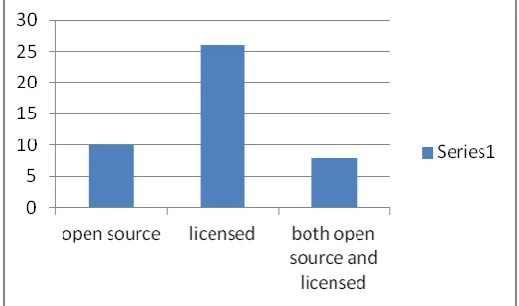
1 10 26 8
Table1: aggregated summary of surveyed big data analytics and decision tools
A graphical representation of the aggregated surveyed Big Data analytic and decision tolls are presented in fig3. There are 10 open source tools, and 8 others with both licensed version and open source version. While the others (26) are fully licensed tools, that require a license before users can gain access and make use of it.
Fig.3: Graphical representation of the surveyed Big data analytics and decision tools
VII. CONCLUSION AND FUTURE WORK
This research paper surveyed top big data analytic tools, although not the whole list of existing tools that cannot be exhaustive. Some top available tools in licensed, open source, and versioned having both source was surveyed. A total of forty-four (44) tools were surveyed, out of which eight were versioned having both licensed and open source, which ten(10) where completely open source big data analytics tool, the remaining twenty-six(26) are licensed commercial big data analytics tool. Also, a brief summary of the (44 big data tools), the features and license status were outlined. A table summarizing the various tools surveyed and their end user license status was done, with 1 representing yes and blank representing none. The various Big data analytics and decision tool available, from end user and developers perspective was surveyed, this research revealed the tool development effort and capabilities from end users point on licensed, open source, and both. Enhancing users choice of tool from vast number of available tools, based on cost, and capability. Also, highlighting, the Big Data analytics and decisions tool development effort on prospective tool developers perspective, on what range of tools and their capabilities has been developed. Classification is based on open source, licensed and versions having both, as well as their capabilities.
Although there are more sophisticated licensed tools and versions having both licensed and open source, than open source tools, looking at the features of the surveyed tools, there are relentless effort, toward ensuring the balance.
REFERENCES 1. Cognizant 20-20 insight white paper on big data is the future for healthcare
2. Why is big data important? a navint partners white paper may 2012, www.navint.com
3. Holm L., Oliver S., and Andreas G., “An Analysis by Experton Group AG: A Comparison of Big Data Solution Providers Munich, Germany” Big Data Vendor Benchmark 2015 :
4. Big Data - Infocomm Development Authority of Singapore
https://www.ida.gov.sg/~/media/Files/Infocomm%20Landscape/Technology/TechnologyRoadmap/BigData.pdf 5. IDC’s Worldwide Big Data Taxonomy, 2011. http://www.idc.com/getdoc.jsp?containerId=231099
6. James Manyika, et al,. ―Big data: The next frontier for innovation, competition, and productivity‖:
ISSN(Online): 2320-9801
ISSN (Print): 2320-9798
I
nternational
J
ournal of
I
nnovative
R
esearch in
C
omputer
and
C
ommunication
E
ngineering
(An ISO 3297: 2007 Certified Organization)
Vol. 3, Issue 9, September 2015
8. The survey, conducted in February and March 2012, was completed by 300 senior business, finance and IT personnel from a broad range of industry sector including financial, retail, telecommunications and the public sector. They represented companies of all sizes from SMEs to blue chip organisations
9. 9 Big Data Insight Group. ―The 1st Big Data Insight Group Industry Trends Report‖ http://www.thebigdatainsightgroup.com/site/article/1st-big-data-insight-group-industry-trends-report.
10. Gali H., and Henk M., ―The Evolution of Big Data as a Research and Scientific Topic‖ Elserver research trends journal, 2012 11. William T. ―top 45 big data tools‖, https://blog.profitbricks.com/top-45-big-data-tools-for-developers/
BIOGRAPHY
Dr. Akazue Maureen Ifeanyi is a Lecturer in the Department of Mathematics & Computer Science, Delta State University, Abraka, Delta State, Nigeria. She received Master of Information Science degree in 2001 from University of Ibadan, Oyo State, Nigeria, M.Sc. Computer Science in 2008 and PhD Computer Science in 2014, both from University of Benin, Edo State, Nigeria. Her research interests are HCI, Customer’s satisfaction, Online fraud prevention, Security challenges, etc
![Fig. 2: Bit data technology stack [4]](https://thumb-us.123doks.com/thumbv2/123dok_us/1476960.1180821/2.595.195.418.309.447/fig-bit-data-technology-stack.webp)