Journal of Pain Research
Dove
press
O R i g i n a l R e s e a R c h
open access to scientific and medical research
Open Access Full Text Article
impact of a multidisciplinary pain management
program on patient care utilization and cost of
care
Daniel D Maeng Kelly Baylor John B Bulger John J han
Department of epidemiology and health services Research, geisinger, Danville, Pa, Usa
Objective: Chronic pain is a highly prevalent and costly condition with few proven treatment options. Since 2014, Geisinger’s Department of Pain Medicine has implemented the Multidis-ciplinary Pain Program (MPP), which consists of a 3-day educational seminar followed by 12 months of comprehensive care. This study examines the impact of MPP on care utilization and cost between 2014 and 2016.
Methods: A retrospective health insurance claims data analysis covering a 3-year period between January 2013 and December 2016. Among all patients referred to MPP during the period, a subset of those who were Geisinger Health Plan (GHP) members was identified (113 patients). Those who were GHP members and were referred to MPP after December 2016 served as the contemporaneous comparison group (69 patients). GHP’s claims data for the corresponding period were analyzed on a per-member-per-month (PMPM) basis.
Results: MPP was associated with US$754 PMPM reduction in total cost of care including prescription drug costs (P=0.014) and US$846 reduction in total medical cost excluding pre-scription drugs (P=0.006). These cost savings were attributable to reductions in utilization of high-end diagnostic imaging (52 per-1,000 members-per month; P=0.015) and acute inpatient admissions (20 per-1,000 members-per month; P=0.086).
Conclusion: Patients enrolled in MPP were less likely to use expensive diagnostic imaging and experienced fewer hospitalizations, resulting in total cost of care savings. These findings are consistent with the expectation that MPP improves health outcomes among patients suffer-ing from chronic pain.
Keywords: chronic pain, persistent pain, multidisciplinary, utilization, cost of care, claims data
Introduction
Chronic or persistent pain is a highly prevalent condition affecting all segments of the adult population, often requiring costly care that does not effectively improve patient outcome.1 A recent report has indicated there are over 100 million people who
suf-fer from chronic pain in the US.2 More specifically, analysis from the 2012 National
Health Interview Survey estimated that over 25 million (11.2%) adults suffer from daily pain, with 14.4 million (6.4%) reporting “a lot of pain” daily.3 The accumulated
cost of care for chronic pain care ranges from US$560 to $635 billion annually, which is greater than the annual cost of care for diabetes, coronary artery disease, stroke, and cancer combined.1
Care for chronic pain patients can be problematic, often characterized by miscom-munication and misunderstandings due to a lack of common terms and definitions, and realistic expectations. Moreover, pain is a subjective experience, requiring patient’s
self-correspondence: Daniel D Maeng Department of epidemiology and health services Research, geisinger, 100n academy ave M.c. 44-00, Danville, Pa 17822, Usa
Tel +1 570 214 1688 email [email protected]
Journal name: Journal of Pain Research Article Designation: Original Research Year: 2018
Volume: 11
Running head verso: Maeng et al
Running head recto: Impact of MPP on patient care utilization and cost of care DOI: http://dx.doi.org/10.2147/JPR.S177231
Journal of Pain Research downloaded from https://www.dovepress.com/ by 118.70.13.36 on 24-Aug-2020
For personal use only.
Dovepress
Maeng et al
report.4 Providers are often dependent on patient’s imprecise
recall and biased perception between visits to gauge disease severity and treatment progress, which may produce a vague and distorted picture from which to develop a treatment plan.5
Furthermore, lack of timely access to symptom severity data limits clinicians’ ability to effectively manage patients and optimize long-term treatment regimens.
To meet this challenge, a new model of care management that addresses the root cause of chronic pain is needed. Geis-inger has developed and implemented the Multidisciplinary Pain Program (MPP) to meet this challenge in 2014. MPP is an outpatient program developed by Geisinger’s Department of Pain Medicine and has been implemented in Geisinger’s main outpatient comprehensive pain center located in Dan-ville, Pennsylvania, USA. This study seeks to examine the impact of the MPP program on total cost of care, health care utilization, and prescription opioid use during the 12-month period following the MPP enrollment and beyond.
Background
Geisinger is a large integrated health care delivery system currently serving more than three million residents through-out 45 counties in central, sthrough-outh-central, and northeast Penn-sylvania. Geisinger consists of ~1,600 employed physicians and 13 hospital campuses, as well as a 583,000-member health plan referred to as Geisinger Health Plan (GHP). Approximately, 40% of Geisinger patients have health insur-ance coverage through GHP, which is a full-service regional health plan offering commercial, Medicare Advantage, and Medicaid plans.
Geisinger’s MPP is an embodiment of the core principles, concepts, and competencies that have been articulated previ-ously6–9 and implemented elsewhere in different contexts in
limited scope throughout US and beyond in treating patients with various forms of chronic pain.10–13 Specifically, MPP is
designed around a whole-person model and utilizes a biopsy-chosocial–spiritual approach to improve function and quality of life for individuals living with chronic pain, thereby lead-ing to lastlead-ing, long-term changes in the individuals’ physical function as well as in care-seeking behaviors. The overarching goal is to empower patients to take responsibility for their self-care in pain, and to set and monitor improvement goals. MPP includes a team of health care providers and experts comprised of the following: medical pain providers, phar-macists, psychologists, physical therapists, dieticians, pain coaches, and addiction-trained social workers. This team of providers assesses a patient’s readiness for change and aids in problem solving to help patients meet their predefined
goals and explore options for pain management. Working in collaboration with primary care providers to assure continuity of care, MPP converts the patient’s goals into a personalized care plan. During this program, participants are taught how to develop measurable goals and are given the information and skills needed to achieve their desired outcomes.
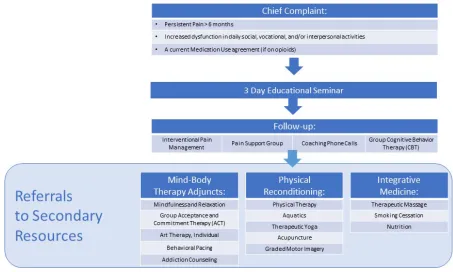
Patients can be referred to MPP by any health care provider who has access to Geisinger’s electronic health records system (Figure 1). While there are no explicit pro-gram enrollment criteria, patients with a chief complaint of persistent pain for 6 months or longer; deemed to have increased dysfunction in daily social, vocational, or inter-personal activities; showed no evidence of suicidal ideation or addictive tendencies; and motivated to proceed with a rehabilitation approach for pain management are eligible to enroll in the MPP program. The referred patients then participate in a 3-day multidisciplinary educational class that teaches them self-management skills and enhances patient engagement (Table 1). Upon completion of the class, the patients then receive 12 months of follow-up care through scheduled appointments and phone calls with the MPP team of providers.
Data
This study was conducted as Geisinger’s quality improve-ment project and therefore was not subject to Geisinger’s Institutional Review Board’s approval. To ensure patient con-fidentiality, identifying patient information, such as patient name, address, and contact information, was removed from the final data sets. From Geisinger’s electronic health records, 303 patients who were enrolled in MPP between May 2014 and October 2017 (using the first MPP appointment date as the enrollment date) were identified. Among these patients, a subset of patients who were also members of GHP at any point between January 2013 and December 2016 was identified. This date range, applied to the GHP claims data, was chosen to capture as many as 15 months of pre-MPP enrollment claims experiences of the earliest MPP enrollees. This was done to ensure that any pre-intervention trends and baseline patient heterogeneity are adequately accounted and controlled for in the subsequent analyses. This subset of MPP enrollees who were also GHP members (182 patients) thus comprised the final analytic sample.
Among the 182 patients included in the final analytic sample, there were 113 patients who had enrolled in MPP prior to December 2016 (date of the most recent GHP claims data available). This implied that there were 69 patients who had not yet enrolled in MPP as of December 2016 (but
even-Journal of Pain Research downloaded from https://www.dovepress.com/ by 118.70.13.36 on 24-Aug-2020
Dovepress impact of MPP on patient care utilization and cost of care
tually enrolled at some point between January and October 2017). This latter group of 69 patients thus formed a natural contemporaneous comparison group against which the 113 patients who had enrolled in MPP prior to December 2016 (ie, the intervention group) could be compared.
In addition, because the patients had enrolled in MPP at different points in time, there was variation in how long a patient had been exposed to MPP at any given month dur-ing the study period. This implied that a given patient may have zero month of MPP exposure at a given month in the data either because he or she had not yet enrolled in MPP as of that month or because he or she was one of the natural contemporaneous group of 69 that had enrolled in MPP after
December 2016. This study exploited this variation in the length of MPP exposure to estimate the MPP impact on the dependent variables of interest.
From the GHP claims data, each patient’s data on total cost of care and acute care utilization were obtained. Total cost of care was defined as total “allowed” amounts – ie, GHP’s reimbursement to the provider plus patients’ out-of-pocket costs via co-pays, deductibles, and co-insurance, measured on a per-member-per-month (PMPM) basis. Because not all patients had prescription drug coverage through GHP, two separate costs were considered for the analysis: medical cost only (ie, allowed amounts for care and services covered under GHP’s medical benefits only) and total cost (ie, medical cost
Table 1 Multidisciplinary Pain Program curriculum
Persistent pain education Physical reconditioning Life skills Behavioral
medicine
The biopsychosocial model of care Yoga-based relaxation and movement
Financial and medical support
Progressive muscle relaxation introduction to acute and chronic pain graded motor imagery spirituality and pain Mindfulness Preventing abuse/misuse of
Prescription pain medication
Physical therapy education nutrition Persistent pain and intimacy
Medication therapy disease Management
interventional therapy education
sleep hygiene art therapy
goal setting and review Behavioral pacing horticulture therapy Recreational therapy
Figure 1 Multidisciplinary Pain Program workflow overview.
Journal of Pain Research downloaded from https://www.dovepress.com/ by 118.70.13.36 on 24-Aug-2020
Dovepress
Maeng et al
plus prescription drug cost for those who had prescription drug coverage through GHP). For acute care utilization, rates of all-cause inpatient admissions and all-cause emergency department (ED) visits were calculated, measured on a per-1,000 members-per-month basis.
In addition, rates of high-end diagnostic imaging (defined as CT scans, MRI scans, or positron-emission tomography scans) and frequency of prescription opioid medications were also considered. As mentioned earlier, because not all GHP members had prescription drug coverage through GHP, only those who had prescription drug coverage through GHP (149 out of 182 patients) were considered for the analysis that examined the prescription opioid medication rates. The prescription opioid medication rate was calculated as average frequency of opioid prescription fills per member per month. This rate therefore did not account for morphine equivalence or days supply.
Methods
The effects of the MPP enrollment on the dependent variables (ie, total cost of care, utilization of acute care and high-end diagnostic imaging, and prescription opioid use) were esti-mated via a set of multivariate regression models with patient fixed effects to account for unobserved patient heterogeneity (Tables S1, S2, S3). The key explanatory variable was a set of indicators that identified the follow-up period since the initial MPP enrollment (ie, length of the patient’s exposure to MPP) in following intervals: 1–6 months, 7–12 months, and 12+ months. In addition, a 0–1 binary indicator that identified all follow-up periods regardless of the length of follow-up was also considered to estimate the overall average effect of MPP during the study period.
Other covariates in the regression models were patient age (in intervals of <40, 40–54, 55–69, 70+ years), count of comorbid conditions (up to nine: chronic kidney disease, diabetes, asthma, congestive heart failure, COPD, coronary artery disease, hypertension, cancer, and depression), primary payer type (Medicaid, Medicare, or commercial), calendar year (to account for yearly inflation in health care prices), as well as an indicator variable for whether the patient’s primary care provider site was designated as a patient-centered medi-cal home. Time-invariant patient attributes, such as patient gender, were not included as covariates because they would be perfectly collinear with the patient fixed effects, which account for any time-invariant patient characteristics over time. A detailed description of the regression model specifi-cation is provided in Supplementary material.
The MPP effects were then represented as the difference between the corresponding “observed” and “expected” values
obtained from the regression models. “Observed” values for the dependent variables were obtained by calculating the regression-adjusted values for the sample. Then, “expected” values were obtained by setting the key explanatory variables (ie, the MPP enrollment indicator variables) to zero and re-calculating the regression-adjusted values based on the estimated regression model parameters, holding all other parameters constant. The differences between the “observed” and “expected” values therefore represented the MPP effects on the corresponding dependent variables. The standard errors around the estimates were adjusted to account for the repeated observations for the same patient over time.
Results
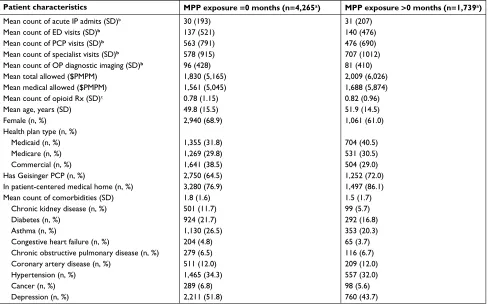
The 113 patients who were included in the MPP intervention group for the purposes of this analysis had a mean post-intervention follow-up observation of ~10 months (SD =11 months). Moreover, 73 out of the 113 patients had at least 12 months of post-MPP follow-up data. Comparing pre-MPP enrollment observations against the post-MPP observations on an unadjusted basis (Table 2), prevalence of certain chronic conditions, particularly chronic kidney disease (11.7% vs 5.7%) and diabetes (21.7% vs 16.8%), was apparently lower among the post-MPP observations. This implied that using regression-adjusted estimates is justified, as there appears to be potential confounders in the data.
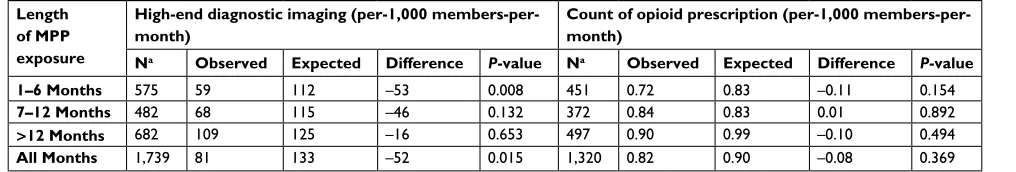
MPP enrollment was associated with a significant total cost of care saving of ~US$827 PMPM (P=0.003) and medical cost saving of US$870 (P=0.002) during the first 6 months following the initial enrollment (Table 3). These initial savings, however, disappeared in subsequent periods, as the estimated cost savings beyond the first 6 months of MPP exposure are not statistically significant (P>0.1). Yet, there was an overall average total cost saving of US$754 (P=0.014) as well as an overall average medical cost saving of US$846 PMPM (P=0.006) associated with MPP enroll-ment. These cost savings appeared to be driven by reductions in acute inpatient admission rates (20 admits per-1,000 members-per-month; P<0.1; Table 4) as well as reductions in high-end diagnostic imaging (52 imaging services per-1,000 members-per month; P<0.05; Table 5). Consistent with the pattern observed in the total cost of care, there appeared to be significant and immediate reductions in the inpatient admission and high-end imaging rates during the first 6 months after the MPP enrollment; the magnitudes of these reductions, however, became smaller in subsequent periods. Furthermore, although there was no statistically significant association between MPP enrollment and frequency of
Journal of Pain Research downloaded from https://www.dovepress.com/ by 118.70.13.36 on 24-Aug-2020
Dovepress impact of MPP on patient care utilization and cost of care
Table 2 Descriptive statistics
Patient characteristics MPP exposure =0 months (n=4,265a) MPP exposure >0 months (n=1,739a)
Mean count of acute iP admits (sD)b 30 (193) 31 (207)
Mean count of eD visits (sD)b 137 (521) 140 (476)
Mean count of PcP visits (sD)b 563 (791) 476 (690)
Mean count of specialist visits (sD)b 578 (915) 707 (1012)
Mean count of OP diagnostic imaging (sD)b 96 (428) 81 (410)
Mean total allowed ($PMPM) 1,830 (5,165) 2,009 (6,026)
Mean medical allowed ($PMPM) 1,561 (5,045) 1,688 (5,874)
Mean count of opioid Rx (sD)c 0.78 (1.15) 0.82 (0.96)
Mean age, years (sD) 49.8 (15.5) 51.9 (14.5)
Female (n, %) 2,940 (68.9) 1,061 (61.0)
health plan type (n, %)
Medicaid (n, %) 1,355 (31.8) 704 (40.5)
Medicare (n, %) 1,269 (29.8) 531 (30.5)
commercial (n, %) 1,641 (38.5) 504 (29.0)
has geisinger PcP (n, %) 2,750 (64.5) 1,252 (72.0)
in patient-centered medical home (n, %) 3,280 (76.9) 1,497 (86.1)
Mean count of comorbidities (sD) 1.8 (1.6) 1.5 (1.7)
chronic kidney disease (n, %) 501 (11.7) 99 (5.7)
Diabetes (n, %) 924 (21.7) 292 (16.8)
asthma (n, %) 1,130 (26.5) 353 (20.3)
congestive heart failure (n, %) 204 (4.8) 65 (3.7)
chronic obstructive pulmonary disease (n, %) 279 (6.5) 116 (6.7)
coronary artery disease (n, %) 511 (12.0) 209 (12.0)
hypertension (n, %) 1,465 (34.3) 557 (32.0)
cancer (n, %) 289 (6.8) 98 (5.6)
Depression (n, %) 2,211 (51.8) 760 (43.7)
Notes: asample size represents the number of member-month observations rather than the number of unique members; bmeasured on a per-1,000 members-per-month
basis; csample restricted to member-months for which patients had geisinger health Plan prescription drug coverage (pre-MPP, n=2,984; post-MPP, n=1,320).
Abbreviations: MPP, Multispecialty Pain Program; iP, inpatient; eD, emergency department; PcP, primary care provider; OP, outpatient; PMPM, per-member-per-month; Rx, prescription.
Table 3 MPP impact on total cost of care
Length of MPP exposure
$ Total allowed (medical + Rx
per-member-per-month)
$ Medical allowed (per-member-per-month)
Na Observed Expected Difference P-value Na Observed Expected Difference P-value
1–6 Months 575 1,678 2,505 –827 0.003 575 1,352 2,223 –870 0.002
7–12 Months 482 2,104 2,580 –475 0.213 482 1,740 2,334 –594 0.113
>12 Months 682 2,248 2,815 –567 0.306 682 1,854 2,575 –721 0.181
All Months 1,739 2,021 2,775 –754 0.014 1,739 1,659 2,505 –846 0.006
Note: asample size represents the number of member-month observations rather than the number of unique members. Abbreviation: MPP, Multispecialty Pain Program; Rx, prescription.
filled opioid prescriptions (Table 5), a similar trend of initial reduction and overall reduction in the opioid prescription fill frequency was also observed.
Discussion
To our knowledge, this is the first study that examined the long-term (12+ months of follow-up) impact of a comprehensive outpatient multidisciplinary program designed to treat chronic pain using actual health insurance claims data of the treated patients. The results suggest that, while the initial impact of the
program during the first 6-month period following the MPP enrollment was consistent with the expectation that MPP has led to reductions in care utilization and total cost of care, a more in-depth analysis of the data is necessary to understand the post-intervention dynamics of the program impact over time. The statistically significant reductions in the use of high-end diagnostic imaging and the corresponding reductions in total medical cost of care provide empirical evidence supporting the notion that MPP has had the desired effect of altering patients’ care-seeking behaviors in positive ways, as MPP
Journal of Pain Research downloaded from https://www.dovepress.com/ by 118.70.13.36 on 24-Aug-2020
Dovepress
Maeng et al
patients appear to have used less of discretionary care such as high-end imaging. To lesser extents, this is further supported by the non-statistically significant reductions in ED visits, opioid prescription fill frequencies, and acute inpatient admission rates. However, the question of why this initial impact did not sustain in later follow-up periods remains unanswered in this study and is a topic of future research.
The most significant limitation of this study is the lack of direct measure of pain-related patient health outcomes that may be impacted by MPP (eg, pain severity). This study has considered only the outcomes that are economic and quan-titative in nature and has ignored any clinical and qualitative outcomes. Unfortunately, the current literature provides little guidance on how to objectively and reliably capture the latter category of outcome measures across such a heterogeneous population of chronic pain patients as the one treated by MPP.4,14 Consequently, a true cost-effectiveness study of the
MPP is not feasible with the available data. However, the results reported in this study are at least consistent with the expectation that MPP is likely to have improved the patient health outcomes at least in the short term.
This study is further subject to additional limitations. First, this study has relied on observational data collected from administrative data sources, rather than data collected via a randomized control trial; as such, causality cannot be established. As shown in Table 2, there appears to be some
important underlying differences that may confound the asso-ciation between MPP enrollment and the dependent variables of interest. This study has attempted to reduce any unobserved bias using an advance statistical adjustment technique, but ultimately it is not possible to determine the magnitude of this potential bias in the estimates using the available data. For instance, due to natural disease progression, which is unobserved in the data, the estimated MPP impact may be biased. If such were the case, however, our estimates are likely to be biased toward zero – ie, the estimated impact in this study would underestimate the true impact because natural disease progression implies worsening health conditions and therefore higher care utilization and cost.
Second, the sample size is limited, especially in the com-parison group. A new study based on a larger sample size with longer follow-up may yield more precise and consistent esti-mates of the impact. The small sample size also implies that the representativeness and generalizability of the results are unclear. For instance, there may be market and patient char-acteristics unique to Geisinger and its patient population that may limit the generalizability of the findings in other settings.
Conclusion
Patients enrolled in MPP were less likely to use expensive diagnostic imaging and experienced fewer hospitalizations, resulting in total cost of care savings. These findings are
Table 4 MPP impact on acute care utilization
Length of MPP exposure
Acute inpatient admits (per-1,000 members-per month)
Emergency department visits (per-1,000 members-per-month)
Na Observed Expected Difference P-value Na Observed Expected Difference P-value
1–6 Months 575 23 44 –21 0.094 575 144 178 –34 0.176
7–12 Months 482 27 46 –19 0.219 482 118 152 –34 0.264
>12 Months 682 41 45 -4 0.846 682 152 171 –19 0.663
All Months 1,739 31 51 –20 0.086 1,739 140 173 –33 0.173
Note: asample size represents the number of member-month observations rather than the number of unique members.
Abbreviation: MPP, Multispecialty Pain Program.
Table 5 MPP impact on high-end diagnostic imaging and opioid prescription use
Length of MPP exposure
High-end diagnostic imaging (per-1,000 members-per-month)
Count of opioid prescription (per-1,000 members-per-month)
Na Observed Expected Difference P-value Na Observed Expected Difference P-value
1–6 Months 575 59 112 –53 0.008 451 0.72 0.83 –0.11 0.154
7–12 Months 482 68 115 –46 0.132 372 0.84 0.83 0.01 0.892
>12 Months 682 109 125 –16 0.653 497 0.90 0.99 –0.10 0.494
All Months 1,739 81 133 –52 0.015 1,320 0.82 0.90 –0.08 0.369
Note: asample size represents the number of member-month observations rather than the number of unique members. Abbreviation: MPP, Multispecialty Pain Program.
Journal of Pain Research downloaded from https://www.dovepress.com/ by 118.70.13.36 on 24-Aug-2020
Dovepress impact of MPP on patient care utilization and cost of care
consistent with the expectation that MPP improves health outcomes among patients suffering from chronic pain.
Acknowledgments
The abstract of this paper was presented at the 24th Annual Health Care Systems Research Network Conference, April 11–13, 2018, Minneapolis, Minnesota, USA, as an oral presentation with interim findings. The abstract has been published online, doi: 10.17294/2330-0698.1630.
Disclosure
The authors report no conflicts of interest in this work.
References
1. Gaskin DJ, Richard P. The economic costs of pain in the United States. J Pain. 2012;13(8):715–724.
2. Institute of Medicine. Relieving Pain in America: A Blueprint for Trans-forming Prevention, Care, Education, and Research. Washington, DC: The National Academies Press; 2011.
3. Nahin RL. Estimates of pain prevalence and severity in adults: United States, 2012. J Pain. 2015;16(8):769–780.
4. Malhotra A, Mackey S. Outcomes in pain medicine: a brief review. Pain Ther. 2012;1(1):5.
5. Dansie EJ, Turk DC. Assessment of patients with chronic pain. Br J Anaesth. 2013;111(1):19–25.
6. Steglitz J, Buscemi J, Ferguson MJ. The future of pain research, educa-tion, and treatment: a summary of the IOM report “Relieving pain in America: a blueprint for transforming prevention, care, education, and research”. Transl Behav Med. 2012;2(1):6–8.
7. Dorflinger L, Kerns RD, Auerbach SM. Providers’ roles in enhanc-ing patients’ adherence to pain self management. Transl Behav Med. 2013;3(1):39–46.
8. Fishman SM, Young HM, Lucas Arwood E, et al. Core competencies for pain management: results of an interprofessional consensus summit. Pain Med. 2013;14(7):971–981.
9. Doleys DM. Chronic Pain as a Hypothetical Construct: A Practical and Philosophical Consideration. Front Psychol. 2017;8:664.
10. Darnall BD, Sturgeon JA, Kao MC, Hah JM, Mackey SC. From Cata-strophizing to Recovery: a pilot study of a single-session treatment for pain catastrophizing. J Pain Res. 2014;7:219–226.
11. Moore SK, Guarino H, Acosta MC, et al. Patients as collaborators: using focus groups and feedback sessions to develop an interactive, web-based self-management intervention for chronic pain. Pain Med. 2013;14(11):1730–1740.
12. Reid MC, Eccleston C, Pillemer K. Management of chronic pain in older adults. BMJ. 2015;350:h532.
13. Clark T, Wakim JC, Noe C. Getting “Unstuck”: A Multi-Site Evaluation of the Efficacy of an Interdisciplinary Pain Intervention Program for Chronic Low Back Pain. Healthcare. 2016;4(2):33.
14. Younger J, Mccue R, Mackey S. Pain outcomes: a brief review of instru-ments and techniques. Curr Pain Headache Rep. 2009;13(1):39–43.
Journal of Pain Research downloaded from https://www.dovepress.com/ by 118.70.13.36 on 24-Aug-2020
Dovepress
Maeng et al
Supplementary materials
Regression model specification
Yit=α0+α1MPP_Expit+α2Xit+ vi+εit
Yit= dependent variable (cost of care or utilization) for member i at time t
MPP_Expit= a set of indicator variables denoting the time
t in intervals since member i’s MPP enrollment
Xit= a vector of time-varying characteristics for member
i at time t (ie, health plan type, age, calendar year, number
of comorbid conditions, etc)
vi= fixed effect for member i (a set of indicator variables corresponding to each member i in the sample)
εit= error term for member i at time t
The coefficients of interest are denoted by α1 for all the dependent variables. The above-mentioned equation is esti-mated via generalized linear models with log link and gamma distribution if cost of care was the dependent variable; for all other dependent variables that are count data (ie, inpatient admission, emergency department visits, etc), the equation was estimated via Poisson model. In all cases, clustered standard errors were reported, because there were repeated observations of the same patients in the data over time, and therefore the error term εit is likely to be correlated within
the same patient.
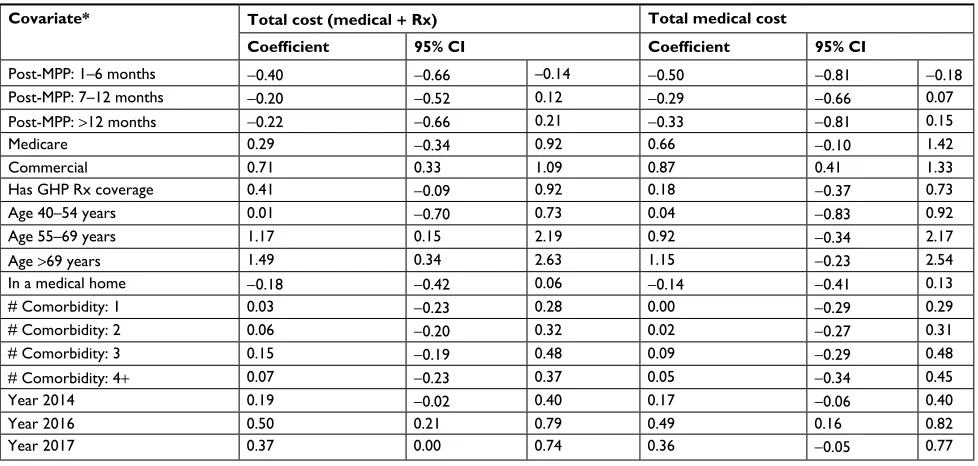
Full regression outputs
Table S1 Full regression outputs for cost of care variables (generalized linear model with log link and gamma distribution)
Covariate* Total cost (medical + Rx) Total medical cost
Coefficient 95% CI Coefficient 95% CI
Post-MPP: 1–6 months -0.40 -0.66 –0.14 -0.50 -0.81 -0.18
Post-MPP: 7–12 months -0.20 -0.52 0.12 -0.29 -0.66 0.07
Post-MPP: >12 months -0.22 -0.66 0.21 -0.33 -0.81 0.15
Medicare 0.29 -0.34 0.92 0.66 -0.10 1.42
commercial 0.71 0.33 1.09 0.87 0.41 1.33
has ghP Rx coverage 0.41 -0.09 0.92 0.18 -0.37 0.73
age 40–54 years 0.01 -0.70 0.73 0.04 -0.83 0.92
age 55–69 years 1.17 0.15 2.19 0.92 -0.34 2.17
age >69 years 1.49 0.34 2.63 1.15 -0.23 2.54
in a medical home -0.18 -0.42 0.06 -0.14 -0.41 0.13
# comorbidity: 1 0.03 -0.23 0.28 0.00 -0.29 0.29
# comorbidity: 2 0.06 -0.20 0.32 0.02 -0.27 0.31
# comorbidity: 3 0.15 -0.19 0.48 0.09 -0.29 0.48
# comorbidity: 4+ 0.07 -0.23 0.37 0.05 -0.34 0.45
Year 2014 0.19 -0.02 0.40 0.17 -0.06 0.40
Year 2016 0.50 0.21 0.79 0.49 0.16 0.82
Year 2017 0.37 0.00 0.74 0.36 -0.05 0.77
Note: *Patient fixed effects omitted for brevity.
Abbreviations: MPP, Multidisciplinary Pain Program; Rx, prescription; ghP, geisinger health Plan.
Journal of Pain Research downloaded from https://www.dovepress.com/ by 118.70.13.36 on 24-Aug-2020
Dovepress
Journal of Pain Research
Publish your work in this journal
Submit your manuscript here: https://www.dovepress.com/journal-of-pain-research-journal
The Journal of Pain Research is an international, peer reviewed, open access, online journal that welcomes laboratory and clinical findings in the fields of pain research and the prevention and management of pain. Original research, reviews, symposium reports, hypoth-esis formation and commentaries are all considered for publication.
The manuscript management system is completely online and includes a very quick and fair peer-review system, which is all easy to use. Visit http://www.dovepress.com/testimonials.php to read real quotes from published authors.
Dove
press
impact of MPP on patient care utilization and cost of care
Table S2 Full regression outputs for acute care utilization variables (Poisson model)
Covariate* Acute inpatient admits Emergency department visit
Coefficient 95% CI Coefficient 95% CI
Post-MPP: 1–6 months -0.66 -1.43 0.11 -0.21 -0.52 0.10
Post-MPP: 7–12 months -0.52 -1.36 0.31 -0.25 -0.69 0.19
Post-MPP: >12 months -0.09 -0.96 0.79 -0.12 -0.64 0.41
Medicare 2d0.31 18.83 21.79 -0.70 -1.94 0.54
commercial 0.00 -0.99 0.99 0.02 -0.59 0.64
has ghP Rx coverage -0.23 -1.54 1.09 -0.49 -1.16 0.17
age 40–54 years 0.76 -1.31 2.83 0.25 -0.63 1.13
age 55–69 years 0.92 -1.55 3.39 0.32 -0.74 1.38
age >69 years 0.76 -2.17 3.69 2.09 -0.05 4.24
in a medical home -0.03 -0.79 0.72 -0.17 -0.48 0.13
# comorbidity: 1 -0.55 -1.15 0.05 -0.26 -0.60 0.09
# comorbidity: 2 0.17 -0.55 0.88 -0.08 -0.52 0.37
# comorbidity: 3 0.32 -0.54 1.18 -0.21 -0.88 0.47
# comorbidity: 4+ -0.17 -0.94 0.61 0.66 0.27 1.04
Year 2014 -0.16 -0.70 0.38 -0.31 -0.63 0.02
Year 2016 0.44 -0.23 1.11 -0.10 -0.44 0.24
Year 2017 0.05 -0.84 0.93 0.09 -0.39 0.57
Note: *Patient fixed effects omitted for brevity.
Abbreviations: MPP, Multidisciplinary Pain Program; Rx, prescription; ghP, geisinger health Plan.
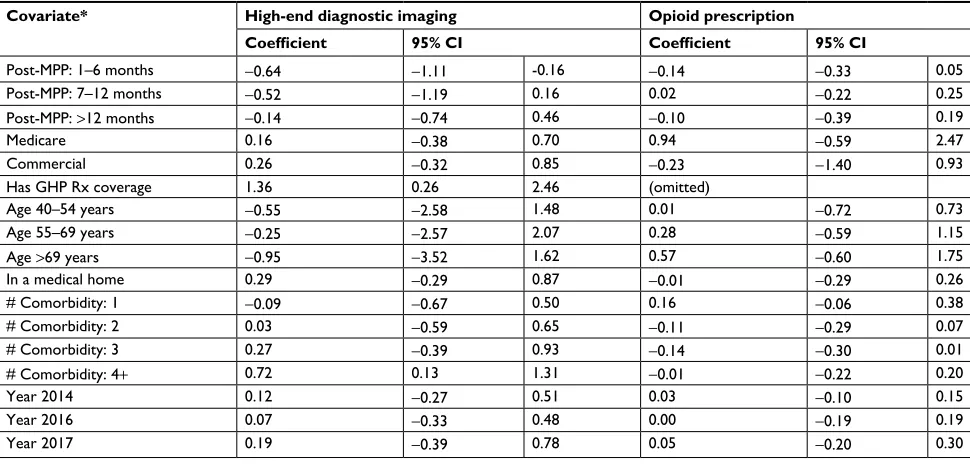
Table S3 Full regression outputs for diagnostic imaging and opioid medication utilization variables (Poisson model)
Covariate* High-end diagnostic imaging Opioid prescription
Coefficient 95% CI Coefficient 95% CI
Post-MPP: 1–6 months -0.64 -1.11 -0.16 -0.14 -0.33 0.05
Post-MPP: 7–12 months -0.52 -1.19 0.16 0.02 -0.22 0.25
Post-MPP: >12 months -0.14 -0.74 0.46 -0.10 -0.39 0.19
Medicare 0.16 -0.38 0.70 0.94 -0.59 2.47
commercial 0.26 -0.32 0.85 -0.23 -1.40 0.93
has ghP Rx coverage 1.36 0.26 2.46 (omitted)
age 40–54 years -0.55 -2.58 1.48 0.01 -0.72 0.73
age 55–69 years -0.25 -2.57 2.07 0.28 -0.59 1.15
age >69 years -0.95 -3.52 1.62 0.57 -0.60 1.75
in a medical home 0.29 -0.29 0.87 -0.01 -0.29 0.26
# comorbidity: 1 -0.09 -0.67 0.50 0.16 -0.06 0.38
# comorbidity: 2 0.03 -0.59 0.65 -0.11 -0.29 0.07
# comorbidity: 3 0.27 -0.39 0.93 -0.14 -0.30 0.01
# comorbidity: 4+ 0.72 0.13 1.31 -0.01 -0.22 0.20
Year 2014 0.12 -0.27 0.51 0.03 -0.10 0.15
Year 2016 0.07 -0.33 0.48 0.00 -0.19 0.19
Year 2017 0.19 -0.39 0.78 0.05 -0.20 0.30
Note: *Patient fixed effects omitted for brevity.
Abbreviations: MPP, Multidisciplinary Pain Program; Rx, prescription; ghP, geisinger health Plan.
Journal of Pain Research downloaded from https://www.dovepress.com/ by 118.70.13.36 on 24-Aug-2020