A Monthly Double-Blind Peer Reviewed Refereed Open Access International e-Journal - Included in the International Serial Directories International Journal in Commerce, IT & Social Sciences
http://www.ijmr.net.in email id- [email protected] Page 31
Dynamic conditional correlation analysis of foreign exchange market contagion during subprime crisis
Kamel Si MOHAMMED1, Abderrezzak BENHABIB2and Ibrahim OUJAMAA1 1
Department of Economics and Management, AinTemouchent University, Algeria [email protected]
2
Professor of Economics and Director of the Laboratory MECAS Faculty of Economics & Management, Tlemcen University, Algeria
ABSTRACT
The objective of this study is to measure contagion phenomenon between foreign exchange
markets during Subprime crisis using daily data from 03/01/2005 to 02/01/2014for ten selected
countries namely Algeria, Argentina, Australia, china, India, Great Britain, Malaysia, New-Zealand,
Norwayand Russiavia Dynamic conditional correlation multivariate GARCH. In summary, we
concluded of all exchange rates returns series influenced by the contagion effects come from USA.
Moreover, we observed the mean Dynamic conditional correlation multivariate GARCH increase in
financial compared the pre-crisis period.
Keyword: contagion, subprime crisis, DCC-MGARCH model, Exchange Rate Regimes.
JEL classifications: F31, G01,G15
I.
IntroductionIn the past recent years, particularly After July 2007, the global economy has been living the worst financial crisis since the Great Depression of the 1930s, so, it led to decline macroeconomic variables as recession, slower GDP growth and other consequences effects as unemployment rates, inflation, National and Multinational institutions collapse, stock markets crashes……
In addition, Suffer in the world economy doesn't stop from The U.S. Subprime mortgage crisis, while, it’s followed by Eurozone crisis (2010-May 2013).It has sizeable effects not only of the euro area member states' economies, but in several markets around the world.
Contagion phenomenon during Subprime crisisis not limited to transmit shocks on the macroeconomic and stock markets fundamentals, but it considerate contagion phenomenon in the
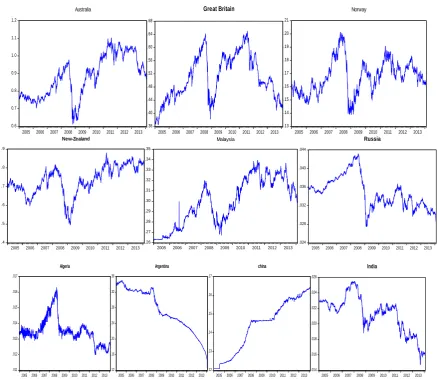
Foreign exchange market, while led rapidly to massive declines of the major currency see Figure 1….
The goal of this study is trying to measure the contagion phenomenon between foreign exchange markets during The U.S. subprime mortgage through an empirical analysis using DCC MGARCH methodology upon daily data from 03/01/2005 to 02/01/2014 for 10 countries2003-2013.
A Monthly Double-Blind Peer Reviewed Refereed Open Access International e-Journal - Included in the International Serial Directories International Journal in Commerce, IT & Social Sciences
http://www.ijmr.net.in email id- [email protected] Page 32
II.
Literature ReviewThe currency marketsare the larger an asset market size. The trading in foreign exchange
markets is averaged $5.3 trillion per day in April 2013 compared by $3.3 trillion in April 2007 (Bank
for International Settlements, 2013).Moreover, the exchange rate volatility does increase more than proportionally with the global financial stress, when, evidence regional contagion effects is spread
(VirginieCoudertet all, 2011).
Several studies are classified the exchange rates regimes for capturing currencies vulnerability during crisis periods. Jean-Louis Combes (2012) rejected that intermediate regimes are
more vulnerable to crises compared to the hard peg and the fully floating regimes. Atish R.
Ghosh (2010) suggested that the growth performance for pegs was not different from that of floats during the crisis. For the recovery period 2010–11, pegs appear to be faring worse.
In the crises history during two last decades, the fixed exchange rate regimes are more
vulnerable and fragile when the crisis occurrence: the Mexican peso crisis (1994), The Asian financial
crisis (1997), the Russian and Brazilian financial crises (1998, 1999), the devaluation of the Argentina
peso (2002); (see, Jean-Louis Combes (2012), Ahmed Atil (2008) , Levy-Yeyati et al. (2006), Fischer
(2001))
Van Horen etal (2006) investigated whether the contagion has transmit from Thailand to the other crisis countries through the foreign exchange market during the Asian crisis. Results show that there is evidence of contagion from Thailand with 13% and 21 % respectively to Indonesia and Malaysia currencies attributable to that contagion. On the Contrary, for Korea and the Philippines there is no evidence of contagion from Thailand.
Eichengreenet al. (1996) used thirty years of panel data from twenty industrialized countries for finding that is spread more easily contagion currency crises among the countries which are closely tied by international trade linkages. They paper propose inspired for late research to estimate similar approach and find that trade linkages are important evidence h on the contagion
transmissionin geographic proximity. (See Eichengreen and Rose (1998), Tornell and Velasco (1996)
Huh and Kasa (1997); Rigobon (1998))
Glick and Rose (1999 )provide to five episodes of currency (in 1971, 1973, 1992, 1994, and 1997) and 161 countries that trade linkages help explain cross-country correlations in exchange
market pressure during crisis episodes. Celik (2012) found strong evidence of contagion across
foreign exchange markets on 10 emerging and 9 developed markets for the period 2005–2009 using DCC-GARCH model.
In contrast, many studies have highlighted of contagion evidence are not propagated when
existed linked directly by macroeconomic fundamentals as trade links (Eichengreen et al. (1996), or
common shocks and Financial links (Calvo (1999), Forbes and Rigobon , (2001) Rijckeghem and
Weder, 2001) …. but just to transmit when there are down on Stock Markets (Directly) during the
financial crisis (Jawadietal.(2014), Bouaziz et al., 2012, Flavin and Panopoulou, 2010, Hutchison
2009, Khan andPark, 2009; Cho and Parhizgari, 2008…..)
Alouietall (2011)showed out in their study strong evidence of time-varying correlation and persistence between stock markets of each of the BRIC (Brazil, Russia, India, China)and the US markets Using daily return data for the period2004 to 2009.
A Monthly Double-Blind Peer Reviewed Refereed Open Access International e-Journal - Included in the International Serial Directories International Journal in Commerce, IT & Social Sciences
http://www.ijmr.net.in email id- [email protected] Page 33
Kazi et al. (2013) finds on the same model in sixteen OECD countries’ stock markets for detecting same results while, that consist the co-movement dynamics between those markets and found a
significant evidence of contagion effects after the GFC.Hwang et al. (2010) used a DCC-GARCH model
on 38 country data. He found evidence of financial contagion not only in emerging markets but also in developed markets during U.S. subprime.
The study of Naoui et al. (2010) examined financial contagion using the DCC GARCH (1,1)
technique and a correlation test for 10 emerging markets from 1 January 2005 to 01 July 2010. Their results indicate a contagion effect from the US towards Argentina, Brazil, Korea, Honk-Kong, Malaysia, Mexico and Singapore except for the Shanghai market (China) during the subprime crisis.
Yiu, Ho and Choi, (2010) examined the dynamics of correlation between 11 Asian stock markets and the US stock market from 1993 to early 2009 within asymmetric DCC-GARCH model. Their study finds strong evidence of contagion from USA to Asian markets in the period from late of 2007, while, they found no such evidence of having contagion between markets in Asia during the Asian financial crisis.
III.
Model and Methodology 1. Data sourceIn our analysis, we try to examine contagion phenomenon among foreign exchange markets during Subprime crisis using daily data from 03/01/2005 to 02/01/2014 for ten selected countries representing American, European, Middle East, and Oceania, Asian and African countries.
We use euro/US dollar exchange rate as a proxy for exchange rate variation across to Subprime crisis. The sources of these exchange rates collected from Thomson Reuters Data Stream. The return on exchange rate defined as:
We calculate foreign exchange rate returns as:
𝑅𝑖𝑡 = ln(𝑇𝑖𝑡
𝑇𝑡 −1)……… (1)
Where:
𝑇𝑖𝑡: Foreign exchange rateat time t
𝑇𝑡−1: Foreign exchange rateat timet-1
𝑅𝑖𝑡: Return on exchange rate at time t
2. Definition of the GARCH Model
In this study, the model we used is a generalized autoregressive conditional
heteroskedasticity (GARCH, while, Bollerslev (1986)) suggested the generalized ARCH of Engle (1982) . The GARCH model considers conditional variance to be a linear combination between squired of residual and a part of lag of conditional variance.
The mathematical representation of a GARCH (p,q):
ℎ𝑡 = 𝑎 + 𝑖=1𝑞 𝑏𝑖𝜀𝑡−𝑖2 + 𝑝𝑗 =1𝑐𝑗ℎ2𝑡−𝑗 (2)
Where 𝑎 > 0, 𝑏𝑖 ≥ 0 , 𝑐𝑗 ≥ 0∀i, ∀ j
Where 𝑎a variance in long term is, 𝑞𝑖=1𝑏𝑖𝜀𝑡−𝑖2 is squired of residualand 𝑝𝑗 =1𝑐𝑗ℎ𝑡−𝑗2 is a lag of
A Monthly Double-Blind Peer Reviewed Refereed Open Access International e-Journal - Included in the International Serial Directories International Journal in Commerce, IT & Social Sciences
http://www.ijmr.net.in email id- [email protected] Page 34 The development of the multivariate GARCH modelis designed to make GARCH models more parsimonious.WeidentifytheConstantConditionalCorrelation-(CCC)-GARCH model (Bollerslev,1990),
the BEKK-GARCH model(EngleandKroner,1995),and the Dynamic (D)CC-GARCH model
(EngleandSheppard,2001).
Results and Comment
1. Descriptive statistics of foreign exchange rate returns
The US Subprime crisis period covers from 17/07/2007 through 31/08/2009 (See Dungey,
2009, Glik, 2012).
Table one show descriptive statistics of exchange rate returns from17.07.2007 to 31.08.2009 (financial Crisis). The mean returns for all series are close to zero. We observe the kurtosis
coefficients of the foreign exchange rate returns are a lower, (with a kurtosis value 3). In the first
hand, these results explain the big shocks in two foreign exchange rate markets, on the other hand, this result reveal with their central banks intervening in forex market to defend their currencies(managed float rate exchange regime) to stabilize the situation over crisis period within monetary policy targets. The skewness coefficients were different than zero, while, it is indicates a non-symmetric series. The Jarque-Bera test and for normality for all the currencies in Table 1 are significant, which mean the exchange returns are not normal distribution.
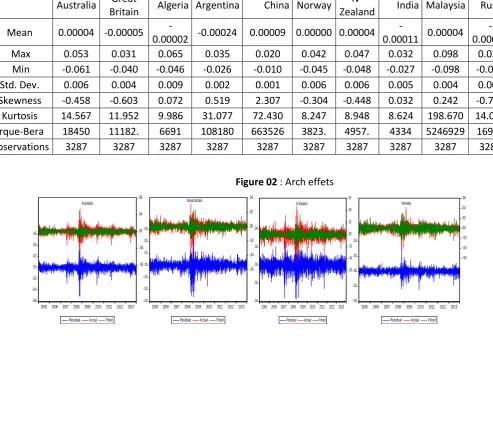
Entire period results presented in table 2 shows their kurtosis of the exchange rate returns exceed 3, while, the skewness(positive or negative) and Jarque– Bera results rejects the null hypothesis and indicates non- normal distribution of series. Finally, the mean of the log exchange rate returns range from to zero.
2. Estimation results of GARCH (1, 1) Model
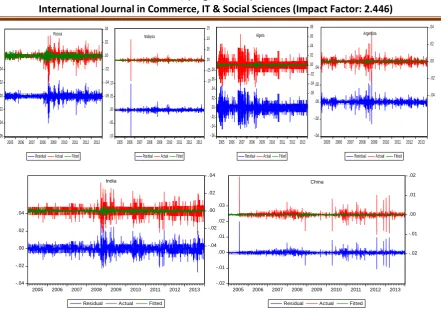
Before illustrating the results of generalized autoregressive conditional heteroscedasticity (GARCH) models, it is necessary to examine Heteroscedasticity test. The ARCH LM test proposed by
Engle (1982) indicates the presence of ARCH effects of all foreign exchange markets returns residuals
(See figure 02).
In the secondly examine, we make evaluates using tests of the Akaike information
criterion (AIC), (1974, 1976), Hannan-Quinn criter(HQC), (1979) and Schwarz Criterion, (SC), (1978) for detecting the best models between ARCH family models was selected (GARCH (1,1), GJR-GARCH(1,1), EGJR-GARCH(1,1), APARCH(1,1) models).The GARCH (1, 1) appears more advantages which has a less values in formers tests most equations estimating.
In table 3 and 4the results of parameter estimates using GARCH (1, 1) model are significant at
5% significance level. In particularly, the estimate y1parameteris positive on all currencies and for
each period. This findings reveal the role of the US dollar rates with exogenously determined to effect transmits on the other foreign exchange rates.
We also note in those tables high persistence of shocks in the volatility on all currencies
(ARCH term + GARCH term β are statistically significant at the 1%). Therefore and Based on same
model, the results show when we datable
The sum of the estimated persistence volatility ( and β parameters) are exceed than one for
A Monthly Double-Blind Peer Reviewed Refereed Open Access International e-Journal - Included in the International Serial Directories International Journal in Commerce, IT & Social Sciences
http://www.ijmr.net.in email id- [email protected] Page 35 persistence volatility are significant and it appear very high the sum of the estimated persistent coefficients very high but less than one except India exchange rate. In summary, we concluded of all exchange rates returns series influenced by the contagion effects come from USA.
For checking, table 5, 6shows the mean Dynamic conditional correlation multivariate GARCH during pre-crisis and crises. It indicates significant correlation over time, accordingly, we observed
the mean Dynamic conditional correlation multivariate GARCH increase in financial with large and
speed transmission compared the pre-crisis period.
Conclusion
In this paper, we measure contagion phenomenon between foreign exchange markets during Subprime crisisusing daily data from 03/01/2005 to 02/01/2014 for ten countries used different regimes exchange rate by employing DCC MGARCH model.
The main finding showed in Table 7 to 12 indicates that volatility persistence is higher in the independently floating exchange rate than manager’s exchange regime and the mean Dynamic conditional correlation multivariate GARCH increase in financial crisis compared the pre-crisis period.
References
Aloui, R., Aissa, M.S.B., Nguyen, D.K., 2011. Global financial crisis, extreme interdependences, and contagion effects: the role of economic structure? Journal of Bankingand Finance 35 (1), 130– 141.
AhmetAtıl (2007), “Parametric and Non-parametric Approaches to Exits from Fixed Exchange Rate Regimes”, GIIS Working Paper series No: 14
Akaike, H. (1974) "A New Look at the Statistical Model Identification," I.E.E.E. Transactions on Automatic Control, AC19, 716-723.
Akaike, H. (1976) "Canonical Correlation Analysis of Time Series and the Use of an Information Criterion," in R. K. Mehra and D. G. Lainotis (eds.), System Identification: Advances and Case Studies, Academic Press, New York, 52-107.
Bouaziz, M.C., Selmi, N., Boujelbene, Y., (2012). Contagion effect of the subprime financial crisis: evidence of DCC multivariate GARCH models. European Journal of Economics, Finance and Administrative Sciences (44), 66–76.
Brou Emmanuel Aka (2009), Subprime crisis and contagion: evidence from the BRVM, African Review of Money Finance and Banking 2009, pp. 51-71
Calvo, G. (1999), “Fixed versus Flexible Exchange Rates: Preliminaries of a Turn-of Millennium Rematch”, mimeo, University of Maryland.
Dajcman, S., Festic, M., &Kavkler, A. (2012). European stock market comovement dynamics during some major financial market turmoils in the period 1997 to 2010: A comparative DCC-GARCH
and wavelet correlation analysis. Applied Economics Letters, 19, 1249-1256.
http://dx.doi.org/10.1080/13504851.2011.619481
Dungey, M., (2009). The tsunami: measures of contagion in the 2007–08 credit crunch.Cesifo Forum 9 (4), 33-34.
Eichengreen, B., Rose, A., Wyplosz, C., (1996) “Contagious Currency Crises” CEPR Discussion Paper 1453.
A Monthly Double-Blind Peer Reviewed Refereed Open Access International e-Journal - Included in the International Serial Directories International Journal in Commerce, IT & Social Sciences
http://www.ijmr.net.in email id- [email protected] Page 36
Eichengreen, Barry, and A. Rose (1998), “Staying Afloat When the Wind Shifts: External Factors andEmerging Market Banking Crises”, NBER Working Paper, No: 6370.
Engle, R.F. (1982). “Autoregressive Conditional Heteroscedasticity with Estimates of the Variance of UK. Inflation”, Econometrica, 50: 987–1008
Engle, R.E., (2002). Dynamic conditional correlation: a simple class of multivariate generalized autoregressive conditional heteroskedasticity models. Journal of Businessand Economic Statistics 20, 339–350.
Fisher, S., (2001) “Exchange Rate Regime: Is the Bipolar view correct” Journal of Economic Perspectives 15, 3-24.
Hammoudeh, S. and Li, H. (2008). Sudden changes in volatility in emerging markets: The case of Gulf Arab markets, International Review of Financial Analysis, 17: 47–63.
Hansen, P.R. and Lunde, A. (2005). “A Forecast comparison of Volatility Models: Does Anything Beat a GARCH (1,1)?”, Journal of Applied Econometrics, 20: 873–889.
Horen, N.V., Jager, H., Klaassen, F., (2006). Foreign exchange market contagion in the Asian crisis: a regression based approach. Review of World Economics 142 (2), 374–401
Hwang, I., Haeuck In, F., Kim, T.S., (2010). Contagion effects of the U.S. subprime crisis on international stock markets. Finance and Corporate Governance Conference 2010 Paper.
Forbes, K., Rigobon, R., (2002). No contagion, only interdependence: measuring stockmarket co-movements. Journal of Finance 57 (5), 2223–2261.
Glick, R., Rose, A.K., (1999). Contagion and trade: why are currency crises regional?Journal of International Money and Finance 18 (4), 603–617.
Hannan, E. J. (1980)"The Estimation ofthe Order of an ARMA Process", Annals of Statistics, 8, 1071-1081.
Hannan, E. J., and B. G. Quinn (1979) "The Determination of the Order of an Autoregression," Journal of the Royal Statistical Society, B,41, 190-195.
Jean-Louis Combes & Patrick Plane & Tidiane Kinda, (2011). "Capital Flows, Exchange Rate Flexibility, and the Real Exchange Rate,"IMF Working Papers 11/9, International Monetary Fund.
Kazi, A., Guesmi, K., &Kaabia, O. (2013). Does shift contagion exist between OECD stock markets during the financial crisis? Journal of Applied Business Research, 29, 469-484.
khallouli, Wajih&Sandretto, René, (2012). "Testing for “Contagion” of the Subprime Crisis on the Middle East and North African Stock Markets: A Markov Switching EGARCH Approach," Journal of Economic Integration, Center for Economic Integration, Sejong University, vol. 27, pages 134-166.
Khan, S. and Park, K. (2009) Contagion in the Stock Markets: The Asian Financial Crisis Revisited, Journal of Asian Economics 20, 561-569.
Levy-Yeyati, Eduardo, Federico Sturzenegger and Iliana Reggio (2006), “On the Endogeneity of Exchange Rate Regimes”, KSG Working PaperNo. RWP06-047
Matthew Yiu&Wai-Yip Alex Ho & Daniel Choi, (2010)."Dynamic correlation analysis of financial contagion in Asian markets in global financial turmoil," Applied Financial Economics, Taylor & Francis Journals, vol. 20(4), pages 345-354.
A Monthly Double-Blind Peer Reviewed Refereed Open Access International e-Journal - Included in the International Serial Directories International Journal in Commerce, IT & Social Sciences
http://www.ijmr.net.in email id- [email protected] Page 37
Olowe, Rufus Ayodeji(2009), Modelling Naira/Dollar ExchangeRate Volatility: Application Of Garch And Assymetric Models, International Review ofBusiness Research Papers Vol.5 No. 3 April Pp. 377- 398
Omar Hemche, FredjJawadi, , ,Samir B. Maliki,Abdoulkarim Idi Cheffou »On the Study of Contagion in the Context of the Subprime Crisis: A Dynamic Conditional Correlation - Multivariate GARCH Approach”Economic Modelling, October 2014, PP
Schwarz, G. (1978) "Estimating the Dimension of a Model," Annals of Statistics, 6, 461-464.
Schwert, G.W. (1989), “Why does Stock Market Volatility Change over Time?” Journal of Finance, 44: 1115–1153.
Reinhart, Carmen M, and Kenneth S. Rogoff. 2009. The aftermath of financial crises. American Economic Review 99, no. 2: 466-472.
Van Rijckeghem, C. and B. Weder (2001), "Sources of contagion: is it finance or trade?", Journal of International Economics, 54, 2, pp. 293-308.
ThomasJ.Flavin&EkateriniPanopoulou, (2010). "Detecting Shift And Pure Contagion In East Asian Equity Markets: A Unified Approach," Pacific Economic Review, Wiley Blackwell, vol. 15(3), pages 401-421, 08.
Tornell, A. and A. Velasco (1999), “Fixed versus flexible Exchange Rates: Which Provides More fiscal Discipline?”, Forthcoming, Journal of Monetary Economics.
VirginieCoudert et all, (2011) exchange rate volatility across financial crisis, Exchange rate volatility across financial crises, journal of banking & Finance, vol 35, Nov, pp3010-3018.
A Monthly Double-Blind Peer Reviewed Refereed Open Access International e-Journal - Included in the International Serial Directories International Journal in Commerce, IT & Social Sciences
http://www.ijmr.net.in email id- [email protected] Page 38
Annex
Figure 1: foreign exchange rates
0.6 0.7 0.8 0.9 1.0 1.1 1.2
2005 2006 2007 2008 2009 2010 2011 2012 2013
Australia .36 .40 .44 .48 .52 .56 .60 .64 .68
2005 2006 2007 2008 2009 2010 2011 2012 2013 Great Britain .13 .14 .15 .16 .17 .18 .19 .20 .21
2005 2006 2007 2008 2009 2010 2011 2012 2013
Norway .4 .5 .6 .7 .8 .9
2005 2006 2007 2008 2009 2010 2011 2012 2013
New-Zealand .024 .028 .032 .036 .040 .044
2005 2006 2007 2008 2009 2010 2011 2012 2013
Russia .011 .012 .013 .014 .015 .016 .017
2005 2006 2007 2008 2009 2010 2011 2012 2013
Algeria .12 .16 .20 .24 .28 .32 .36
2005 2006 2007 2008 2009 2010 2011 2012 2013
Argentina .12 .13 .14 .15 .16 .17
2005 2006 2007 2008 2009 2010 2011 2012 2013
china .014 .016 .018 .020 .022 .024 .026
2005 2006 2007 2008 2009 2010 2011 2012 2013
India .26 .27 .28 .29 .30 .31 .32 .33 .34 .35
2005 2006 2007 2008 2009 2010 2011 2012 2013
A Monthly Double-Blind Peer Reviewed Refereed Open Access International e-Journal - Included in the International Serial Directories International Journal in Commerce, IT & Social Sciences
http://www.ijmr.net.in email id- [email protected] Page 39
Table 01: descriptive statistics of exchange rate returns from 17.07.2007 to 31.08.2009 (financial Crisis)
Australia
Great
Britain Algeria Argentina china Norway
N-Zealand India Malaysia Russia
Mean 0.0000 -0.0003 -0.0001 -0.0003 0.0001 -0.0001 -0.0002 -0.0003 0.0000
-0.0003
Maximum 0.053 0.031 0.042 0.035 0.007 0.042 0.047 0.032 0.031 0.031
Minimum -0.061 -0.040 -0.046 -0.026 -0.008 -0.045 -0.047 -0.025 -0.026 -0.043
Std. Dev. 0.010 0.006 0.010 0.004 0.001 0.008 0.009 0.005 0.004 0.006
Skewness -0.390 -0.732 -0.085 0.724 -0.142 -0.251 -0.378 0.566 0.183 -1.245
Kurtosis 10 10 8.291 22.564 17.142 8 7.34 9.587 9.388 15.005
Jarque-Bera 1731 1771 907 12459 6477 723. 628. 1446 1325 4867
Observations 777 777 777 777 777 777 777 777 777 777
Table 02: descriptive statistics of exchange rate returns from 03.1.2005 to 02.1.2014 (Entire period)
Australia
Great
Britain Algeria Argentina China Norway
N-Zealand India Malaysia Russia
Mean 0.00004 -0.00005
-0.00002 -0.00024 0.00009 0.00000 0.00004
-0.00011 0.00004
-0.00005
Max 0.053 0.031 0.065 0.035 0.020 0.042 0.047 0.032 0.098 0.031
Min -0.061 -0.040 -0.046 -0.026 -0.010 -0.045 -0.048 -0.027 -0.098 -0.043
Std. Dev. 0.006 0.004 0.009 0.002 0.001 0.006 0.006 0.005 0.004 0.004
Skewness -0.458 -0.603 0.072 0.519 2.307 -0.304 -0.448 0.032 0.242 -0.751
Kurtosis 14.567 11.952 9.986 31.077 72.430 8.247 8.948 8.624 198.670 14.011
Jarque-Bera 18450 11182. 6691 108180 663526 3823. 4957. 4334 5246929 16926
Observations 3287 3287 3287 3287 3287 3287 3287 3287 3287 3287
Figure 02 : Arch effets
-.06 -.04 -.02 .00 .02 .04 .06 -.08 -.04 .00 .04 .08
2005 2006 2007 2008 2009 2010 2011 2012 2013 Residual Actual Fitted
Australia -.03 -.02 -.01 .00 .01 .02 .03 -.06 -.04 -.02 .00 .02 .04
2005 2006 2007 2008 2009 2010 2011 2012 2013 Residual Actual Fitted
Great Britain -.04 -.02 .00 .02 .04 -.06 -.04 -.02 .00 .02 .04 .06
2005 2006 2007 2008 2009 2010 2011 2012 2013 Residual Actual Fitted
N-Zealand -.04 -.02 .00 .02 .04 -.06 -.04 -.02 .00 .02 .04 .06
2005 2006 2007 2008 2009 2010 2011 2012 2013 Residual Actual Fitted
A Monthly Double-Blind Peer Reviewed Refereed Open Access International e-Journal - Included in the International Serial Directories International Journal in Commerce, IT & Social Sciences
http://www.ijmr.net.in email id- [email protected] Page 40
-.06 -.04 -.02 .00 .02 .04 -.06 -.04 -.02 .00 .02 .04
2005 2006 2007 2008 2009 2010 2011 2012 2013 Residual Actual Fitted
Russia -.10 -.05 .00 .05 .10 -.10 -.05 .00 .05 .10 .15
2005 2006 2007 2008 2009 2010 2011 2012 2013 Residual Actual Fitted
Malaysia -.06 -.04 -.02 .00 .02 .04 .06 .08 -.06 -.04 -.02 .00 .02 .04 .06 .08
2005 2006 2007 2008 2009 2010 2011 2012 2013 Residual Actual Fitted
Algeria -.04 -.02 .00 .02 .04 -.04 -.02 .00 .02 .04
2005 2006 2007 2008 2009 2010 2011 2012 2013 Residual Actual Fitted
Argentina -.04 -.02 .00 .02 .04 -.04 -.02 .00 .02 .04
2005 2006 2007 2008 2009 2010 2011 2012 2013 Residual Actual Fitted
India -.02 -.01 .00 .01 .02 .03 -.02 -.01 .00 .01 .02
2005 2006 2007 2008 2009 2010 2011 2012 2013 Residual Actual Fitted
China
Table 3: Parameter Estimates for GARCH Model for exchange rate returns from17/07/2007 31/08/2009
Parameter Persistance
Australia 8.97E-05* 0.969543* 0.124486* 0.833688* 0.958174
Great
Britain -0.00025 0.678107* 0.065186* 0.929636* 0.994822
N-Zealand
-0.000126* 1.008644* 0.079832* 0.890858* 0.97069
Norway 0.000156 1.154827* 0.193152* 0.798383* 0.991535
Russia 1.86E-05 0.552558* 0.081106* 0.925979* 1.007085
Algeria -0.000189 0.301162* 0.137718* 0.819069* 0.956787
Malaysia 1.12E-05 0.328576* 0.136888* 0.82636* 0.963248
India
-0.000134* 0.228683* 0.09067* 0.906474* 0.997144
chaina 0.000122 0.045964*
-0.011165* 0.579763* 0.568598
A Monthly Double-Blind Peer Reviewed Refereed Open Access International e-Journal - Included in the International Serial Directories International Journal in Commerce, IT & Social Sciences
http://www.ijmr.net.in email id- [email protected] Page 41
Table 4: Parameter Estimates for GARCH Model for exchange rate returns from regimes from 1/01/2005 1/02/2014
Parameter Persistance
Russia 0.0000661* 0.466395* 0.090915* 0.91208* 1.002995
Algeria -7.51E-05 0.249473* 0.070244* 0.916539* 0.986783
Malaysia 0.0002 0.17892* 0.245152* 0.82376* 1.068912
India -2.36E-05 0.245481* 0.06709* 0.92233* 0.98942
chaina 1.05E-04 0.040035* 0.222034* 0.2057* 0.427734
Argentina -1.76E-04 0.085796* 0.246103* 0.69729* 0.943393
Australia 0.0000933 0.745604* 0.059159* 0.928003* 0.987162
Great
Britain 0.000177 0.633037* 0.042441* 0.952221* 0.994662
Norway 0.000632* 1.040295* 0.076505* 0.894843* 0.971348
N-Zealand 0.0000932 0.778014* 0.034932* 0.954436* 0.989368
Norway 0.0000632 1.040295* 0.076505* 0.894843* 0.971348
Table 5:Independently floating exchange regimes
Australia Great Britain the Philippines Iceland Mexico Norway N-Zealand
Subprime crisis 0,95 0,76 0,22 1,01 0,14 1,15 0,90
Pre-crisis 0,70 0,76 0,12 0,73 0,11 1,32 0,70
% differencesubpcrisis 35,71 0,26 83,33 38,36 27,27 -12,88 28,57
Table 6:Managed float rate regimes
Algeria Argentina china India Malaysia Nigeria Russia
Subprime crisis 0,30 0,07 0,05 0,22 0,32 0,09 0,56
Pre-crisis 0,27 0,06 0,02 0,12 0,30 0,08 0,29