M E T H O D
Open Access
Measuring cell-type specific differential
methylation in human brain tissue
Carolina M Montaño
1,2, Rafael A Irizarry
3, Walter E Kaufmann
4, Konrad Talbot
5, Raquel E Gur
5, Andrew P Feinberg
6and Margaret A Taub
7*Abstract
The behavior of epigenetic mechanisms in the brain is obscured by tissue heterogeneity and disease-related histological changes. Not accounting for these confounders leads to biased results. We develop a statistical methodology that estimates and adjusts for celltype composition by decomposing neuronal and non-neuronal differential signal. This method provides a conceptual framework for deconvolving heterogeneous epigenetic data from postmortem brain studies. We apply it to find cell-specific differentially methylated regions between
prefrontal cortex and hippocampus. We demonstrate the utility of the method on both Infinium 450k and CHARM data.
Keywords:DNA methylation, epigenetics, differentially methylated region, brain region, cell-type heterogeneity, deconvolution, NeuN, neuron, glia, postmortem brain, fluorescence activated cell sorting
Background
The brain is a particularly good example of highly spe-cialized and diverse functions arising from the same genetic program. Epigenetic mechanisms copy informa-tion other than the sequence itself during cell division, such as DNA methylation and chromatin arrangements [1]. Therefore, epigenetics is an attractive substrate for understanding specialized brain function and its disrup-tion in disease. An example of an epigenetic mechanism is DNA methylation, which at CpG dinucleotides is heritable during cell division, because that sequence is recognized by a DNA methyltransferase on newly repli-cated strands. In post-mitotic cells such as neurons, DNA methylation has been shown to contribute to memory formation [2], other types of synaptic plasticity [3], drug addiction [4], and reversible behavior in the honeybeeApis mellifera [5]. Neurological diseases have also been linked to mutations in DNA methyltrans-ferases [6] and methyl-CpG-binding proteins [7].
Despite its importance, the epigenetic profile of the brain has not yet been explored in depth due to, among other factors, brain region and cell-type heterogeneity.
The cerebral cortex has distinct functional regions, each organized into cell layers of neurons and glia that vary throughout the cortex [8]. While neurons are the main sig-naling unit, glia play an important role in scaffolding and maintaining synapses [9]. Epigenetic profiling of neurons and non-neurons using the Illumina GoldenGate assay has shown that neurons and glia have a unique DNA methyla-tion signature that cannot be assessed using samples from bulk cortex [10]. This is important because shifts in glial cell populations such as oligodendrocytes contribute to defects in cortical myelination, and microglia activation has been linked to neurodegenerative disorders [11].
Traditional epidemiological studies using brain tissue done so far do not account for differences in cell-type composition [12-14]. Statistical methods for estimating cell-type composition from genomic profiles have been developed for gene expression [15-18], and DNA tion in blood tissue [19] and in brain [20]. DNA methyla-tion can then be used to calculate and potentially adjust for differing cell proportions, a crucial step when studying diseases where cell population shifts occur [21].
While DNA methylation data can now be used to cal-culate differing cell proportions, individual cell-type pro-filing has not been done yet due to the extensive mixture combinations required for validation in blood (at least five different cell types) [19]. In contrast, cell profiling in * Correspondence: [email protected]
7
Department of Biostatistics, Johns Hopkins Bloomberg School of Public Health, 615 N Wolfe Street, Baltimore, MD 21205, USA
Full list of author information is available at the end of the article
the brain can be achieved by separating the cell types into two main compartments: neurons and glia. In a recent publication [20], a method is proposed for estimating neuron and glia proportions similar to the approach pro-posed for whole blood [19]. While this is a useful step toward correcting for cell distribution, this approach does not permit the unbiased estimation of glia- and neu-ron-specific differences between two sets of samples [20]. Such calculated cell-type specific analysis offers a crucial advantage in studies of the brain, where neurons and glia cannot generally be dissociated. For example, many brain bank specimens contain pulverized material or even par-affin-fixed specimens, for which methods exist to isolate DNA for genome-scale methylation analysis [22]. Flow sorting, as done here to develop this method, generally does not yield sufficient quantities of material for gen-ome-scale analysis, and is also extremely labor intensive and costly.
Here we have developed a novel statistical epigenetics approach that takes advantage of the stability and cell-type specificity of DNA methylation, as well as the fact that the brain is made up of two major cell types, neu-rons and glia, in order to deconvolve the two main cell components in the brain. Thus, the method allows one to measure DNA methylation, for example, across brain regions, and from those data calculate to a first approxi-mation the difference in DNA methylation that is neu-ron- or glia-specific. Moreover, once sorted data is available for a given brain region, investigators can use such data to calculate cell proportions on any unsorted sample measured on the same methylation platform without the need to sort themselves. This approach should have broad application to a range of problems in neurodevelopment and disease research.
Results and discussion
Estimation of mixture proportions
We measured DNA methylation profiles for dorsolateral prefrontal cortex (DLPFC), hippocampal formation (HF), and superior temporal gyrus (STG) samples dissected from frozen brains of normal individuals using the com-prehensive high-throughput arrays for relative methylation (CHARM) technique [23]. We also labeled and separated neuronal nuclei in a subset of samples using a neuron-specific antibody (NeuN) and fluorescence-activated cell sorting (FACS) [24,25]. Neuronal (NeuN+) and non-neuronal (NeuN-) fractions from DLPFC, HF, and STG were collected for downstream processing and methyla-tion analysis with CHARM (Addimethyla-tional File 1, Figure S1).
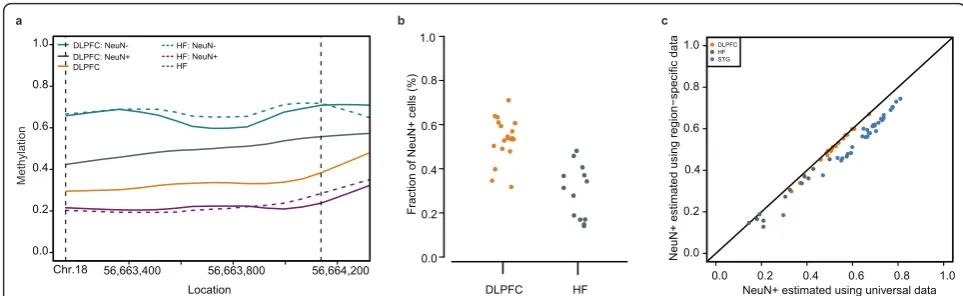
To illustrate the downstream effects of the cell popula-tion confounding problem, and focusing on two brain regions for clarity, we examined a genomic region for which: (1) no difference was observed between DLPFC
and HF in either neuronal or glial fractions; and (2) a dif-ference was observed between neuronal and glial nuclei within each brain region (Figure 1a). Note that a strong methylation difference between brain regions is observed between the non-cell-sorted brain samples. This must be a false-positive and, as we demonstrate below, must be due to differences in cell-type composition between the brain regions.
We modified a statistical method originally developed to estimate cell populations in blood [19] to calculate neuronal and glial proportions for each of our unsorted samples, adapting it to use a constrained linear optimiza-tion model (Figure 1b, see overview in Addioptimiza-tional File 1, Figure S2a). We confirmed that our approach effectively estimated these cell proportions using a mixture experi-ment with an independent set of samples (Additional File 1, Figure S2b). To demonstrate that the false-positive results of Figure 1 are due to difference in cell-type distri-bution, we mathematically reconstructed the unsorted sample methylation profile using the pure neuronal and glial profiles and their estimated frequencies and pre-dicted this result (Additional File 1, Figure S2c).
While the above results rely on having neuronal and glial methylation signals for each brain region, we per-formed additional analyses to determine whether accurate estimates of neuronal and glial proportions in unsorted samples from a brain region could be obtained using selected data from another brain region. Figure 1c shows the accuracy of estimates obtained from such‘universal’ data, compared to estimates based on sorted data from each individual brain region. We also accurately reproduce the cell proportion estimates from our mixture experiment (Additional File 1, Figure S2d, see Materials and Methods for additional details of how this analysis was performed). Our results indicate that accurate estimates could be obtained for a new brain region without the need to sort samples from that region.
Generative model of methylation signal
Currently, obtaining cell-type specific DMRs from unsorted samples is a mathematically intractable problem. However, because in human postmortem brain samples we are interested in just two cell fractions (neurons and glia), we were able to develop a novel statistical procedure to perform this deconvolution. The methylation signal for any sampleiat a given genomic location,Yi, can be mod-eled as a linear combination of the methylation levels of neuronal and glial fractions in the brain region where the sampleiwas obtained. Specifically, for any given CpG, the DNAm profile of a mixed sample can then be written as (see Materials and Methods):
Here, we defineμD,+and μD,−to be the methylation level of neuronal and glial fractions, respectively, in DLPFC, withμH,+andμH,−defined similarly for HF. For each samplei, Xiis 1 if sampleiwas obtained from HF and 0 for DLPFC samples. We letπito be the fraction of glia in samplei, so that1−πiis the fraction of neurons. Finally,εirepresents biological variability and measure-ment error. The statistical insight is that because the term πican be estimated with high precision (Additional File 1, Figure S2c), it can be treated as fixed. With this assump-tion in place, the equaassump-tion above is actually a linear model of the form
Yi=β0+β1πi+β2Xi(1−πi) +β3Xiπi+εi,
in which the parametersβ2andβ3represent the
quanti-ties we are interested in measuring, that is, the differences in neurons and glia, respectively, between brain regions. We refer to this model as M2. Fitting this linear model by least squares and obtaining estimates for millions of geno-mic locations is computationally feasible. (Fitting the model for 4 million probes took about 5 seconds on our laptop).
This statistical framework also exposes the problem with existing naïve approaches to assess DNA methylation sig-natures in mixed samples. To date, most published ana-lyses ignore cell composition [26-30] and look for associations in a way equivalent to fitting a simple linear regression modelYi=α0+α1Xi+εi(where the t-test is derived from the Xi= 0 or 1). We refer to this model as M1. In M1, the parameterα1represents a combination of
the methylation differences in neurons and glia in which it is impossible to deconvolve cell-type-specific contributions. Furthermore, we can mathematically demonstrate that the least squares estimate ofα1will be biased by differences in
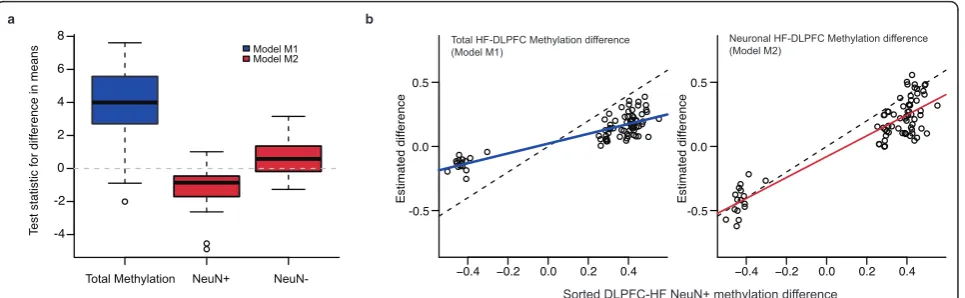
cell-type frequency under the null hypothesis of no differ-ence in methylation between brain regions (Figure 2a, see Methods Section). Similarly, a naïve model suggested by Guintivanoet al.[20] that incorporates cell-type propor-tionsYi=γ0+γ1Xi+γ2πi+εi(we refer to this as model
M3) will lead to biased results as well, and to decreased power to detect methylation differences (Additional File 1, Figure S3). We also note that even the superior methods show a small amount of bias (boxplot not centered at 0), which can be explained by slightly inaccurate mixture esti-mates (see Materials and Methods).
To test the utility of our model, we confirmed our theo-retical results with experimental data. First, we obtained estimates of significant neuron-specific methylation differ-ences between DLPFC and HF using sorted brain samples (gold standard, FDR <0.05, Additional File 1, Table S1). We then used the unsorted brain data to calculate the parameters representing the differences in brain-region methylation using models M1 (total methylation differ-ence,α1) and M2(neuron-specific methylation difference,
β2). Figure 2b shows that we can estimate neuron-specific
methylation differences more accurately with model M2. Therefore, we can assess neuron-specific methylation dif-ferences between DLPFC and HF using whole tissue after estimating cell proportions.
Using the sorted samples, we did not find statistically sig-nificant DMRs in the non-neuronal fraction, which high-lights the importance of isolating a neuronal signal from total methylation values. The result is in agreement with recently published literature suggesting that glia cells, con-tained in the NeuN- fraction, have less diverse transcrip-tion patterns across brain regions than neurons [31], the latter having a distinct DNA-methylation signature [10]. Interestingly, proteins involved in modifying chromatin
56,663,400 56,663,800 56,664,200
0.0 0.2 0.4 0.6 0.8
1.0 DLPFC:
NeuN-DLPFC: NeuN+ HF: NeuN-HF: NeuN+ DLPFC HF Methylation Chr.18 a 0.0 0.2 0.4 0.6 0.8 1.0 Fr
action of NeuN+ cells (%)
DLPFC HF ● ● ● ● ● ● ● ● ●● ● ● ● ● ● ● ● ● ●
0.0 0.2 0.4 0.6 0.8 1.0
0.0 0.2 0.4 0.6 0.8 1.0
NeuN+ estimated using universal data
[image:3.595.55.537.88.236.2]1HX1HVWLPDWHGXVLQJUHJLRQíVSHFLILFGDWD ● ● ● ● ● ● ● ● ● ● ● ● ● ● ●● ● ● ● ● ● ● ● ● ● ● ● ● ● ● ● ● ● ● ●● ● ● ● ● ● ● ● ● ● ● ● DLPFC HF STG c b Location
Figure 1The proportion of neuronal cells in a given brain region influences the identification of differentially methylated regions.
were found among the brain-region neuronal DMRs, sup-porting the role of epigenetic mechanisms in neuronal function and synaptic plasticity [32]. For example, neuron-specific methylation of the histone methyltransferase SETD3, which methylates histone H3 at lysine 36, was lower in HF than in DLPFC, and histone deacetylase HDAC4shows hypomethylation in DLPFC. Other genes involved in neural differentiation includeJAG1,TTL1, NPAS4,CUX-2, DOCK2,NGEF,OLFM1, SATB2, and GIT2.
Application to Illumina Infinium HumanMethyation450 Dataset
While the CHARM platform has many advantages for studying methylation patterns due to the high density and location of probes, the assay requires restriction-enzyme digestion and lacks single-base resolution. The Illumina Infinium HumanMethylation450 (450K) array has emerged as an affordable alternative to obtain reliable quantitative measurements of methylation. To demonstrate the perfor-mance of our method on data from the 450K array, we used data accessible at NCBI GEO database (Guintivanoet al.[20], accession GSE41826), consisting of 77 normal samples from prefrontal cortex, of which 29 were sorted into neuronal and glial fractions, nine were mixtures of neurons and glia of known proportions, and 10 were unsorted, whole-tissue samples. We first applied our method to obtain accurate cell-fraction estimates on the known mixture samples (Additional File 1, Figure S4a). Using these cell-fraction estimates and the pure neuronal and glial profiles, we mathematically reconstructed the methylation profile for the mixture samples in a set of genomic regions and compared these results to the actual observed methylation for these samples (Additional File 1,
Figure S4b). The cell proportion calculations agreed with Guintivanoet al.’s estimates for prefrontal cortex. Our CHARM cell proportion estimates are on average higher than those obtained using 450K arrays, as the CHARM data were sampled using 2 mm dermal biopsy punches to minimize white matter contamination. The mathematical reconstruction of the methylation signal was also done for the unsorted samples (Additional File 1, Figure S4c).
Given that sorted data on the 450K array are only avail-able for one brain region, we cannot demonstrate our improved ability to detect true brain-region differences in cell-type specific methylation on this platform. However, to show our ability to reduce false-positive signal, we constructed an artificial comparison by grouping the mixture samples with the highest and lowest neuronal fractions and applied models M1 and M2 to look for dif-ferences between these two groups. Any such difdif-ferences are clearly due only to cell-fraction variation, and model M2 reduces the number of false-positive signals (Addi-tional File 1, Figure S4d), as we saw for our CHARM data (Figure 2a). These results indicate that our methods apply well to data from the 450K array.
Conclusions
We describe an algorithm to address a gap in the analysis of methylation data from complex tissues with varying degrees of cell-type heterogeneity such as the brain. To appropriately measure the methylation differences between two brain cortical regions, we separated a small number of samples of the brain nuclei into neuronal and non-neuronal fractions by cell sorting, and developed a statistical method to account for cell heterogeneity in a set of unsorted samples by decomposing the signal into its two components. Our proposed method takes advantage Total Methylation NeuN+
NeuN--4 -2 0 2 4 6 8
Test statistic f
or diff
erence in means
Estimated diff
erence
a b
Model M2 Model M1
Sorted DLPFC-HF NeuN+ methylation difference Total HF-DLPFC Methylation difference
(Model M1)
Neuronal HF-DLPFC Methylation difference (Model M2)
0.4 0.2 0.0 0.2 0.4 -0.5
0.0 0.5
0.4 0.2 0.0 0.2 0.4 -0.5
0.0 0.5
Estimated diff
[image:4.595.59.542.89.238.2]erence
of the separation of the brain cells into two nuclei frac-tions. The neuronal fraction encompasses a diverse popu-lation of neuronal cells, and the non-neuronal nuclei contain astrocytes, oligodendrocytes, a minority of NeuN-negative neurons, and endothelial cells. To separate the methylation signal into more than two fractions is mathe-matically plausible, as one can simply defineπias the frac-tion of cells of the cell-type of interest, fit model M2, and considerβ3. However, investigating how robust our results
are to the noise in cell fraction estimates when there are more than two cell types will require further study.
The experimental design presented here provides for effi-cient use of scarce tissue bank resources and limited funds for methylation profiling. Once purified methylation pro-files are obtained from the brain regions of interest using a small number of samples, the gold-standard methylation data can be used for any further analysis, and by any laboratory, without the need to sort nuclei again. We have demonstrated our method on data from both CHARM and the Illumina 450K array. To apply our method to a new measurement platform or new brain regions, we recom-mend performing cell sorting on a subset of the samples to first obtain the type specific signals needed for the cell-fraction estimation. If brain-region specific data are not available, we have also shown that for samples measured with CHARM, accurate estimates of cell proportions in samples from one brain region could be obtained using sorted data from another brain region. We provide a fra-mework that can be applied, even retrospectively, to psy-chiatric case-control studies using frozen postmortem brain samples, and can be easily adapted to other microar-ray or sequencing platforms, and to other target tissues.
Materials and methods
Generative model of methylation signal
To illustrate our model, we consider the case of estimating differences in methylation between DLPFC (D) and HF (H). We assume these brain tissues are composed of two cell types, NeuN+ (+) and NeuN- (-). For a fixed genomic position, we letμj,k be the methylation level in regionj, jÎ{H, D} and cell typek, kÎ{+, -}. Scientifically, we are interested in identifying genomic locations whereμH,k -μD,k≠0, that is, where NeuN+ or NeuN- have different methylation levels in the two brain regions.
Given a sampleiand considering a fixed genomic posi-tion, we defineXias the indicator that sampleiis from the
hippocampus, that is,Xi= 1 if sampleiis from the
hippo-campus and 0 otherwise. We also defineπito be the
frac-tion of sampleithat consists of NeuN- cells (1 -πiis the
fraction of NeuN+ cells). We can then derive the expected value of the methylation signal of sampleiat that genomic position as
E(Yi) ={πiμD,−+ (1−πi)μD,+}(1−Xi) +{πiμH,−+ (1−πi)μH,+}(Xi).
Rearranging terms gives:
E(Yi) =μD,++ (μD,−−μD,+)πi+ (μH,+−μD,+)Xi(1−πi) + (μH,−−μD,−)Xiπi (1)
Suppose we wanted to estimate whether there is a dif-ference in methylation between the two brain regions being considered, H and D. If we fit a model with terms matching those above, that is,
E(Yi) =β0+β1πi+β2Xi(1−πi) +β3Xiπi (M2)
then our estimated coefficients have interpretations equivalent to the generative model in Equation 1. Specifi-cally, we can test the hypothesis of no difference in NeuN+ methylation between D and H (μH,+- μD,+= 0)
by testing the hypothesis thatb2= 0, and the hypothesis
of no difference in NeuN- methylation between D and H (μH,--μD,-= 0) by testing the hypothesis thatb3= 0.
From the equations above, we can see that estimating the fraction of cells of each type,πi, allows us to explicitly
find locations with brain-region differences specific to NeuN+ or NeuN- cells.
Naïve models are biased
In general,πiis unknown and therefore not included in
the linear model, that is, the model
E(Yi) =α0+α1Xi (M1)
is fitted. However, this model does not account for all the sources of variation inYi, and the least squares
esti-mateαˆ1is a biased estimate of the difference in
methyla-tion between H and D under the null hypothesis. To see this, we can writeE(αˆ) = (XtX)−1XtX(Y), whereXis the design matrix of the above model andαˆ1is the vector
(αˆ0,αˆ1) and the hats represent least squares estimates.
For simplicity, we assume equal numbers of samples from H and D. We then have
E(αˆ1) =μH,+−μD,++ (μH,−−μH,+)π¯H−(μD,−−μD,+)π¯D
Whereπ¯jis the mean fraction of NeuN- cells in region
j. Under the null hypothesis of no difference between D and H in either + or -, we haveμH, + −μD, + = 0and
also(μH, - −μH, +) = (μD, - −μD, +) =δ, which gives
E(αˆ1) =δ(π¯H− ¯πD).
This means that where + and - have different methyla-tion levels (δ≠0), a difference in the fractions of + and -cells in the different brain regions can lead to false-positive signals of brain region differences in methylation.
Guintivanoet al.[20] estimateπiand propose anad hoc approach to adjust for this that is approximated by fitting the following model
However, this model does not account for all the sources of variation inYieither and the least squares
estimateγˆ1is a biased estimate of the difference in
methylation between H and D. To see this, we can write
E(γˆ) = (XtX)−1XtE(Y), whereX is the design matrix of the above model andγˆ is the vector(γˆ0,γˆ1,γˆ2)and the
hats represent least squares estimates. For simplicity, we assume equal numbers of samples from H and D. We then have
E(γˆ1) =μH,+−μD,++K((μH,−−μH,+)−(μD,−−μD,+))
Where K is a function of theπi‘s that does not depend on the sample size:
K=
¯
πH
1 2πH¯ π¯ +
1 2π¯
2−(π¯)2
+1
2π¯
2
H(π¯ − ¯πH)
1 2
¯
π2−(πH)¯ 2+π¯(πH¯ − ¯π)
Withπ¯ andπ¯Hthe average of theπi‘s in all samples and
H samples, respectively, andπ¯2andπ¯2
Hthe average of the π2
i ‘s in all samples and H samples, respectively. Note that the bias is directly proportional to the difference between NeuN+ and NeuN- fractions, demonstrating that this approach is incapable of deconvolving these quantities of interest.
Estimation of mixture proportions
Although we have shown that fitting the mis-specified model, which does not include the cell-fraction terms, can lead to bias under the null hypothesis, the cell fractions for a given sample are unknowna priori. At any given methy-lation site, we are assuming that there is some underlying mean methylation value within each combination of cell type (+, -) and brain region (D, H). If we know these underlying means, we can derive an estimate of the unknown cell fraction at a particular site, given an observed methylation signal and assuming the generative model above. For example, suppose sample i is from D and we observe methylation signalYiat a given locus.
From Equation 1, we have
E(Yi) =μD,++πi(μD,−−μD,+) =πiμD,−+ (1−πi)μD,+(2)
If we assumeμD,+andμD,−are known,πiis the only unknown in this equation, so it can be estimated. Note that we do need to constrain our estimate ofπito be between 0 and 1. Also, the meansμare not known, so we collected data to allow us to estimate these means, by mea-suring methylation in pure cell sorted + or - fractions from each brain region of interest. Given that these methylation measurements have uncertainty, we want to reduce the uncertainty in our estimate ofπiby using many informa-tive genomic regions. We first select a set of genomic
regions where + and - methylation differs. We then find the optimal value ofπito explain the observed methylation for sampleiin these locations, as a function of our esti-mated means andπi, subject to the constraint thatπiis between 0 and 1. This procedure closely follows that pre-sented by Housemanet al.[19].
Selection of the genomic locations can be based on a variety of factors, such as the range of observed methyla-tion at these locamethyla-tions, the variance of the methylamethyla-tion estimates, and the length of the region of differential methylation. For our estimation, we chose the 500 geno-mic regions which were the strongest +vs. - DMR candi-dates in the brain region of interest in relation to the amount of methylation difference and the length of the region showing the methylation difference. We found that our results were quite robust to the number of regions selected, with 500 performing well.
To investigate whether it is absolutely necessary to have sorted data from a given brain region to estimate cell pro-portions in unsorted data from that region, we identified a set of‘universal’genomic regions. These universal regions had different NeuN+ and NeuN- methylation signals within a brain region, but showed consistent NeuN+ and NeuN- methylation levels across the three brain regions for which we had data (DLPFC, HF, and STG). Many of these +vs. - DMR candidates had consistent NeuN+ and NeuN- levels across brain regions, with 14% to 17% of the probes in the +vs. - DMRs belonging to genomic regions of consistent signal. We estimated the meansμin these regions of consistent signal using sorted data from DLPFC alone, and then performed cell fraction estimation in the unsorted samples from DLPFC, HF, and STG using these mean values. Since we do not know the true cell fractions in these unsorted samples, we used the estimates we had obtained for each brain region using the region-specific DMRs and mean values, as described above, as our gold standard.
All analysis was implemented in R (R Core Team, R: A Language and Environment for Statistical Computing. R Foundation for Statistical Computing: Vienna, Austria, 2012; [33]). The data discussed in this publication have been deposited in NCBI’s Gene Expression Omnibus and are accessible through GEO series accession num-ber GSE48610.
Effect of inaccurate mixture estimates
As previously described, failure to account for differences in cell-mixtures in our samples can lead to biased esti-mates of brain-region differences under the null hypoth-esis of no brain region difference. However, inaccurate mixture estimates can also lead to bias. For example, consider the methylation signal in samplei
Now suppose we have an inaccurate estimate of πi, calledπi∗, whereπi∗=πi+γi. Using this inaccurate
esti-mate gives us the following contribution to our regres-sion formulation from samplei:
β0+β1πi∗+β2Xi(1−πi∗) +β3Xi(πi∗=β0+β1(πi+γi) +β2Xi(1−πi+γi) +β3Xi(πi+γi)
=β0+β1γi+β1πi+β2Xi+ (β3−β2)Xiγi
=β0+β1γi+β1πi(1−πi) +β3Xiπi+ (β3−β2)Xi(ηi−πi)−(1−ηi)πi)
=β0+β1γi+β1πi+β2Xi(1−πi) +β3Xiπi+ (β3−β2)ηiXi(1−πi) + (β3−β2)(1−ηi)Xiπi
=β0+β1γi+β1πi+ (β2+ (β3−β2)ηi)Xi(1−πi) + (β3+ (β3−β2)(1−ηi))Xiπi
wherehiis between 0 and 1, and the third line follows
from the fact thatgimust be between−πiand1−πito
ensure thatπi∗is between 0 and 1. We can see that the coefficient of Xi(1−πi)is no longer measuring just the
quantity we are interested in (the difference between NeuN+ methylation in regions H and D), but it also has an additional factor related to the size of the estimation error, and similarly for the coefficient ofXiπi.
CHARM DNA methylation analysis
Genomic DNA was isolated from brains using the Master-pure kit from Epicentre, according to the manufacturer’s protocol. For genome-wide DNA methylation assessment, 1 ug of genomic DNA from each sample was digested, fractionated, labeled, and hybridized to a CHARM array as described [34,35] using a custom Nimblegen 2.1 million feature array assaying 5,114,655 CpG sites. We used the Bioconductor package‘charm’for sample preprocessing along with the package‘bumphunter’for DMR identifica-tion and permutaidentifica-tion computaidentifica-tion.
Human postmortem brain samples
Fluorescence-activated cell sorting was performed on fro-zen postmortem dorsolateral prefrontal cortex (n= 4), and hippocampal formation (n= 4) and superior temporal gyrus (n= 3) from individuals not affected with neurologi-cal or psychiatric disease. To validate the statistineurologi-cal model, we used nine additional healthy samples from the dorso-lateral prefrontal cortex. These samples underwent nuclei extraction and sorting as described below. The model was applied to additional unsorted control samples (19 samples from DLPFC, 13 samples from HF, 31 samples from STG) to deconvolve NeuN+ and NeuN- methylation signatures. All samples were obtained from the bank of the Center for Neurodegenerative Disease Research (CNDR) in the Department of Pathology and Laboratory Medicine at the University of Pennsylvania (directed by Dr John Q Troja-nowski, see Additional File 1, Tables S2-4 for demographic information).
Nuclei extraction, NeuN labeling, and sorting
Total nuclei were extracted via sucrose gradient centrifu-gation as previously described [25]. A total of 250 mg of frozen tissue per sample was homogenized in 5 mL of lysis buffer (0.32M sucrose, 10 mM Tris pH 8.0, 5 mM CaCl2, 3 mM Mg acetate, 1 mM DTT, 0.1 mM EDTA,
0.1% Triton X-100) by douncing 50 times in a 40-mL dounce homogenizer. Lysate was transferred to a 15 mL ultracentrifugation tube and 9 mL of sucrose solution (1.8 M sucrose, 10 mM Tris pH 8.0, 3 mM Mg acetate, 1 mM DTT) was pipetted to the bottom of the tube. The solution was then centrifuged at 27,000 rpm for 2.5 h at 4C (Beckman, L8-80 M; SW28.1 rotor). After centrifuga-tion, the supernatant was removed by aspiration and the nuclei pellet was resuspended in 500 uL of PBS.
The nuclei were incubated in a staining mix (0.71% normal goat serum, 0.036% BSA, 1:1200 anti-NeuN NeuN (Millipore, MAB377), 1:1400 Alexa647 goat anti-mouse secondary antibody (Invitrogen, 21236) for 45 min by rotating in the dark at 4°C. Unstained nuclei and nuclei stained with only secondary antibody served as negative controls. The fluorescent nuclei were run through a FACS machine with proper gate settings. A small portion of the NeuN+ and NeuN-nuclei were re-run on the FACS machine to validate the purity. Immu-nonegative (NeuN-) nuclei were collected in parallel. To pellet the sorted nuclei, 2 mL of sucrose solution, 50 uL of 1 M CaCl2, and 30 uL of Mg acetate were added to 10
mL of nuclei in PBS, incubated on ice for 15 min, then centrifuged at 3,000 rpm for 20 min. The nuclei pellet was resuspended in 10 mM Tris (pH 7.5), 4 mM MgCl2,
and 1 mM CaCl2. Fluorescent images were taken on a
Zeiss Axio Observer. Z1 microscope with a Plan-Apoc-hromat 100x/1.40 oil-immersion objective lens. Images were generated using an Axiocam MR3 microscope cam-era and Axiovision software (AxioVs40, version 4.8.2.0, Carl Zeiss, Inc). Images were processed using ImageJ.
Additional material
Additional file 1: Supplementary Information. A PDF file containing
Figures S1-4 and Tables S1-4.
Abbreviations
CHARM: comprehensive high-throughput arrays for relative methylation; DLPFC: dorsolateral prefrontal fortex; DMR: differentially methylated region; FACS: fluorescence-activated cell sorting; FDR: false discovery rate; HF: hippocampal formation; NeuN+: positive fraction; : NeuN-negative fraction; STG: superior temporal gyrus.
Competing interests
The authors declare that they have no competing interests.
Authors’contributions
paper. MAT conceived of the study, analyzed the data and developed the statistical method, and wrote the paper. APF conceived of the study. RAI analyzed data and developed the statistical method. WEK designed experiments. KT selected and acquired samples. REG selected and acquired samples. All authors read and approved the final manuscript.
Acknowledgements
All samples were obtained from the bank of the Center for Neurodegenerative Disease Research (CNDR) in the Department of Pathology and Laboratory Medicine at the University of Pennsylvania (directed by Dr John Q Trojanowski). This work was funded by NIH Grant U01 MH085270 to APF and CMM, Department of Defense (CDMRP) AR080125 to APF and WEK, and NIH Grant R01 GM083084 to RAI and MAT. The research reported in this publication was also supported by NIAMS Award Number P30AR053503. We would like to thank Joe Chrest for his expertise in cell sorting, Rakel Tryggvadottir for her assistance with sample hybridizations, and Romeo Papazyan for his help with fluorescence microscopy imaging.
Authors’details
1Medical Scientist Training Program, Johns Hopkins University School of
Medicine, 1830 E Monument Street, Baltimore, MD 21205, USA.2Predoctoral
Training Program in Human Genetics, McKusick-Nathans Institute of Genetic Medicine, Johns Hopkins University School of Medicine, 733 N Broadway, Baltimore, MD 21205, USA.3Dana Farber Cancer Institute, Department of Biostatistics and Computational Biology, 450 Brookline Avenue, Boston, MA 02215, USA.4Department of Neurology, Boston Children’s Hospital and Harvard Medical School, 300 Longwood Avenue, Boston, MA 02115, USA.
5
Department of Psychiatry, University of Pennsylvania, 3400 Spruce Street, Philadelphia, PA 19104, USA.6Center for Epigenetics, Johns Hopkins
University School of Medicine, 855 N Wolfe Street, Baltimore, MD 21205, USA.7Department of Biostatistics, Johns Hopkins Bloomberg School of
Public Health, 615 N Wolfe Street, Baltimore, MD 21205, USA.
Received: 7 March 2013 Revised: 11 June 2013 Accepted: 30 August 2013 Published: 30 August 2013
References
1. Feinberg AP:Phenotypic plasticity and the epigenetics of human disease.Nature2007,447:433-440.
2. Miller CA, Sweatt JD:Covalent modification of DNA regulates memory formation.Neuron2007,53:857-869.
3. Feng J, Zhou Y, Campbell SL, Le T, Li E, Sweatt JD, Silva AJ, Fan G:Dnmt1 and Dnmt3a maintain DNA methylation and regulate synaptic function in adult forebrain neurons.Nat Neurosci2010,13:423-430.
4. LaPlant Q, Vialou V, Covington HE, Dumitriu D, Feng J, Warren BL, Maze I, Dietz DM, Watts EL, Iniguez SD, Koo JW, Mouzon E, Renthal W, Hollis F, Wang H, Noonan MA, Ren Y, Eisch AJ, Bolanos CA, Kabbaj M, Xiao G, Neve RL, Hurd YL, Oosting RS, Fan G, Morrison JH, Nestrel EJ:Dnmt3a regulates emotional behavior and spine plasticity in the nucleus accumbens.Nat Neurosci2010,13:1137-1143.
5. Herb BR, Wolschin F, Hansen KD, Aryee MJ, Langmead B, Irizarry R, Amdam GV, Feinberg AP:Reversible switching between epigenetic states in honeybee behavioral subcastes.Nat Neurosci2012,15:1371-1373. 6. Hansen RS, Wijmenga C, Luo P, Stanek AM, Canfield TK, Weemaes CM,
Gartler SM:The DNMT3B DNA methyltransferase gene is mutated in the ICF immunodeficiency syndrome.Proc Natl Acad Sci USA1999,
96:14412-14417.
7. Amir RE, Van den Veyver IB, Wan M, Tran CQ, Francke U, Zoghbi HY:Rett syndrome is caused by mutations in X-linked MECP2, encoding methyl-CpG-binding protein 2.Nat Genet1999,23:185-188.
8. Kandel ER, Schwartz JH, Jessell TM:Principles of neural science.4 edition. New York: McGraw-Hill, Health Professions Division; 2000.
9. Hughes V:Microglia: The constant gardeners.Nature2012,485:570-572. 10. Iwamoto K, Bundo M, Ueda J, Oldham MC, Ukai W, Hashimoto E, Saito T, Geschwind DH, Kato T:Neurons show distinctive DNA methylation profile and higher interindividual variations compared with non-neurons. Genome Res2011,21:688-696.
11. Prinz M, Priller J, Sisodia SS, Ransohoff RM:Heterogeneity of CNS myeloid cells and their roles in neurodegeneration.Nat Neurosci2011,
14:1227-1235.
12. Grayson DR, Jia X, Chen Y, Sharma RP, Mitchell CP, Guidotti A, Costa E:
Reelin promoter hypermethylation in schizophrenia.Proc Natl Acad Sci USA2005,102:9341-9346.
13. Mill J, Tang T, Kaminsky Z, Khare T, Yazdanpanah S, Bouchard L, Jia P, Assadzadeh A, Flanagan J, Schumacher A, Wang SC, Petronis A:
Epigenomic profiling reveals DNA-methylation changes associated with major psychosis.Am J Hum Genet2008,82:696-711.
14. Sabunciyan S, Aryee MJ, Irizarry RA, Rongione M, Webster MJ, Kaufman WE, Murakami P, Lessard A, Yolken RH, Feinberg AP, Potash JB:Genome-wide DNA methylation scan in major depressive disorder.PLoS One2012,7: e34451.
15. Shen-Orr SS, Tibshirani R, Khatri P, Bodian DL, Staedtler F, Perry NM, Hastie T, Sarwal MM, Davis MM, Butte AJ:Cell type-specific gene expression differences in complex tissues.Nat Methods2010,7:287-289. 16. Gaujoux R, Seoighe C:Semi-supervised Nonnegative Matrix Factorization
for gene expression deconvolution: a case study.Infect Genet Evol2012,
12:913-921.
17. Gong T, Hartmann N, Kohane IS, Brinkmann V, Staedtler F, Letzkus M, Bongiovanni S, Szustakowski JD:Optimal deconvolution of transcriptional profiling data using quadratic programming with application to complex clinical blood samples.PLoS One2011,6:e27156.
18. Kuhn A, Thu D, Waldvogel HJ, Faull RL, Luthi-Carter R:Population-specific expression analysis (PSEA) reveals molecular changes in diseased brain. Nat Methods2011,8:945-947.
19. Houseman EA, Accomando WP, Koestler DC, Christensen BC, Marsit CJ, Nelson HH, Wiencke JK, Kelsey KT:DNA methylation arrays as surrogate measures of cell mixture distribution.BMC Bioinformatics2012,13:86. 20. Guintivano J, Aryee MJ, Kaminsky ZA:A cell epigenotype specific model
for the correction of brain cellular heterogeneity bias and its application to age, brain region and major depression.Epigenetics2013,8:290-302. 21. Liu Y, Aryee MJ, Padyukov L, Fallin MD, Hesselberg E, Runarsson A,
Reinius L, Acevedo N, Taub M, Ronninger M, Shchetynsky K, Scheynius A, Kere J, Alfredsson L, Klareskog L, Ekström TJ, Feinberg AP:Epigenome-wide association data implicate DNA methylation as an intermediary of genetic risk in rheumatoid arthritis.Nat Biotechnol2013,31:142-147. 22. Gu H, Bock C, Mikkelsen TS, Jager N, Smith ZD, Tomazou E, Gnirke A,
Lander ES, Meissner A:Genome-scale DNA methylation mapping of clinical samples at single-nucleotide resolution.Nat Methods2010,
7:133-136.
23. Irizarry RA, Ladd-Acosta C, Carvalho B, Wu H, Brandenburg SA, Jeddeloh JA, Wen B, Feinberg AP:Comprehensive high-throughput arrays for relative methylation (CHARM).Genome Res2008,18:780-790.
24. Mullen RJ, Buck CR, Smith AM:NeuN, a neuronal specific nuclear protein in vertebrates.Development1992,116:201-211.
25. Jiang Y, Matevossian A, Huang HS, Straubhaar J, Akbarian S:Isolation of neuronal chromatin from brain tissue.BMC Neurosci2008,9:42. 26. Ladd-Acosta C, Pevsner J, Sabunciyan S, Yolken RH, Webster MJ, Dinkins T,
Callinan PA, Fan JB, Potash JB, Feinberg AP:DNA methylation signatures within the human brain.Am J Hum Genet2007,81:1304-1315. 27. Gibbs JR, van der Brug MP, Hernandez DG, Traynor BJ, Nalls MA, Lai SL,
Arepalli S, Dillman A, Rafferty IP, Troncoso J, Johnson R, Zielke HR, Ferrucci L, Longo DL, Cookson MR, Singleton AB:Abundant quantitative trait loci exist for DNA methylation and gene expression in human brain.PLoS Genetics2010,6:e1000952.
28. Davies MN, Volta M, Pidsley R, Lunnon K, Dixit A, Lovestone S, Coarfa C, Harris RA, Milosavljevic A, Troakes C, Al-Sarraj S, Dobson R, Schalkwyk LC, Mill J:Functional annotation of the human brain methylome identifies tissue-specific epigenetic variation across brain and blood.Genome Biol 2012,13:R43.
29. Pardo LM, Rizzu P, Francescatto M, Vitezic M, Leday GG, Sanchez JS, Khamis A, Takahashi H, van de Berg WD, Medvedeva YA, van de Wiel MA, Daub CO, Carninci P, Heutink P:Regional differences in gene expression and promoter usage in aged human brains.Neurobiol Aging2013,
34:1825-1836.
30. Hannum G, Guinney J, Zhao L, Zhang L, Hughes G, Sadda S, Klotzle B, Bibikova M, Fan JB, Gao Y, Deconde R, Chen M, Rajapakse I, Friend S, Ideker T, Zhang K:Genome-wide methylation profiles reveal quantitative views of human aging rates.Mol Cell2013,49:359-367.
32. Day JJ, Sweatt JD:Epigenetic mechanisms in cognition.Neuron2011,
70:813-829.
33. , R. http://www.r-project.org/.
34. Jaffe AE, Murakami P, Lee H, Leek JT, Fallin MD, Feinberg AP, Irizarry RA:
Bump hunting to identify differentially methylated regions in epigenetic epidemiology studies.Int J Epidemiol2012,41:200-209.
35. Irizarry RA, Ladd-Acosta C, Wen B, Wu Z, Montano C, Onyango P, Cui H, Gabo K, Rongione M, Webster M, Ji H, Potash JB, Sabunciyan S, Feinberg AP:The human colon cancer methylome shows similar hypo-and hypermethylation at conserved tissue-specific CpG islhypo-and shores. Nat Genet2009,41:178-186.
doi:10.1186/gb-2013-14-8-r94
Cite this article as:Montañoet al.:Measuring cell-type specific differential methylation in human brain tissue.Genome Biology2013 14:R94.
Submit your next manuscript to BioMed Central and take full advantage of:
• Convenient online submission
• Thorough peer review
• No space constraints or color figure charges
• Immediate publication on acceptance
• Inclusion in PubMed, CAS, Scopus and Google Scholar
• Research which is freely available for redistribution