International Journal of Emerging Technology and Advanced Engineering
Website: www.ijetae.com (ISSN 2250-2459,ISO 9001:2008 Certified Journal, Volume 3, Issue 9, September 2013)
Images Segmentation Method Based on A Multi Scale
Analysis of 2D Histograms
YAZIDI AlAOUI Youssef
1, EZZINE Abdelhak
2 LABTIC, ENSA-TangerBP 1818, Tanger Principale Tanger 9900
Abstract---In this paper we propose an image segmentation method based on multi-scale analysis using wavelets, this method has been developed and adapted to detect road signs (road signs and traffic lights). It is an approach to highlight objects in a road scene especially objects corresponding to a road signs. It relies on the use of 2D histograms highlighting the different modes and based on operation of multi-scale representations of an image with an analysis with wavelets. That said the identification of colors with weak presence in the image as well as the relevant discrimination of different colors in the image, which discriminates objects of the same color visually.
Keywords--- wavelet transforms multi resolution, segmentation, 2D histogram.
I. INTRODUCTION
Several works propose different segmentation algorithms for color images. This works are based on the distribution, often probabilistic, of information in the image or based on the knowledge in front of the image [1, 2]. The results of different approaches are the identification of regions of the image spatially coherent as well as their content: methods of growth regions.
One of these categories is based on a classification that groups the pixels of the image, regarded as a statistical distribution, in classes of individuals. The histogram of the image is thus used as a tool to identify several characteristics of these classes. For color images, the choice of the representation of the histogram becomes very important and according to one method or another we may remove or highlight primitives of the image (rare objects present in the image) and then promote their detection.
From a statistical point of view, the pixels with very similar colors are grouped in the same region which indicates a region of very high values in the histogram and therefore the presence of a mode. Different methods of classification, so deal this area by translating it into a homogeneous region not necessarily related and it is from here that the difficulties begin. Indeed, highlighting or discernment of objects having grayscale close but not identical in the image becomes very difficult. This is proven by experience to the images in the intelligent driving domain, essentially images containing road signs.
The use of methods based on the use of the histogram in the case of detecting road signs is ineffective as a road sign (which is a small region) located next to a large homogeneous region (vehicle, tree, road, building or advertising panel) would rarely be restored [3,4]. Such difficulties, which we are confronted is heightened by the confusion of a share of road signs with other objects of the road and on the other hand the variation of chrominance and luminance settings panel which is due to exposure to natural factors such as the sun, weather or variable light.
To overcome this problem, we propose a method based on the use of 2D histograms in order to take into account the color. Also the choice of a suitable color space will allow easily solve problems highlighting both information chrominance and luminance. 2D histogram then considered as a 2D image processing by wavelet analysis, using essentially the detection of wavelet coefficients to distinguish the modes as much as possible. We managed to produce a method for detecting road signs and the first results are very satisfactory because the multi scale property of wavelet allows as controlling the difference of pixels values with a controlled precision and thus distinguishing between two objects in the image even when they have two colors close and ensure their presence in the image. Also, our approach has the advantage of considerably reducing the computation time results of the analysis of the histogram instead of analyzing the entire image.
II. PRELIMINARIES
A. Multi resolution and orthogonal wavelet transform
A multi-resolution analysis of consists of a
sequence of nested closed subspaces
International Journal of Emerging Technology and Advanced Engineering
Website: www.ijetae.com (ISSN 2250-2459,ISO 9001:2008 Certified Journal, Volume 3, Issue 9, September 2013)
302 (4)
There exists such that is
a base Riez of .
j is called the resolution and represents the level of
analysis of the function f; the approximation in of f
is twice as fine as in , but less good, twice that in
.
1) Detail space of wavelet :
The details are lost in passing a resolution j to a coarser resolution and more "smooth" j-1 are
high-frequency image components, we call the space containing these details:
Let the orthogonal complement of in :
, and
According to the definition of an AMR, we have
. With , (t) also belongs to ,
there exists then a sequence ) such that:
(( is an orthonormal base of ) This
relationship allows to build .
On the other hand : if is a function
of , there is a sequence ) such as:
This relationship and the previous are called tow scales relationships.
The simplest example to illustrate this concept is the multi-resolution analysis of Haar, which is simply an approximation of f by piecewise constant functions on intervals of length
In practice, signals and manipulated images are necessarily finite resolution. We assume that the 1D signal f to be analyzed is defined on [0, 1] and includes
points:
it is represented by a vector with coefficients in the basis of scalingfunctions of space.
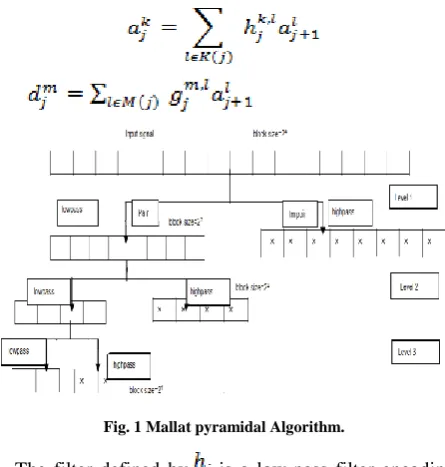
In the final case, the wavelet transforms amounts to a filtering or convolution [5]:
[image:2.595.319.542.320.554.2]Fig. 1 Mallat pyramidal Algorithm.
The filter defined by is a low-pass filter encoding signal approximations (low frequency).
The filter is defined by a high-pass filter encoding signal details (high frequencies).
B. Multi resolution and tow-dimensional wavelet transform
The general definition of a multi-resolution analysis of
is similar to that given in the one-dimensional
case. It suffices to consider functions with values in
International Journal of Emerging Technology and Advanced Engineering
Website: www.ijetae.com (ISSN 2250-2459,ISO 9001:2008 Certified Journal, Volume 3, Issue 9, September 2013)
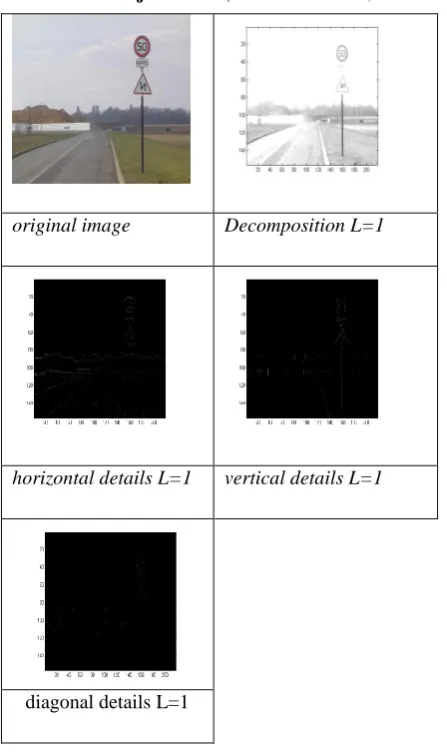
original image Decomposition L=1
horizontal details L=1 vertical details L=1
[image:3.595.54.278.128.506.2]diagonal details L=1
Fig 2 : Orthogonal wavelet transform of an image
Each approximation space is decomposed into a
coarser approximation space and 3 spaces of details. Consider the case of a square image, so a function defined on a square domain. A digital image has
a finite number of pixels. An image will be
considered as belonging to and decomposed into the
spaces ( , ) j=L...J-1 and in .
III. CALCULATING HISTOGRAM 2D
Among the various methods of color image segmentation, there are methods on a statistical approach which consists to highlight areas of the image by analyzing the color histogram.
We have several ways to use the histogram; the most natural of it is to consider a 3D histogram representing a cloud, in the coordinate system (XR, YG, ZB), such that each point of coordinates (xR, yG, zB) refers to the number of pixels of the image using the color (R, G, B).
Another way would be to consider three 1D histograms, for each color component. In this work, we use the concept of 2D histogram that expresses only two color components, which can be interpreted as a 2D projection of the 3D histogram in terms of two components. We have three 2D histograms, but we often operate only on tow, for example in the (L, a *, b *) system, we can use H2D (L, a) and H2D (L, b) for the detection of the presence of signs.
Several ways are possible to estimate the 2D histogram, the first and most obvious is to take into account only the two present components, and set the third to zero. This approach is ideal if the three components are highly uncorrelated, but this is not the case of color systems generally available. This has motivated us to lead our research for the construction of a suitable color space that has this decorrelation property. The second technique is a projection of 3D histogram on the plan of 2 components such as: If we denote 3D Histogram H (r, g, b) we calculating H2D (r0, g0) as the sum of H (r0, g0, b) for b = 0,.., L-1, if necessary by introducing as normalization parameter max (H (r0, g0, b)).
A 2D histogram of a color image I binds p (x1, x2), the number of pixels in the image I which represent the color component (x1, x2). Since each color axis is quantized to 256 levels, the histogram can be represented by an image J with a spatial resolution of 256 × 256 [9]. The pn(x1, x2) value of the pixel of coordinates (x1, x2) in J is obtained by a linear dynamic contraction of the
histogram between 1 and ,255).
With and are respectively the maximum and minimum values of P.
International Journal of Emerging Technology and Advanced Engineering
Website: www.ijetae.com (ISSN 2250-2459,ISO 9001:2008 Certified Journal, Volume 3, Issue 9, September 2013)
304
Image 1 and hist2D (R,B) Image 2 and hist2D (R,B)
[image:4.595.42.288.134.528.2]Image 3 and hist2D (R,B) Image 4 and hist2D (R,V)
Fig 3 : images (1, 2 , 3, 4) and their 2D histograms
IV. RESULTS
The first difficulties in the interpretation of the 2D histogram appear when there's presence of several identical panels as is the case of image 3; indeed the point clouds in the 2D histogram corresponding to the different panels containing the same color are more or less alike.
To work around this type of problem and highlight a difference between the panels we perform a multi-resolution analysis on the image of histogram by wavelet. Specifically we use the algorithm of Mallat, Zhong, [5] to be able to highlight the peaks in the 2D image histogram and have the opportunity to refine by changing scale.
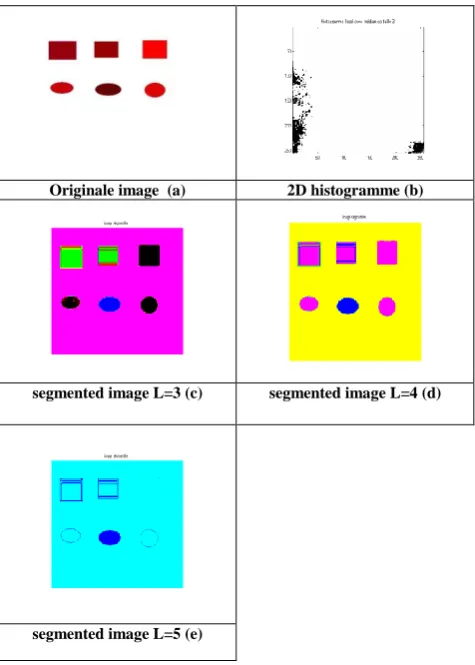
The figure below shows the result of segmentation of the image (a) with peaks extracted from the 2D histogram according to multi-resolution decompositions in levels 3, 4 and 5.
Originale image (a) 2D histogramme (b)
segmented image L=3 (c) segmented image L=4 (d)
segmented image L=5 (e)
[image:4.595.313.551.253.586.2]International Journal of Emerging Technology and Advanced Engineering
Website: www.ijetae.com (ISSN 2250-2459,ISO 9001:2008 Certified Journal, Volume 3, Issue 9, September 2013)
Original image (a) 2D histogram (b)
Segmented image L=3 (c) Segmented image L=4 (d)
[image:5.595.265.538.107.504.2]Segmented image L=5 (e)
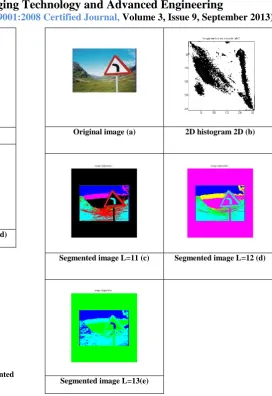
Fig 5 : Original image (a), the 2D histogram (b), (c, d, e) segmented images with levels decomposition (3, 4,5) respectively.
Original image (a) 2D histogram 2D (b)
Segmented image L=11 (c) Segmented image L=12 (d)
[image:5.595.61.281.117.471.2]Segmented image L=13(e)
International Journal of Emerging Technology and Advanced Engineering
Website: www.ijetae.com (ISSN 2250-2459,ISO 9001:2008 Certified Journal, Volume 3, Issue 9, September 2013)
306 V. CONCLUSIONS
We have developed an approach to segmentation of color images which is based on a multi-resolution analysis of the 2D histogram. The method was applied to a set of synthetic and real images to approve the performance of the segmentation algorithm. Also, the method has been particularly applied to the detection of road signs and the results are more satisfactory than those obtained using other segmentation algorithms especially those using 1D histograms.
REFERENCES
[1] J. Liu, Y.H. Yang, Multirésolution color image segmentation, IEEE Trans. PAMI., July, No. 16, 1999. pp 689-700.
[2] Ramana L. Rao and Lakshman Prasad, “Segmentation by Multiresolution Histogram Decomposition", citeseer.ist.psu.edu/rao95segmentation.html.
[3] CABANI I; TOULMINET G; BENSRHAIR A ” Color-based Detection of Vehicle Lights” IEEE Intelligent Vehicles Symposium, Las Vegas, USA Année:2005
[4] A.Ezzine & co Une nouvelle méthode de segmentation basée sur les ondelettes: application pour la détection des feux de stop d’un véhicule. Proceeding Optique 2006, INPT Rabat
[5] S. Mallat and S. Zhong, Wavelet transform maxima and multiscale edges, in Wavelets and Their Applications, G. Beylkin, R. Coifman, I.Daubechies, S. Mallat, Y. Meyer, L. Raphael,M. Ruskai (eds.), Cambridge, MA,
[6] Y. Meyer, Ondelettes et opérateurs I : ondelettes, Paris, Herman, 1990
[7] A.Ezzine, A. Cohen, Quadratures singulières et fonctions d'echelle", CRAS, t.323, Serie I, 829-834, 1996.
[8] I. Daubechies, “Ten lectures in wavelets”, Cbms-Nsf Regional Conference Series in Applied Mathematics, No 61