III. RESEARCH METHOD
This chapter discussed research design, population and sample, data collecting technique, data analysis, scoring criteria, try out of the test, validity and reliability the instrument and hypothesis testing.
3.1 Research Design
This research was quantitative research, it was focused on the product (result of the test) not the process of teaching learning and the objective was to find out the correlation between students schemata and their reading comprehension ability. In this research there was no control group and no treatment to the subject, thus ex-post facto design was used in this research.
Hatch and Farhady (1982: 26) state that ex-post facto design was often used when the researcher did not have control over the selection and manipulation of the independent variable.
This was why researcher looks at the type and/or degree of relationship between two variables
one, linear correlations. It was because linear correlation was the simplest kind of correlation to be found between two sets of scores or variables.
The correlation between two sets of measures of variables could be positive or negative. It was said to be positive when the independent variable increase, the dependent variable tended to increase too. On the opposite, it was negative when the independent variable increase, the independent variables tended to decrease. There was also possibility of third type of correlation i.e. zero correlation the two sets of measures of variables if there was no relationship between them (Singh, 2006: 304).
The sample of this research was only one group, the data taken by a schemata test and a reading comprehension test on the sample. It could be formulate as follow:
T1 T2
Where:
T1 : the test of schemata
T2 : the test of reading comprehension
3.2 Population and sample
The participant of this research was the first-year students of SMAN 2 Kotabumi of 2012/2013 school year. Nine first-year classes in this school, each of classes consist of 36 – 38 students.
3.2.2 Sample
The sample of this research was taken by using simple random sampling. Simple random sampling was used to choose which class would be taken as the participant, the name of each class was written on a piece of paper, and then the pieces were rolled and put in a box, the box was shaked and the piece that came out indicated the name of the class that was taken as the sample.
The researcher used simple random sampling class because each of the first-year students at the school has same opportunity to be a participant. From nine first year class in this school, each class consisted of 36-38 students; the researcher took class X.6 as tryout class and X.3 as sample class of this research.
3.3 Research Procedures
Procedures of this research carried out through several steps as follows:
In determining the problem, the researcher does pre-survey at SMAN 2 Kotabumi to investigate the students’ problem of reading skill.
2. Determining the sample of the research
The first year students’ of SMAN 2 Kotabumi consisted of nine classes, purposive
random sampling was used to determine the class that would be taken as the participants for this research. This technique was applied because each of the first-year students at the school had the same opportunity to be a participant.
3. Administering the try out
Before the instrument distributed, a try out was conducted to decide whether the instruments are good design. The try out test included 45 schemata test and 45 reading test. Class X.6 was taken as try out test class. The test was done to have a good quality if it has a good validity, reliability, level of difficulty and discrimination power.
4. Administering the test
The researcher held in three meeting. The first meeting was conducted to give a schemata story to students, the second day was conducted schemata test and the last meeting was used in reading comprehension test.
5. Analyzing the data
3.4 Data Collecting Techniques
In this research, to data collecting techniques was used: 1. Schemata test
There was 30 items for schemata test. The test was objective test. The test consisted of content schemata, formal schemata, and linguistic schemata. According to Aebersol and Field (1997: 16-17) mentioned there are three types of schemata, contents schemata, formal schemata, and linguistic schemata. From the statement the researcher will use 3 elements schemata to schemata test,
The scoring criterion was determined around 0-100, so that if student was able to answer all the items, they score was 100. In scoring students’ result of the could be seen as follow:
𝑆 = r
𝑛X 100
Where:
S : the score of the test
r : the total of the right answer n : the total items
There was 30 items for reading comprehension test. It was multiple choices with four options (a, b, c, d) with one correct answer and three distracters. The test consisted of five aspect of reading skills, they were: identifying specific information, determining main idea, inference, reference, vocabulary. The scoring was determined around 0-100, so that if a student was able to answered the entire test item, they score was 100. In scoring the students’ result of the test, the researcher used Arikunto’s formula (Aruikunto, 1997). The formula could be seen as follow:
𝑆 = r
𝑛 X 100
Where:
S : the score of the test
r : the total of the right answer n : the total items
3.5 Try Out of the Instrument
answers for each ( A, B, C, D ) . Based on the analysis, 14 item were not valid (appendix 4). These items were number 2, 5, 9, 12, 13, 17, 20, 21, 30, 33, 35, 38, 43, 45 were dropped and items number 22 were dropped to fix the items test became 30 question of schemata test. The reliability analysis of the try out test showed a good, rk = 0.9842 (appendix 6) in other words the test has very high
level of reliability.
Meanwhile, there were 45 items of measuring students’ reading comprehension.
Based on the analysis, 17 items were not valid (appendix 10). These items were number 3, 6, 10, 12, 13, 17, 21, 26, 31, 32, 33, 39, 40, 41, 43 was dropped and were number 38, 45 was revised to fix the items test became 30 question of reading comprehension test. In the reliability analysis, it showed the reliability rk
= 0.9832 (appendix 12). Based on the criteria of the test reliability, that point belonged to very high level.
The try out test was very important since a good test should meet the criteria in the term of level difficulty, discrimination power, reliability as well as validity, as they would be elaborated in the following section:
3.5.1. Validity of the Test
construct validity and empirical validity or criterion-related validity. To measure whether the test had good validity, content and construct validity.
The two types in this research were:
a. Content validity
Content validity refered to extent to which a test measure a representative sample the subject matter contents, the focus of the content validity was adequate of the sample and simply on the appearance of the test (Hatch and Farhady, 1982: 251). Content validity was intended to know whether the test items are good reflection of what would be covered. The test items were adapted from the materials that had been taught to the students should be constructed as to contain representative sample of the course (Heaton, 1975: 160).
To get the content validity, the items test was determined according to the material that has been thought students. The test items of schemata test made by the researcher based on 3 types of schemata that content schemata, formal schemata, and linguistic schemata. Before the researcher made schemata test the researcher was discuss the eligibility of schemata test with her lecturers. The items test of reading comprehension was based on KTSP curriculum of Senior High School.
b. Construct validity
the theory, meaning that the test construction has already in line with the objective of the learning (Hatch ad Farhady, 1982: 251). It meant that construct validity could be found by relating the instrument with the theory of what it meant to know certain knowledge skills. In this research, the researcher measured students’ schemata and their reading comprehension.
[image:9.595.108.510.638.750.2]Therefore the instrument for measure schemata would test which consist of content schemata, formal schemata and linguistic schemata. Then, the instrument for measure the reading comprehension would use comprehension test which consisted of identifying the specific information, determining the main idea, references, inferences and vocabulary were formulated in the test items.
Table 2. Specification of Try-out Schemata Test
No Types of schemata Items number Total Items
Percentage
1. Content Schemata 1,5,8,10,12,16,20,23,27,28,31,32,3 7,42,44
15 33, 3%
2. Formal Schemata 3,4,7,13,15,17,19,22,24,26,34,35,3 9,41,43
15 33,3%
3. Linguistic Schemata 2,6,9,11,14,18,21,25,29,30,33,36,3 8,40,45
15 33,3%
Total 45 100%
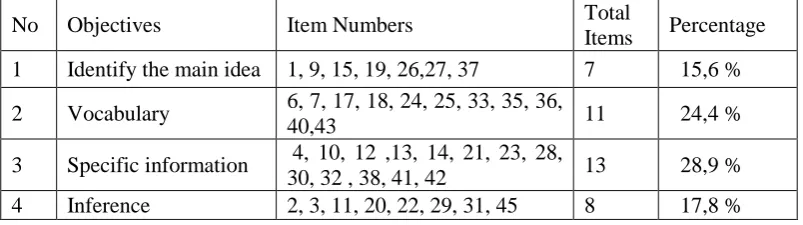
Table 3. Specification of Try-out Reading Comprehension Test
No Objectives Item Numbers Total
Items Percentage 1 Identify the main idea 1, 9, 15, 19, 26,27, 37 7 15,6 %
2 Vocabulary 6, 7, 17, 18, 24, 25, 33, 35, 36,
40,43 11 24,4 %
3 Specific information 4, 10, 12 ,13, 14, 21, 23, 28,
3.5.2. Reliability
Reliability refered to whether the test was consist in its scoring and gave us and indication of how accurate the test score are (Shohamy, 1985: 70). the researcher would use split-half method to estimate the reliability of the test. Hatch and Farhady (1982: 246) state that to use split half method, we first must split the test into similar parts. We correlated the scores of the students on the two halves of the test just if they were two separated test. If the items were homogenous, all odd number items become one half and even number items become the other half.
Split half technique was used in this the research to estimate the reliability between odd and even group, the researcher used the Person Product Moment formula as follow:
𝒓𝒍 = 𝒙𝒚 ( 𝟐) ( 𝟐)𝒙 𝒚
Where:
rl: Coefficient of reliability between odd and even numbers items.
x: Odd number.
y: Even number.
x2: Total score of odd number items.
y2: Total score of even number items.
5 Reference 5, 8, 16, 34, 39, 44 6 13,3 %
xy: Total number of odd and even numbers.
(Lado, 1961 in Hughes, 1991:32).
After getting the reliability of half test, the researcher then uses Spearman Brown’s Prophecy formula (Hatch and Fahady,1982: 246) to determine the
reliability of the whole test as follow:
r
k=
2rl
1 + 𝑟𝑙
Where:
r
k : the reliability of the whole testrl
: the reliability of half test(Hatch and Farhady, 1982: 247)
The criteria of reliability are:
0.80 – 1.00 : high.
0.50 – 0.79 : moderate.
0.00 – 0.49 : low.
The researcher found that the reliability of schemata test and reading comprehension were high 0.984 (on schemata test) and 0.983 (on reading comprehension) (see Appendix 6 and 12).
3.5.3. Level of Difficulty
Level of difficult relates to “how easy or difficult the item is from the point of
view of the students who took the test. It is important since the test items which are too easy (that all student get right) can tell us nothing about differences within the test population” (Shohamy, 1985: 79). Level of difficulty was calculated by using the following formula:
LD =𝑈 + 𝐿 𝑁
LD : level of difficulty
U : the number of upper group who answer correctly L : the number of lower group who answer correctly N : total number of student
The criteria are:
LD< 0.30 : hard 0.30<LD> 0.70 : average LD> 0.70 : easy
The researcher had found that were 8 items (17.8%) were hard, 26 items (57.8%) were average, and 11 items (24.4%) were easy in schemata try out test. Then in reading comprehension try out test, the researcher has found that there were 11 items (24.4%) were hard, 26 items (57.8) were average, and 8 items (17.8%) were easy.
3.5.4. Discrimination Power
Discrimination power refered to the extent to which the item differentiates between high and low level students on the test. A good item according to this criterion was “one in which good students did well, and bad students failed” (Shomany, 1985: 8). To calculate the discrimination power (DP) of the test items, the researcher used the following formula:
DP =𝑈 − 𝐿 1 2 𝑁
DP : discrimination Power
U : the proportion of upper group students
L : the proportion lower group students
N : total number of students
(Shohamy, 1985: 82)
The criteria are:
0.21 – 0.40 : Satisfactory
0.41 – 0.70 : Good
0.70 – 1.00 : Excellent
- (negative) : Bad items (should be omitted) (Heaton, 1975:182)
Based on the table and criteria on appendix 4 of schemata try out test, the researcher conclude that were 12 items were poor, 17 items were satisfactory, 13 items were good, 1 items were excellent and 1 item were bad.
Based on the table and criteria on Appendix 10 of reading comprehension try out, the researcher conclude that were 16 items were poor, 16 items were satisfactory, 11 items were good, and 1 items were bad.
After counting the level of difficulty and discrimination power of each item, the researcher found that 14 items could not meet the criteria of good test and should be dropped in schemata try out test. The items of schemata tryout test were numbers 2, 5, 9, 12, 13, 17, 20, 21, 30, 33, 35, 38, 43, 45 was dropped and items number 22 were dropped to fix items test became 30 questions of schemata test (Appendix 4).
dropped and were number 38, 45 was revised to fixed items test were 30 question of reading comprehension test (Appendix 10).
3.6 Data Analysis
After conducting the test, the researcher analyzed the data. It was used to know whether there was positive significant correlation between students’ schemata and their reading comprehension in narrative text. The researcher used SPSS 16.0 to analyze the data.
3.7 Hypothesis Testing
The hypotheses of this research were:
a. H0 = there is no correlation between students’ schemata and their reading
comprehension in narrative text.
b. H1 = there is a correlation between students’ schemata and their reading
comprehension in narrative text.
In order to prove the hypothesis of this research, the researcher was used the following steps:
a. Use Pearson Product Moment correlation (SPSS 16.0) in order to investigate the hypothesis
c. Determine the result of correlation in order to investigate the hypothesis. It is
achieved by comparing the result of
r
xywith the critical value of r in ther
table:1. if
r
xy ≥r
table it means that H1 is accepted and the null hypothesis (H0) isrejected. It means, there is a correlation between students’ schemata and their reading comprehension
2. if
r
xy ≤r
table it means that H1is rejected and the null hypothesis (H0) isaccepted. It means, there is no correlation between students’ schemata