2019 International Conference on Computer Intelligent Systems and Network Remote Control (CISNRC 2019) ISBN: 978-1-60595-651-0
Research on Building Energy Consumption
Prediction Method Based on LSTM Network
Pengcheng Zhao, Donglin Wang, Weiyan Li and Xuantao Zhang
ABSTRACT
Building energy consumption forecasting is of great significance to building energy conservation. The accuracy of traditional building energy consumption forecasting methods is inadequate. Based on the extensive application of LSTM neural network in time series forecasting, this paper uses LSTM neural network to establish building energy consumption forecasting model, collects energy consumption training data through building energy consumption monitoring system, and proves LSTM by comparing the forecasting effect of LSTM neural network and BP neural network. LSTM neural network is superior to BP neural network in convergence speed and prediction accuracy.
KEYWORDS
Building Energy Consumption Prediction, neural network, LSTM.
INTRODUCTION
Building energy consumption includes energy consumption in the whole process from the production and transportation of building materials to the construction, use, maintenance and demolition of buildings. Building energy consumption accounts for nearly 30% of the total energy consumption of commodities in our country. Energy consumption in building operation accounts for more than 80% of building energy consumption. Energy saving in building operation is the focus of building energy saving.
Accurate prediction of building energy consumption is of great significance to building energy conservation. It is mainly manifested in the following aspects: First, it is helpful to arrange power generation schemes reasonably and make the supply and demand of power grid balanced. Secondly, it helps to design green energy-saving buildings more reasonably. 3. By comparing the predicted value of energy consumption with the actual energy consumption, we can find abnormal energy consumption and unreasonable energy use habits, help managers to specify more effective energy-saving methods, and fully tap the energy-saving potential of buildings.
Engineering simplification algorithm is a traditional building energy consumption prediction algorithm, including the day-to-day method, equivalent full __________________________________________________________________
Pengcheng Zhao, Donglin Wang, Weiyan Li, Xuantao Zhang Tianjin Architectural Design Institute, Tianjin 300074, China
load operation method, effective heat transfer coefficient method and temperature-frequency method. According to the attributes of the building and the climate conditions of the building location, this kind of algorithm can calculate the results quickly, but it may produce large deviations. Statistical method for predicting building energy consumption is a method based on building energy consumption data set to correlate building energy consumption with building parameters by regression method. The most commonly used statistical method is multivariate regression method. This kind of method has fast computation speed, but the effectiveness of the method depends on the characteristics of the data set obtained. With the rise of artificial intelligence technology, artificial intelligence is gradually introduced into the field of building energy consumption prediction. In recent years, many scholars have used artificial intelligence and machine learning methods to predict building energy consumption and achieved results. Artificial Neural Network (ANN) is a hotspot of AI research. This method needs enough data to train the model and use the trained model to predict building energy consumption. Artificial neural network method has high prediction accuracy and fast calculation speed.
Taking an office building in North China as an example, this paper collects meteorological and energy consumption data, studies the method of predicting building energy consumption by artificial neural network, and verifies the predictive effect through experiments.
LSTM MODEL
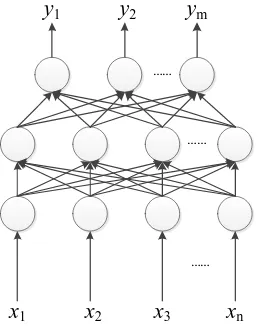
Neural network model is a typical artificial intelligence model. It simulates the working mechanism of the human brain. The parameters of each layer of neurons are trained by collecting samples, and the training is stopped when the set accuracy is reached. BP neural network is the most classical neural network model. The input-output layer and several hidden layers are established, and the model parameters are trained by error back propagation and gradient descent method. The structure of BP neural network is shown as follows in Figure 1.
x1 x2 x3 xn
…… …… ……
[image:2.612.234.363.532.695.2]y1 y2 ym
BP neural network is consists of input layer, hidden layer and output layer. The forward propagation of the signal obtains the output, and the error is compared with the expected output. The error is propagated backward. The weights and thresholds of neurons in each layer are adjusted by gradient descent method. However, BP neural network only considers the relationship between input and output at the current time, and lacks the correlation analysis of time series, resulting in inadequate prediction accuracy.
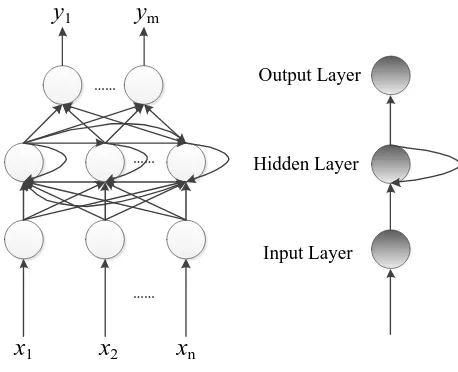
RNN (Recurrent NeuralNetwork), which considers not only the input and output of the current moment, but also the "memory" function of the network to the previous state. The input of the hidden layer includes not only the output of the input layer of the current moment, but also the output of the hidden layer of the previous moment. The structure diagram is as follows in Figure 2.
x1 x2 xn
…… …… y1 ym
……
Input Layer Hidden Layer
[image:3.612.189.418.256.442.2]Output Layer
Figure 2. The structure of RNN.
RNN neural network has some advantages in dealing with time series problems, but because of BP algorithm and long-term dependence, gradient disappearance or gradient explosion are easy to occur.
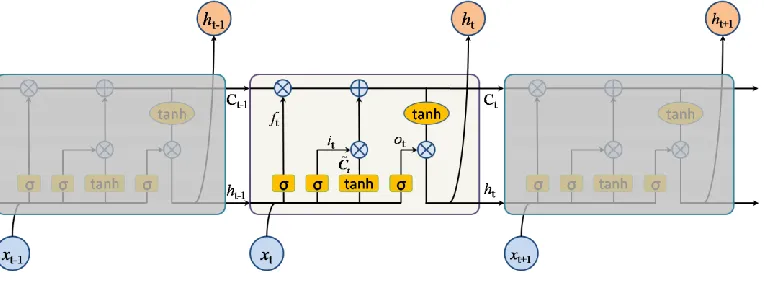
Figure 3. The structure of LSTM.
LSTM cells consist of input gate, output gate, renewal gate and amnesia gate. denotes the input at t time and Ct is the cell state, which is a parameter to
maintain memory function in LSTM network. htis the output value of the hidden
layer at time t. denotes SIGMOD function, ( ) 1 1 x
x e
,tanh denotes hyperbolic
tangent function, tanh
x x
x x e e x
e e
.There are other optional activation functions such as relu function.
The left-most layer is the forgetting gate layer, whose input is a and b, that is, the input data of the current moment and the output data of the previous moment. The coefficient of the [0,1] interval is calculated by SIGMOD function. 0 means that all the previous state information is discarded, and 1 means that all the previous state information is retained. The calculation formula is as follows:
1,
t f t t f
f W h x b (1)
In the middle is the input gate layer, which consists of two interactive gates. The first part is the same as the forgetting gate. The output of the first part is through SIGMOD function. The second part is to create a new candidate value vector through tanh function. The calculation formula is as follows.
1,
t i t t i
i W h x b (2)
1
tanh ,
t C t t C
C W h x b (3)
The main function of the regeneration portal layer is to regenerate the cell state. The calculation formula is as follows.
1
t t t t t
C f C i C (4)
1,
t o t t o
o W h x b (5)
tanh
t t t
h o C (6)
MODEL BUILDING AND TRAINING
This paper uses Python 3.6 language to program and Keras deep learning framework to build LSTM network model, which is trained in Windows 7 operating system.
Data preprocessing: In order to prevent the influence of different dimension data on the model, all data are standardized. This paper adopts min-max standardization method to standardize all data, that is, to standardize all data.
min max min nor
x
x
x
x
x
(7)min
x and xmax represent the minimum and maximum values of the sample respectively, and the processed sample values are within the interval [0,1].
After standardization, the data set is divided into training set and test set according to simple cross-validation method. The first 90% data is training set, which is used to train LSTM network, and the remaining 10% data is test set, which is used to test the prediction performance of LSTM network.The number of input layer and hidden layer units in LSTM network can be set by multiple experiments.
Prediction model error determination: root mean square error (RMSE) and mean relative error (MRE) are two kinds of error calculation methods. The calculation results are shown as follows.
2 1 1 ˆ ˆ ( , ) ( ) N i i i
RMSE y y y y
N
(8)1
ˆ 1
ˆ
( , ) 100%
N
i i
i i
y y
MRE y y
N y
(9)Among them, yis the actual value and ˆy is the predicted value.
LSTM model is trained by error back propagation method, and the weight is updated by gradient descent optimization algorithm. In order to prevent the model from over-fitting, regularization term is often added to the loss function to restrict the result. In this paper, the commonly used L2 regularization constraint is adopted,
2 2
2
L W where is the regularization coefficient, indicating the influence of
EXPERIMENTAL RESULTS AND ANALYSIS
Based on the daily total power consumption of an office building in the north of China, 1007 groups of daily total power consumption data of the building from June 25, 2016 to March 27, 2019 were collected. The daily meteorological data published by the meteorological website during this period include daily maximum and minimum temperature, wind speed and other meteorological data. All dates in this period are marked by working days and holidays, with working days of 1 and holidays of 0. The first 900 sets of data are used as training sets and the rest as test sets.
The selection of Super-parameters is mainly determined by many exploratory experiments. The influence of the number of hidden layer units on the test results is shown in Table I.
TABLE I. ERROR RATE COMPARISON OF DIFFERENT PREDICTION MODELS.
Model Average Error RMSE MRE
BP 592.23 760.32 17.08% LSTM 382.88 460.04 10.24%
[image:6.612.117.452.408.581.2]BP neural network and LSTM neural network are used to train the data set. The MRE value of BP neural network is 17.08%, while that of LSTM neural network is 10.24%. The error rate of LSTM is obviously better than that of traditional BP neural network.
Figure 4. The Predict diagram of LSTM vs BP.
CONCLUSION
consumption prediction using LSTM neural network is better than that of traditional BP neural network through experiments. Real-time energy consumption data can be obtained by energy consumption monitoring system. Training LSTM neural network with meteorological data can make the network dynamically adjusted, more accurately predict the near-term energy consumption, guide building operators to take reasonable energy-saving measures, correct unreasonable energy-using habits, and achieve the goal of building energy-saving and consumption-reducing.
ACKNOWLEDGMENTS
Corresponding author: Pengcheng Zhao.
This work was financially supported by Ministry of housing and urban rural development science and technology plan project, Project No., 2018-r1-013, project name, research on Key Technologies of green building operation performance dynamic evaluation system based on intelligent integrated platform and Tianjin Science and technology support key project, Project No., 17yfzcsf01280, project name, research and demonstration of key technologies for intelligent building heterogeneous data coupling analysis and optimized operation.
REFERENCES
1. Li Xiaolin, Wu Teng. Efficient network traffic prediction method based on PF-LSTM network [J/OL]. Application Research of Computers: 1-6[2019-05-05].
2. Zhang Yufan, Ai Qian, Lin Lin, Yuan Shuai, Li Zhaoyu. A Very Short-term Load Forecasting Method Based on Deep LSTM RNN at Zone Level [J/OL]. Power System Technology: 1-10[2019-05-05].
3. Zhao Chao, Lin Siming, Xu Qiaoling. College building energy consumption prediction based on GM-RBF neural network [J]. Journal of Nanjing University of Science and Technology, 2014, 38(01):48-53.
4. LI Jia-ling, Jiang Yan. Research on Prediction of Electricity Consumption of Public Buildings Based on BP Neural Network [J/OL]. Software Guide: 1-4[2019-05-05].
5. Zhao H X, Magoulès F. A review on the prediction of building energy consumption[J]. Renewable & Sustainable Energy Reviews, 2012, 16(6):3586-3592.
6. Cheng F, Xiao F U, Wang S. Development of prediction models for next-day building energy consumption and peak power demand using data mining techniques[J]. Applied Energy, 2014, 127(6):1-10.

![[The development of ethics. Identifying what training in medical ethics is needed by family physicians].](data:image/gif;base64,R0lGODlhAQABAIAAAP///wAAACH5BAEAAAAALAAAAAABAAEAAAICRAEAOw==)