Georgia State University Georgia State University
ScholarWorks @ Georgia State University
ScholarWorks @ Georgia State University
Geosciences Theses Department of Geosciences
Spring 5-10-2014
Authigenic Minerals: Locality 80, Bed I Tuffs, Olduvai Gorge,
Authigenic Minerals: Locality 80, Bed I Tuffs, Olduvai Gorge,
Tanzania
Tanzania
ROBERT E. JARRETT GEORGIA STATE UNIVESITY
Follow this and additional works at: https://scholarworks.gsu.edu/geosciences_theses
Recommended Citation Recommended Citation
JARRETT, ROBERT E., "Authigenic Minerals: Locality 80, Bed I Tuffs, Olduvai Gorge, Tanzania." Thesis, Georgia State University, 2014.
https://scholarworks.gsu.edu/geosciences_theses/75
Georgia State University
ScholarWorks @ Georgia State University
Geosciences Theses Department of Geosciences
5-10-2014
Authigenic Minerals: Locality 80, Bed I Tuffs,
Olduvai Gorge, Tanzania
Robert E. Jarrett
Georgia State University
Follow this and additional works at:http://scholarworks.gsu.edu/geosciences_theses
This Thesis is brought to you for free and open access by the Department of Geosciences at ScholarWorks @ Georgia State University. It has been accepted for inclusion in Geosciences Theses by an authorized administrator of ScholarWorks @ Georgia State University. For more information, please [email protected].
Recommended Citation
AUTHIGENIC MINERALS: LOCALITY 80, BED I TUFFS, OLDUVAI GORGE, TANZANIA
by
ROBERT E. JARRETT
Under the Direction of Daniel M. Deocampo
ABSTRACT
Understanding climatic and water-mineral chemistry affecting hominin habitats during
the period 1.92 to 1.80 Ma in Paleolake Olduvai basin, Tanzania is of social and scientific
interest. Previous Olduvai research reported climate cycles in bulk sample mineral analyses.
X-ray diffraction, X-X-ray fluorescence, and color analyses of Locality 80 Tuff Bed I samples tested
the null hypothesis: Alteration mineralogy of Central Basin volcanic Tuffs IA through IF reflect
salinity/alkalinity cycles. Such cyclicity was not found. Several primary authigenic minerals
were confirmed, but not as previously reported. Tuffs are thoroughly altered, mostly to
potassium-feldspars, zeolites, and carbonates, plus other feldspars and clay minerals (clays not in
this study). Nevertheless, other findings reveal there is more to be learned. Results imply a major
geochemical shift around 1.869-1.857 Ma, from non-zeolite forming environments to zeolite
forming environments. A newly developed age model could aid re-analysis of past work and
assist future research.
INDEX WORDS: Age model, Authigenesis, Bed I, Climate cycle, Paleolake Olduvai,
AUTHIGENIC MINERALS: LOCALITY 80, BED I TUFFS,
OLDUVAI GORGE, TANZANIA
by
ROBERT E. JARRETT
A Thesis Submitted in Partial Fulfillment of the Requirements for the Degree of
Master of Science
in the College of Arts and Sciences
Georgia State University
Copyright by Robert E Jarrett
AUTHIGENIC MINERALS: LOCALITY 80, BED I TUFFS, OLDUVAI GORGE,
TANZANIA
by
ROBERT E. JARRETT
Committee Chair: Daniel Michael Deocampo
Committee: W. Crawford Elliott
Lawrence M. Kiage
Electronic Version Approved:
Office of Graduate Studies
College of Arts and Sciences
Georgia State University
DEDICATION
ACKNOWLEDGEMENTS
Dr. Daniel. M. Deocampo, committee chair, my enthusiastic, patient, and knowledgeable
advisor and often amused bystander
Dr. W. Crawford Elliott, committee member, who helped me get into the program and
provided valued intellectual stimulation and knowledge these too many years
Dr. Lawrence Kiage, committee member, who courageously said “yes” without hesitation
and got me successfully started through a software thicket
Ms. Patricia Berry, project predecessor and initial information provider
Dr. Gail M. Ashley, author of many valuable articles, mentor to many on the road to full
understanding of Olduvai Gorge, and kind source of advice and information
Dr. Alan Deino, whose research and willing counsel freed me from a blind corner
Ms. Rebecca Pickering and Ms. Lucy Taylor, fellow students, for numerous timely assists
Ms. Basirat Lawal, Ms. Tia Williams, and Ms. Quen'Naldria Drake, administrative staff,
who catered to many needs
TABLE OF CONTENTS
ACKNOWLEDGEMENTS ... v
LIST OF TABLES ... x
LIST OF FIGURES ... xi
ABBREVIATIONS ... xii
1 INTRODUCTION ... 1
1.1 Significance ... 1
1.2 Purpose ... 1
1.3 Expected Results ... 1
1.4 Location ... 2
1.5 Physical Setting ... 3
1.6 Geology, Climate, and Hydrology ... 4
1.6.1 General ... 4
1.6.2 Geology ... 5
1.6.3 Climate ... 10
1.6.4 Hydrology ... 14
1.6.4.1 Surface Water ... 14
1.6.4.2 Groundwater ... 15
1.6.5 Authigenesis ... 16
1.6.6 Age Research and Modeling ... 21
2 METHODS ... 22
2.1 Samples ... 22
2.2.1 Preliminary Remarks ... 24
2.2.2 Age Model Detailed discussion ... 25
2.3 Analytical Methods ... 28
2.3.1 X-ray Diffraction (XRD) ... 28
2.3.2 Re-analysis of X-ray fluorescence (XRF) ... 30
2.3.3 Munsell Color Comparison ... 31
2.3.4 Statistical Analysis ... 31
3 RESULTS ... 32
3.1 Age Model Reconciliation ... 32
3.2 Tuff Mineralogy ... 33
3.2.1 X-ray Diffraction ... 33
3.2.2 Re-analysis of X-ray fluorescence (XRF)... 33
3.2.3 Combined Findings of XRD and XRF Analyses ... 40
3.2.4 Tuff Color ... 42
3.2.5 Statistical Analyses ... 43
4 DISCUSSION ... 45
4.1 Age Model ... 45
4.2 Tuff Mineralogy ... 46
4.2.1 X-ray Diffraction (XRD) ... 46
4.2.2 Combined Findings of XRD and XRF Analyses - Cyclic Relationship ... 47
4.2.3 Authigenesis ... 48
4.2.3.1 Authigenic Phillipsite and Sanidine Climate Cycle Proxies ... 48
4.2.3.3 Suite of Zeolites ... 50
4.2.4 Cation Oxide Comparisons ... 50
4.2.5 Tuff Color Analysis ... 52
4.2.6 Unanticipated Findings ... 52
4.2.6.1 1.869-1.857 Ma Authigenesis Transition ... 52
4.2.6.2 Potential Micro-cycles ... 53
4.2.6.3 Groundwater ... 53
4.3 Paleo-environmental Implications ... 54
4.4 Future Work ... 55
5 CONCLUSIONS ... 56
5.1 Age Model ... 56
5.2 Mineralogy ... 57
5.3 1.869-1.857 Ma Authigenesis ... 57
REFERENCES ... 59
APPENDICES ... 63
Appendix A: Berry (2012) XRF oxide data for Bed I Tuffs ... 63
Appendix B: Minerals cited in Olduvai Gorge literature ... 65
Appendix C: Age Model Development ... 67
Appendix C.1: Age Model: Summarized Results ... 67
Appendix C.2: Basic Stratichronology Ages ... 68
Appendix C.3: Deposit Age Reconciliation Computations ... 69
Appendix C.4: Sample Depth - Age Conversion Chart ... 73
Appendix E: Tuff Deposition History ... 75
Appendix F: Variations on Alkali Oxide Ratios vs. Ca/MgO ... 76
Appendix G: All Tuff Oxide Data for TriPlot - 25 Tuffs ... 77
Appendix H: Major Cations in Zeolites and Primary & Secondary Non-Zeolites ... 78
Appendix I: Tuff Age & Tuff Type vs. CaO/MgO Ratio ... 79
Appendix J: Tuff Age & Tuff Type vs. Al2O3/MgO Ratio ... 80
Appendix K. Cation Oxide Statistical Analysis ... 81
Appendix K.1 Variable Input Data ... 81
Appendix K.2 Correlation Contingency Table ... 81
LIST OF TABLES
Table 1 Comparison of wet and dry peak research ...10
Table 2 Bed I tuff ages and sedimentation rate multipliers ... 25
Table 3 Required stratigraphic data adjustments ... 26
Table 4 Possible intra-Bed I discontinuities ... 27
Table 5 Tabular age model and summary XRD output ... 34
LIST OF FIGURES
Figure 1 Continental and regional location ... 2
Figure 2 Local feature relationships ... 3
Figure 3 Loc 80 stratigraphic column and lithology of selected constituents ... 6
Figure 4 Schematic of Bed I on completion of Tuff IF at 1.803 Ma ... 7
Figure 5 Generalized map of the Olduvai Gorge locale ... 9
Figure 6 Olduvai and Ngorongoro area map ... 9
Figure 7 Paleolake Olduvai cycles: Five complete lake cycles are represented ... 13
Figure 8 Schematic cross-section showing presumed overall water flow ... 15
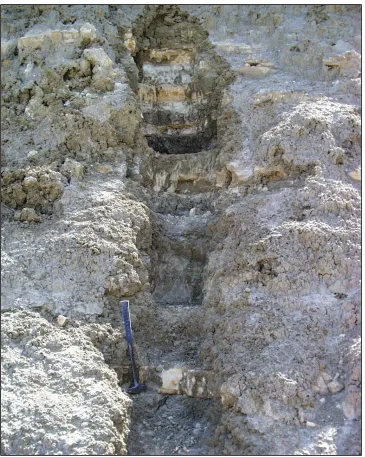
Figure 9 Locality 80 sampling trench ...23
Figure 10 XRD system with the sample loading on the reflection transmission spinner ... 29
Figure 11 Sample diffraction scan: Locality 80 Tuff ID sample GA-L-61-99, 1.839 Ma ... 30
Figure 12 Tuff deposition history related to Berry (2012) wet and dry cycles ... 36
Figure 13 Tuff (Na2O +K2O) vs. CaO/MgO ratios: Phillipsite vs. non-phillipsite regimes ... 37
Figure 14 Tuff (Na2O + K2O)%/MgO% vs. CaO%/MgO% ... 38
Figure 15 Triangular plot of tuff oxides ... 39
Figure 16 Major cations in zeolites and primary and secondary non-zeolite minerals ... 40
Figure 17 Tuff age & tuff type vs. CaO/MgO ratio ... 41
LIST OF ABBREVIATIONS
AFM Triangular diagram based on Na2O + K2O, FeO, and MgO content
Al Aluminum
Al2O3 Aluminum Oxide
amsl Above mean sea level
40
Ar/39Ar Ratio of Argon 40 / Argon 39 isotopes Avg. Average
Ca Calcium
CaO Calcium oxide
CB Central Basin
__-CO3 The designated carbonate
δD Ratio comparing deuterium content in hydrogen-isotope containing substances
Eh Oxidation-reduction potential (volts)
F Degrees of freedom in statistical analysis
K Potassium
K2O Potassium Oxide
K-spar Potassium feldspar
Ky Thousand years
Loc 80 Locality 80 Ma Million years ago
Mg Magnesium
MgO Magnesium Oxide
Na Sodium
Na2O Sodium Oxide
p Probability that a case falls outside the null hypothesis that populations are the same
pH -log10(H+)
r or R Correlation coefficient
r2 or R2 Coefficient of determination, r-squared; proportion of variance that is explained
SPSS Actual name of a specific proprietary statistical program
T Temperature
1. INTRODUCTION
1.1 Significance
Since Kattwinkel's 1911 discovery of extinct mammal fossils at the then newly found
Olduvai Gorge, Tanzania, further explored by Reck in 1913 while on a geological investigation,
and Leakey's recognition of artifacts among those bones in 1928, the search for and research on
genus Homo (hominins) began there and continues today (Hay, 1976; Dawson, 2008). Leakey
started onsite anthropological digs and analyses in 1931.
Interdisciplinary research in anthropology, archaeology, biology, climatology, geology,
limnology, and paleontology aims to trace the path of pre-human evolution at that site, through
studies of fossils, artifacts, life traces, faunal/floral variations, and age and climate indicators.
Olduvai Gorge is thus far one of the few places the human race might identify as its site of origin
on the way to becoming human then "modern". Time and climate are critical variables for these
investigations. Their definition is central to success in all facets. This study is focused on
conditions at and history of Bed I at Locality 80 (Loc 80).
1.2 Purpose
This work investigates the mineralogy of tuff deposits in Bed I. These data may be used
to test, in part, the hypothesis that climate cycles during the formation of Bed I sediments can be
discerned and exactly placed in time. They could then be used as proxies for surface water
quality and livability of the local environment.
1.3 Expected Results
Based on prior researchers' work described later, the hypothesis is: X-ray diffraction
analysis of the tuffs will confirm that lakebed sediment mineralogies can be correlated to cycles
environments (and will be temporally distinctive) when compared to cycles of wettest-climate,
relatively larger, less concentrated paleolake Olduvai environments. That is, results will show the
same cyclicity found by other work and perhaps sharpen cycle duration and / or intensity
estimates leading to identification of causes or explanations for this cyclicity.
1.4 Location
Olduvai Gorge is part of the Ngorongoro Conservation Area, Ngorongoro Division, of
Arusha Region in the northeastern corner of Tanzania. The main and side gorge floors of
Olduvai Gorge, Tanzania meet at coordinates 35° 21.193'E and 2° 59.459'S, elevation 1411 m
amsl (Google Earth, 2014).
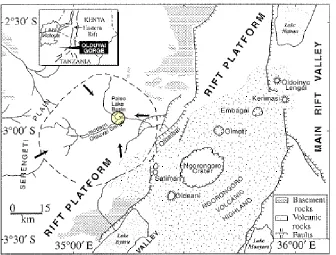
[image:17.612.168.445.316.651.2]N
The approximate center of fossil hominin finds is at the juncture of seasonal streams in
the Main and Side Gorges (yellow circle on Figure 2), which is about 30 Km northwest of the
[image:18.612.140.476.152.407.2]center of Ngorongoro volcanic crater.
Figure 2 Local feature relationships
Pleistocene sedimentary rocks constitute the bulk of uncoded land surfaces (After Berry, 2012; after Ashley, 2007; after Hay, R.L. and Kyser T.K., 2001)
1.5 Physical Setting
The Gorge is incised approximately 100 m into the eastern side of Serengeti Plain with
large, extinct volcanoes to the southeast and east and active Oldoinyo Lengai to the
east-northeast. Locality 80, source of samples for this study, is on the north side of the Main Gorge at
approximately 35° 18.664'E and 2° 57.793'S and slightly northwest of the stream juncture (Hay,
1976; Ashley et al., 1999; Google Earth, 2014). Regional drainage is from the west and east
toward the Olbalbal depression, a fault graben-formed depression primarily composed of
volcanic alluvial deposits with an ephemeral lake / wetland. Olbalbal is a modern surface and
ephemeral wetland serves the same regional closed-basin purpose to collect and concentrate
surface and groundwater and their dissolved salts as Paleolake Olduvai once did, although it is
much smaller. The Gorge formed from 400 Ka (Hay, 1976) until 50-30 Ka (Leakey et al., 1972;
Sinclair et al., 2009; Zimmermann, 2013). Paleolake Olduvai drained, as the result of erosion
promoted by the progressive subsidence of a series of grabens to the east. Hay (1976) wrote that
tectonic activity lowered Lake Olduvai to the east beginning at or near the end of Bed II
deposition. Stollhofen and Stanistreet (2012) concluded that most faults were active throughout
the times of greatest deposition. They assert the lake (sump) had completely vacated the Central
Basin (CB), the typically low-level closed-basin body size, by the start of the Masek period.
1.6 Geology, Climate, and Hydrology
1.6.1 General
From west to east, Olduvai Basin sedimentary deposits are neighbored and underlain by
Precambrian metamorphic rocks, punctuated by inselbergs of metamorphic rocks, and bordered
on the east by two million year old Pliocene-Pleistocene to Holocene volcanic deposits (Hay,
1976; Ashley et al., 2010b). These deposits include not only volcanic calderas but complex
layering of ashes and lavas, alluvial materials from several sources, and, quite significantly,
those materials after alteration by a wide range of mutually confounding physical, chemical, and
biological processes. As seen in Figure 2, roughly parallel normal faults associated with rifting
cross the area. The region's geologic and biological history has been strongly influenced by
Gregory East Africa Rift Zone processes. It is a region of rift extension, graben faulting, and
subsidence (Hay, 1976). As a result, groundwater composition and flow are likely to have been
and still remain complex. Baker (1986) describes a roughly analogous rifting, graben-forming,
gave rise to an inner graben and hypersaline Lakes Natron and Magadi, as well as lesser lakes. In
both regions, faults and grabens in concert with arid climates produced closed, sediment-filled
basins where saline / alkaline lakes occurred.
1.6.2 Geology
Cenozoic crystalline metamorphic rocks comprise the basement, western neighboring
watershed regions, and local outcrops. Pliocene-Pleistocene deposits up to 100 m thick fill a
basin some 25 km in diameter (Hay, 1976). Those deposits include volcanic tuffs, detrital
siliciclastics from the west, detrital volcanics carried by runoff from all directions, authigenic
products of those materials, biotic residues, and fossils.
Collapse of Ngorongoro volcano to form a caldera around 2 Ma essentially set the stage
for the region today (Hay 1976), having covered the future lake's basin bottom of crystalline rock
with the Naabi ignimbrite upon which alluvium deposited. Then began the deposition and
authigenesis of major successions; i.e., Beds I, II, III, IV, Masek, Ndutu, Naisiusiu, and
Namorod. These beds were named and criteria refined based on occurrence of volcanic "marker
beds" that could be traced over most of the basin. Eruptions of at least Ngorongoro and Olmoti
deposited eolian and pyroclastic tuffs into what is believed to have been a shallow lake during
Bed I formation, the first of the eight beds. Important Bed I marker tuffs are IA, IB, IC, ID, IE,
and IF. These and un-named tuffs appearing at Loc 80 are the combined focus of this study.
Figure 3 by Hay and Kyser (2001), though addressing mineral content of claystones rather than
tuffs, provides a succinct picture of the stacking of tuff and non-tuff beds at Loc 80 relevant to
Figure 3 Loc 80 stratigraphic column and lithology of selected constituents
The geological significance of Loc 80 derives from its: a) stratigraphic column
completeness (all Beds I through Ndutu) and b) Bed I's almost complete coverage of the entire
basin as a marker. Additionally, the oldest hominin fossils and artifacts (Oldowan culture) were
found from just below Tuff IB to the top of Tuff IF at other locations in Olduvai Gorge (top of
Bed I) (Hay, 1976). A critical attribute of Loc 80 was its location in the Central Basin (CB).
Except for any periods of complete playa conditions the CB at Loc 80 was wet until the lake
finally drained.
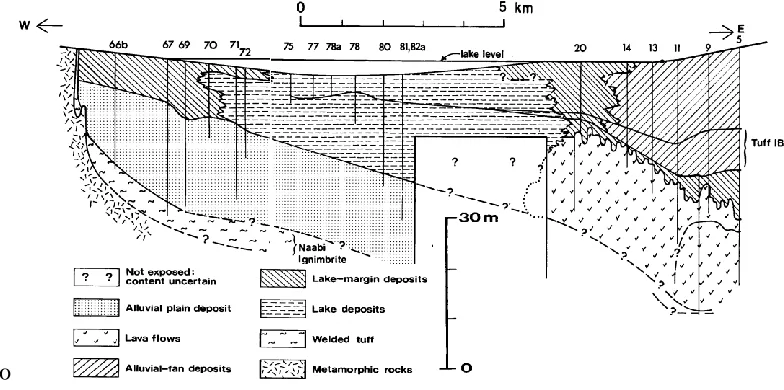
Hay goes on to describe Bed I as composed of these depositional environments:
lacustrine, lake margin, alluvial fan, alluvial plain, and lava flow (Figure 4). The latter is found
east of Paleolake Olduvai and is of no consequence to this study. These facies are interlayered.
Their respective chemistries, together with evolving water quality conditions, apparently resulted
in major authigenic changes in the original sediment mineral suites.
[image:22.612.111.503.419.614.2]to
Figure 4 Schematic of Bed I on completion of Tuff IF at 1.803 Ma
Volcanic vents opened by tectonic extension periodically added ash and lava to the
landscape. Tuff deposits were dispersed laterally over wide areas (Sikes and Ashley, 2007).
Surface deposits (other than older crystalline outcrops) comprise Pliocene-Pleistocene-Holocene
sequences of terrigenous eolian, volcanic-eolian, volcanic, fluvial, alluvial, and lacustrine
sediments the older of which are lithified. Figures 5 and 6 below, though partially duplicative of
preceding figures, include different elements. Figure 5 best portrays Paleolake Olduvai at high,
mid, and lowstands, It likely was never more than a few meters deep, at its deepest. Gradual
infilling of the basin would have contributed to lateral expansions recorded in the rock record.
Olbalbal distal and proximal (to extinct volcanoes Lemagrut and Olmoti) alluvial fans, was a
paleo-wetland near the Gorge junction, and ephemeral water courses. The distal fan hosts the
ephemeral Lake Olbalbal depression. Figure 6 adds Locality 80 and a few other investigation
sites, a box encompassing the highest interest anthropological sites, and key faults including
Olbalbal fault (which hosts the current depression for water accumulation in a seasonal lake near
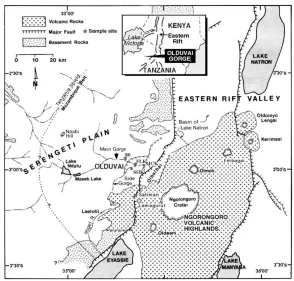
Figure 5 Generalized map of the Olduvai Gorge locale
Three hypothesized lake levels (dark blue = lowest; lightest blue = highest; likely never more than a few meters deep) and details of the Olbalbal distal and proximal alluvial fans receiving mountain and gorge runoff are seen. (Ashley et al. 2010a) "Contracted Lake" is used by some writers to signify the Central Basin (CB).
Figure 6 Olduvai and Ngorongoro area map
[image:24.612.158.452.392.673.2]1.6.3 Climate
Understanding climate in general, as a source of water, is crucial to understanding roles
of authigenesis and its resulting mineral products on measured time scales. The authigenic
minerals can often be used as proxies to estimate specific climatic and habitability conditions at
given places and points in time. Ashley et al. (2010a) state there is consensus that climate drying
occurred through the past 7 million years. That might be the general trend, but Potts (2013) pulls
together the many facets of East African climate during the Plio-Pleistocene period of Olduvai
Gorge history, including analysis of Earth orbital eccentricity, obliquity, and precession. He
concludes that despite mathematical regularity and demonstrable inter-play of these
Milankovitch cycles with other known climatic variables, there was much room for climatic
variability, some of it abrupt. He identifies 1.89 to 1.69 Ma as one of the 200 ky high variability
periods. It encompasses deposition of eight of this study's Bed I Tuffs GA-L-126-99 through IF.
He goes on, saying that both aridity and high moisture times occurred during high variability
periods.
Today the entire gorge and ancient lake area and semi-arid Serengeti Plain receive about
566 mm of rain per year (Cerling and Hay, 1986). Modern eastern highlands receive 1037 mm/yr
(mean for 1987-1994) on the southwestern rim (Deocampo, 2004b). Ashley et al. (2010b)
explain that with evaporation in the 2000-2500 mm/yr range, few permanent rivers and, by
extension, lakes can exist in that region of Kenya and Tanzania. As can be seen from the maps,
surface flows can arrive from the west and east, but their rain-fed ephemeral nature and high
evaporation rates argue against high rates of fluvial sediment transport, except during infrequent
flash flood conditions. They further explain that a large rain shadow of the Ngorongoro
being laid down. Hay (1976) gives a height of 3000 m vs. 1360-1520 m for the Serengeti Plain.
Ashley et al. (2014) cite Nicholson (1996) and Trauth et al. (2007) to the effect that today's
easterly Indian Ocean weather patterns prevailed or were similar in Paleolake Olduvai times.
That would mean paleo-conditions were similar to the following. Annual mean temperatures for
one composite 12-month year drawn from 1972 and 1973 were minimum, 16.3°C and maximum,
29.3°C (Hay, 1976). The monthly low mean was July, 15.6°C with a monthly high mean in
September at 30.7°C. This information suggests that temperatures would have been similar to
those at many modern closed-basin lakes.
Deocampo (2004a) proposed the possibility of higher than Milankovitch frequencies in
climate change. deMenocal (1995) studied eolian dust, biogenic opal, and organic carbon in
marine sediments along with Earth precessional cycles to explore climate variability in Africa.
Intervals of climate instability found by deMenocal around 2.8 and 1.7 Ma are both outside this
study's focus of 1.920 to 1.800 Ma. In a time of general stability, orbitally and precessionaly
driven climate cycles should be easier to note than during the unstable preceding and succeeding
periods. Stability is defined by fairly close adherence to Milankovitch cycles, as opposed to
shorter-term responses to variables, such as "high latitude temperature changes".
Analysis of orbital cycles led Ashley (2007) (summarized with other's findings in Table1)
to conclude that dry / wet peaks could have occurred in the latter half of this current study of Bed
I. Ashley used an age model bounded by 1.845 Ma for Tuff IB (Blumenshine, 2003) and cited
McHenry's (2005) 1.79 Ma for Tuff IF. Magill et al. (2013a) studied leaf lipid carbon and total
carbon isotope ratios from lake margin sediments that suggested lake contractions and wet
periods. They did not specifically state whether there was lake expansion or only a higher
inferred a lake minimum and two maxima. They also inferred that ancient rainfall was in the
250-700 mm/yr range, as it currently is. It is unclear exactly what age model (in relation to Loc
80 depths) Magill et al. employed; therefore, unknown differences between models will prevent
building a concordance of earlier findings and those of this study. The 1.79 Ma age for Tuff IF
was revised backward with close tolerances to 1.803 +/- 0.002 Ma by Deino (2012), which raises
questions about the ages in Table 1 based on Tuff IF being as young as 1.79 Ma. Results read
[image:27.612.82.530.289.545.2]from Berry (Figure 19, 2012) are included for comparison.
Table 1 Comparison of wet and dry peak research
Ashley (2007) Magill et al. (2013a) Magill et al. (2013b) Berry (2012)
Dry Wet Dry Wet Dry Wet Dry Wet
1.782 1.79
1.80 1.801
1.81 1.807 1.812
1.82 1.820 1.819 1.820
1.83 1.831
1.835
1.84 1.840 1.843 1.839
1.847
1.854 1.855
1.863
1.876 1.907
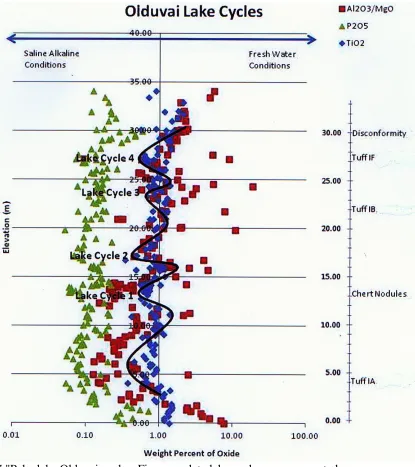
Berry (2012) reported higher resolution XRF-based geochemical interpretations of Bed I
samples (clays and tuffs) deposited during times of both high salinity/alkalinity and relatively
dilute conditions than did Hay and Kyser (2001), with agreement on most, but not all,
occurrences of climatic wet-dry cycles. Berry's XRF data demonstrated five dry (lake
Figure 7 "Paleolake Olduvai cycles: Five complete lake cycles are represented
Major oxide analysis demonstrates four major lake cycles. Each lake cycle begins and ends with a saline alkaline or dry phase. The Hay and Kyser (2001) sedimentation rates for age
[image:28.612.110.525.70.537.2]In 1997, Bond et al. proposed, on the basis of marine core analyses, that the Holocene has
experienced a series of 1470 +/- 500 yr. climate cycles in the North Atlantic. Gupta et al. (2003)
further demonstrated evidence that southwestern Indian Ocean Monsoons responded to those
climatic events.
1.6.4 Hydrology
1.6.4.1 Surface Water
As described in detail by Hay (1976) and since expanded upon by numerous researchers,
including citations above, fluvial deposits, buried lateral fluvial channels, detrital sediment,
surface topography, and discontinuities in CB deposits speak to a history of surface water
additions to Paleolake Olduvai and erosion of its bed, when precipitation generated flowing
water. "Rainy" periods would have seen occasional rapid level rises, but these rises would have
been modest in the context of a constantly arid to semi-arid environment, as now seen for
ephemeral Lake Olbalbal. Depending on conditions in the western, Precambrian uplands, there
might or might not have been perennial stream flow at some times. If so, it was insufficient to
keep CB levels high and waters dilute and overflowing out of the basin. Surface meteoric water
contains low levels of chemical species dissolved from soils, rocks, biota (alive and dead), and
the air that accumulate in hydraulically closed basins. The salts concentrate there from
evaporation (Boggs, 2012). In any case, rainwater would have changed lake composition on both
short and long temporal scales both by transport of salts to the basin and dilution of
evaporatively concentrated water.
Referral to Figure 8 visually assists in grasping details of subsequent text on surface
Figure 8 Schematic cross-section showing presumed overall water flow (Sikes and Ashley, 2007)
Earlier remarks spoke of tectonic lowering of the highly faulted eastern end of the basin
through rifting, and the faults being active throughout sediment deposition (Stollhofen and
Stanistreet, 2012). Key implications of the tilting would have been that western water had
progressively easier access to the basin and that faults were and continued to be high
permeability conduits (to be addressed under Groundwater). Eventually, the gorge developed and
water flowed through to help form Lake Olbalbal in the then and now low-lying distal (from the
volcanoes) alluvial fan.
1.6.4.2 Groundwater
Groundwater moves through volcanic cone deposits of the Ngorongoro highlands (3000
m) to emerge where faults, aquitards, aquicludes, and lowest depressions support springs and
seeps (Deocampo, 2004b; Hay, 1976; Stollhofen and Stanistreet, 2012). Deocampo gives
chemically verified Olmoti water contributions to Ngorongoro as evidence. Ashley et al. (2010b)
describe finding spring tufa (carbonate deposits) physically associated with fossil hominin sites
in upper Bed I. They cite similar geological and flow models delivering modern surface and
subsurface Olmoti flows to the southeast and southwest to lakes Manyara and Eyasi where
vegetation thrives (Ashley et al., 2010a). One might raise the objection that groundwater would
have had to flow up-gradient westward to Lake Olduvai across uptilted graben block scarps. That
incision began (0.4 Ma) long after Bed I formed. Faults and permeable deposits could have
delivered water westward to the lake margins and basin.
1.6.5 Authigenesis
Authigenesis is formation of minerals in situ by precipitation from water or after the
protoliths' original placement (Bates and Jackson, 1984). It can also refer to direct precipitation
from water. The search for authigenic, geochemical clues linked to climate and time are central
elements for determining when and how hominins lived at Olduvai Gorge. How and when
minerals currently found with fossils and artifacts formed inform reconstructions of habitat
livability. In the Olduvai context, chemical authigenesis and differential precipitation could be
mutually confounding in the record.
Eugster and Jones (1979) and Deocampo and Jones (2014) succinctly state mechanisms
by which saline lakes (like modern Magadi and, by analogy, ancient Olduvai) evolve their
characteristic solute suites. Evaporation causes concentration resulting in precipitation
fractionation of solutes, sorption and exchange of active species like K+ and SO4-2, and
degassing: "The cationic evolution toward sodium dominance is caused mainly by precipitation
of alkaline earth carbonates, gypsum, and Mg-silicates, whereas the anionic evolution away from
bicarbonate dominance is related to precipitation of carbonates and sulfates coupled with
degassing, sorption, and bacterial reduction of sulfates." They report Lake Magadi Na / K cation
fractionating at as high a proportion as Na:K::1:100.
Bed I tuffs are no longer the pristine volcanic glasses and other minerals that originally
fell into CB water (Deocampo, 2004a; Hay, 1976; Hay and Kyser, 2001; McHenry, 2009). Hay
(1963) wrote:
Tanganyika. Nephelinite tuffs were altered to form a surface calcrete and the minerals phillipsite, natrolite, chabazite, analcime, and dawsonite; sodic trachyte tuffs were altered to form phillipsite, erionite, and chabazite. Zeolites and calcrete were also formed at the land surface in the Olduvai region during two dry
episodes of the Pleistocene before the gorge was eroded. Zeolites and dawsonite were formed by reaction of volcanic glass and nepheline with solutions of sodium carbonate and bicarbonate that were concentrated by evaporation in the soil and surface layers of rock. Hydration and carbonation appear to be the principal chemical changes in zeolitic alteration.
A key significance lies in the short time required for those reactions to happen to trachyte tuffs.
A large body of literature lists many authigenic minerals identified in Olduvai Bed I tuffs and
conclusions that K-rich minerals and zeolites formed during dry climatic periods when Paleolake
Olduvai Central Basin is believed to have become highly saline and alkaline. Larsen (2008)
reported a literature consensus that zeolites (analcime, chabazite, and phillipsite among them) are
common authigenic products of vitric tuff reactions with saline/alkaline waters, and that
K-feldspars are common secondary authigenic products in similar environments with zeolites being
the critical K source. Waters high in alkali element ions (especially K and Na) and in bicarbonate
alkalinity react with volcanic glasses comprising tuffs to produce a range of minerals including
structurally porous aluminosilicates (zeolites) and, or in turn, the other minerals listed in
Appendix B, "Minerals cited". McHenry (2009) found phillipsite and chabazite "dominating"
proximal lake margin sediments and phillipsite in the intermittently dry lake deposits. Regarding
zeolite and K-spar authigeneses, Hay and Kyser (2001, their Figure 10) determined lake water
salinity, when Tuff IA deposited, only modestly above geological average (slightly dilute,
relatively speaking) from 1.924 Ma to 1.863 Ma on their date model; therefore, not “fresh” in
common terms. They suggested more extreme peaks of both salinity and dilution at other times.
Hay (1963) cited Di Piazza et al.'s (1959) 64-day experiments in sealed bombs with
trachyte and nepheline at accelerated, simulated current Olduvai conditions of 95-100°C and
carbonate [Na2CO3] solution (pH 10.3) and less easily (10%), but well, in dissolved trona
[Na3(CO3)(HCO3)•2H2O] (pH 12.3). He stated that zeolites form in Olduvai soils in preference
to clays. At that time was he unaware of zeolites forming on arid lands and above the water table.
He posited that: 1) zeolites should be ubiquitous in arid / semi-arid climates in saline / alkaline
environments and 2) and could simultaneously form where calcrete forms. By 1964, Hay
remarked that tuffs could form phillipsite in a few hundred years with total alteration in
thousands. Optimum conditions would be pH >9 and ratios of 10 < Na / K < 50 (may be
interpreted as 0.10 > K / Na > 0.02). Hay (1963) remarks that phillipsites in Olduvai Bed V
completely formed in the past 8,000-20,000 years, as a further basis for claiming fast formation.
Among associated authigenic minerals are: analcime, K-spar, and dawsonite. He further reports
weathering hydrolysis experiments with rhyolite tuff glass and dissolved Na2(CO3) at
concentrations of 20%, 10%, and 5%. They produced phillipsite >> analcime, phillipsite >>
chabazite, and phillipsite only, respectively.
References citing association affinity of phillipsite with K-feldspars include, among
others: Hay (1963, 1964 and 1970), Larsen (2008), and Sheppard and Gude (1968). Hay (1970)
provides two likely reactions:
Trachyte glass + H2O ---> Phillipsite
and
NaO0.55 K0.45AlSi2.7O7.4 • 2.3H2O + 0.3SiO2 + 0.55K ---> KAlSi3O8 + 0.55Na + 2.3H2O
phillipsite K-spar
Baur and Fischer (2002) list three ammonium phillipsites in their compendium of
zeolites: (NH4)3.40Na0.40 · Al3.80Si12.16O32 · 7.8H2O; (NH4)4.40Na0.20 · Al4.41Si11.60O32 · 8.1H2O;
and (NH4)5.04Na0.60 · Al5.90Si10.00O32 · 9.1H2O. Gottardi and Galli, cited in Jakkula (2005),
> Ca ~ Na ~ Sr. Dwairi (1998) found that a Jordanian phillipsite exhibited consistently higher
selectivity for NH4 than for Na at three isotherms, 20, 35, and 50°C, though decreasing
somewhat with rising temperature. He found that his results matched the work of other
researchers. The lower end of the temperature range to be expected at Olduvai Gorge would fit in
Jakkula's lower experimental range and cooler, where NH4 exchange is most enhanced over Na.
Deocampo (2004b) states that regional, modern, saline / alkaline lakes have Na+ and
CO3-2 dominating as Ca+2 and Mg+2 are removed by mineral precipitation, while SO4-2 and Cl
-proportionally increase with loss of the carbonate ion. The fate of carbonate ions in soil depends
on a number of factors, foremost among which are concentration and system pH. Carbonate
anions form from atmospheric, organic, and inorganic origin CO2 and water reactions. Sikes and
Ashley (2007) summarize literature regarding pedogenic CaCO3 and relate it to Bed I Tuffs IB
through IF. It typically arises from cation reactions with carbonate anions and migrates
downward with natural water percolation. Supersaturation resulting from evapotranspiration
results in precipitation of crystalline carbonates in the unsaturated zone. It can also form and be
transported in groundwater and cycle vertically with water table level changes (normal
downward eluviation plus upward migration). This can lead to precipitation in the capillary
fringe, as the water table responds to rainfall and piezometric surface movement. They refer to
meters-thick calcrete deposits.
Studying zeolites at Hay's (1976) Locality 45 in the southeastern portion of the Paleolake
Olduvai Basin, Mees et al. (2005) state, "Phillipsite formed at a later stage, from more evolved
solutions, with higher K/Na ratios than during chabazite formation." They assert that water
composition affected zeolite mineralogy variability. They further say that early diagenesis of Bed
deposition and shortly thereafter. Then pore water was replaced by higher K/Na ratio pore water.
(Lower Na / K water in Hay's (1963) terminology above.) Their article states that
analcime-dominated systems followed by high Na systems are often indicative of lateral phenomena.
(Interpreted as extensive, alternate wetting and drying of low slope margins with modestly
changing water levels.) They report this effect to have been abrupt at Olduvai, rather than
resulting from gradual water composition changes.
Jones et al. (1977) remark that most East African basins simultaneously produce clays,
Ca and Mg mineral precipitates, alkali carbonate, chloride, and maybe sulfate brines, but
chemical reduction removes SO4-2. If sulfate was reduced, NH4 could have been produced from
organic materials above and below tuffs. They also differentiate five stages of concentration
factors: "dilute streamflow" (1), "dilute ground water" (28), "saline ground water (or hot spring
reservoir)" (870), "saturated brines" (7600), and "residual brines" (16,000). These reflect
existence of a very wide range of solution ionic strengths for driving a variety of authigenic
reaction combinations. These could be reasonable analogs for conditions in this study's
timeframe. Their modern dilute streams in the Lake Magadi area have total dissolved solids
concentrations in the order of 67-384 mg/l, and all but one dilute ground water have 152-922
mg/l; fairly common worldwide values. Warm and hot lake spring concentrations ranged from
10,000 to 38,000 mg/l. Main Lake Magadi brines, in today's dry period, ranged 78,000-124,000
mg/l. Borehole brines were a bit lower, but similar. The point is "dilute" and "strong" are quite
relative terms. As a point of reference, modern seawater has on the order of 35,000 mg/l total
dissolved solids.
Triangular diagrams are common for portraying relationships between compositions of
study of sedimentary rocks, warn that one cannot assume close correlation for evaluating
sediments' original magmas. However, this study will use the basic technique, but for other
purposes and other component species in doing tuff analyses. Additional observations used
Munsell soil color charts to see if there might be useful color signals regarding tuff composition.
Hay (1976) and Hay and Kyser (2001) recorded sediment colors but did not mention specific use
of color standards.
1.6.6 Age Research and Modeling
A century of research on Olduvai Gorge has been generating a body of literature
containing many age models for placing studies in parallel. They often mismatch. For work at
Loc 80 alone, many publications contain age scales, others use depth of samples from the bottom
of Bed 1 Tuff IA datum upwards, and some use both to aid visualization and correlation with
other studies. With passage of time, new age measurements have become available, so there is
drift in the meaningfulness of each age model. Therefore, this review will not attempt to analyze
that rich literature. Berry's work, upon which this research builds, used a model primarily
matched to depths keyed to Hay and Kyser (2001) for Tuffs IA, IB, and IF and to their non-tuff
sedimentation rates of 1 m = 5900 yr for Bed 1 units 1 and 2 and 1 m = 8300 yr for Bed 1units 3
and 4 from paleomagnetic stratigraphy in which the Olduvai "normal" subchron lies. Deino
(2012) produced new 40Ar/39Ar radiogenic dating of Olduvai sediments, revising and refining
several ages and confidence limits. His work facilitated the age model construction for this work.
Owing to an accident of timing, Berry (2012) had to use literature values that did not quite fit
Deino's new age anchor points and conclusions for reconciling others' age values. Appendix C
contains four sub-appendices: age model summary data and results, basis for computations,
One issue in building a timescale to fit a large number of sample depths is the need to
account for the sedimentation intervals required for accumulation of naturally compacted
non-tuff deposits between non-tuffs. Another is that there are several unnamed non-tuffs to be accounted for.
More details will be presented under Methods. Deino provided estimates of new sedimentation
rates: Tuff IA-IB, 22 cm/ky; Tuff IB-IE, 11 cm/ky; and IE-IF, 9 cm/ky.
Critical other information from two unpublished documents: Photocopy of typed sample
number / depth tabulation for 1999 Olduvai stratigraphic column (Ashley, undated); and
Photocopy of unpublished, annotated Olduvai Gorge Locality 80 Bed I field note stratigraphic
column (Ashley, et al., 1999).
2. METHODS
2.1 Samples
Tuff deposit samples for analysis were collected as splits from larger samples taken at
Locality 80, Olduvai Gorge, Tanzania by Gail M. Ashley (Rutgers University), Richard L. Hay
(University of Arizona), Robin Renaut (University of Saskatchewan), and Godwin Mollel
(Rutgers University) in 1999 and archived by Dr. Daniel M. Deocampo at Georgia State
University with the same label designations (GA-L-_No._ -99), where they have been used in
Figure 9 Portion of the Loc 80 30 m high sampling trench (Ashley, 1999)
The original total body of samples numbered 179 of which 25 are Bed I tuffs studied for
this report. Table 3 (Results) gives sample numbers and elevations above the Bed I Tuff IA base,
as the datum (smallest numerical value is the oldest, deepest below ground surface). Current
sample holdings consist of 167 labeled, bagged chunks and vials of powders previously prepared
by Berry (2012) for X-ray fluorescence (XRF) analysis. Some samples are not represented in this
All bulk samples have been air-drying for over a decade in zip-closure plastic bags. Most
powdered samples had been further air-dried during mortar and pestle grinding and storage for
1-2 years. Some additional powders were ground from original samples or reground by mortar and
pestle to obtain adequate quantities and to ensure sufficient grain size reduction and mixing for
XRD analysis.
2.2 Age Model
2.2.1 Preliminary Remarks
A new age model was developed for this work, because: 1) Deino (2012) published new
40
Ar/39Ar analyses and age arguments superseding those in prior literature, 2) the literature is not
consistent in using either sample ages or depths to portray results, and 3) it was not possible to
fully validate and compare the depth/age models others had used for the same stratigraphic
column. A new model was developed in an attempt to put the data in one internally consistent
form. Appendix C.4 is a plot of Depth vs. Age for specific use with Locality 80 samples.
However, the ages picked from that chart could be used with the original stratigraphic column to
assign ages to corresponding tuffs, clays, and other sediments identified in that column originally
constructed by Ashley, et al. (1999)
Berry (2012) used an age model that depended upon older radiometric and
magnetochronology data and their resulting sedimentation rates for periods between tuff
depositions. Table 2 summarizes Deino's (2012) results used in this study, with comparative
notes. Appendices C.2 and C.3 give a complete display of the computation process generating
Table 2 Bed I tuff ages and sedimentation rate multipliers (Deino, 2012)
Tuff Age (Ma) or Sed.
Rate
Range (Ma) Notes Other
Sources
Tuff IA Consensus value =
1.920 1.918 = Deino measured 1 1.92; falls in error range
IA to IB Sed. rate 22 cm/ky Non-tuffs 1 17 cm/ky
Tuff IB 1.848 +/- 0.003
IB to IE sed. rate 11 cm/ky Non-tuffs
Tuff IC
Tuff ID 1.839 +/- 0.011 Interpolation
using sed. rate 11 cm/ky
Tuff IE 1.831 +/- 0.004
IE to IF sed. rate 9 cm/ky Non-tuffs 1 12 cm/ky
Tuff IF 1.803 +/- 0.002
1
Hay and Kyser (2001)
For comparison, one Bubnoff Unit of erosion or deposition = 10 Ky/cm (Bates and
Jackson, 1984)
2.2.2 Age Model Detailed Discussion
Age computation for samples not assessed by Deino was difficult owing to the following
factors. The primary issue was that the stratigraphic column is of necessity broken into separate
segments by the specific tuffs he analyzed. That required use of three empirical depositional
rates to interpolate sample-depths / ages for non-tuff lacustrine and eolian sediments. Those
graphically estimated rates had to be subjected to forward and backward iterative computations
to check for consistency with deposits' physical relationships. A number of primary depth
measures in the stratigraphic column did not match the Ashley (1999) typed tabulation,
suggesting possible transcription errors. All depths were re-scaled and revisions used in cases of
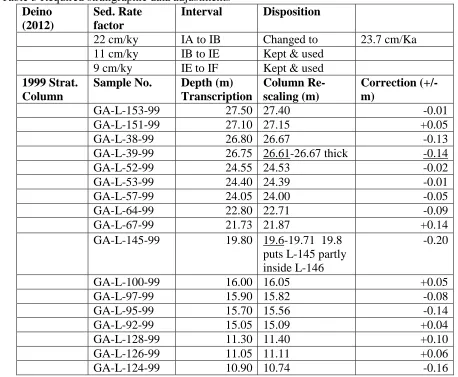
Table 3 Required stratigraphic data adjustments Deino
(2012)
Sed. Rate factor
Interval Disposition
22 cm/ky IA to IB Changed to 23.7 cm/Ka 11 cm/ky IB to IE Kept & used
9 cm/ky IE to IF Kept & used 1999 Strat.
Column
Sample No. Depth (m)
Transcription
Column Re-scaling (m)
Correction (+/- m)
GA-L-153-99 27.50 27.40 -0.01
GA-L-151-99 27.10 27.15 +0.05
GA-L-38-99 26.80 26.67 -0.13
GA-L-39-99 26.75 26.61-26.67 thick -0.14
GA-L-52-99 24.55 24.53 -0.02
GA-L-53-99 24.40 24.39 -0.01
GA-L-57-99 24.05 24.00 -0.05
GA-L-64-99 22.80 22.71 -0.09
GA-L-67-99 21.73 21.87 +0.14
GA-L-145-99 19.80 19.6-19.71 19.8 puts L-145 partly inside L-146
-0.20
GA-L-100-99 16.00 16.05 +0.05
GA-L-97-99 15.90 15.82 -0.08
GA-L-95-99 15.70 15.56 -0.14
GA-L-92-99 15.05 15.09 +0.04
GA-L-128-99 11.30 11.40 +0.10
GA-L-126-99 11.05 11.11 +0.06
GA-L-124-99 10.90 10.74 -0.16
A false sense of precision and accuracy had to be accepted for practical purposes.
Achieving a logical, relatively smooth curve of depth vs. age (Appendix C.4) required using an
inappropriately large number of significant places (four) in computations. Significant figure
sensitivity tests led to two other adjustments to make the depth vs. date curve functional. First,
despite normally observed restrictions, using three decimal places (when only one or two were
mathematically appropriate) separated many sample points that would have obscured each other
contrary to physical reality. For the graph, three sets of tuff samples, each having the same
computed dates for the set, could be and were represented by only the most appropriate one
only 19 of the 25 tuff samples. This technique prevented EXCEL from making meaningless
stepwise twitches in the curve, which would have subverted the sedimentation rate factors and
made the curve useless for converting between depths and ages.
Tuffs IC?, ID?, and IE vitric? were used as labeled in spite of the ?-marks on the
field-note stratigraphic column, because their sequence and spacings matched.
Deino's tuff ages formed the basis of an EXCEL spreadsheet filled-in to include all Bed I
tuffs from elevations above datum of 3.20 to 27.40 m (IA-IF) labeled in the stratigraphic column
(Ashley et al., 1999). According to standard practice, any given tuff was assumed to have
accumulated instantaneously regardless of thickness. All other sediments were assumed to
accumulate at one of three rates defined by Tuffs IA to IB (23.7 cm/ky), IB to IE-vitric (11
cm/ky) and IE-vitric to IF (9 cm/ky). See Results, Age model for justifications. In the absence of
more detail, five instances on the stratigraphic column of wavy and dotted lines indicating
probable discontinuities had to be disregarded, assumed as trivial in time (Table 4). Sample
GA-L-64-99 was a tuff for which thickness was assumed irrelevant according to the zero-duration
[image:42.612.122.492.514.629.2]criterion.
Table 4 Possible intra-Bed I discontinuities
Related Sample Number
Approximate Depth, m
Age, Ma Maximum Amplitude, m
GA-L-26-99, top 5.2 1.915
GA-L-121-99, top 10.1 1.896
GA-L-122-99, top 10.4 1.894
GA-L-81-99, top 13.9 1.879 0.13
GA-L-64-99, top 22.95 1.842 Tuff blocks
possibly re-worked
The closure criterion was tested and accomplished by computing from the two
Whenever possible (most cases) each computed age was independently calculated from a
specific, Deino (2012) dated tuff; i.e., IA, IB, ID, IE, or IF. That forestalled cumulative errors
that would have arisen from serially calculating ages one from the other.
"What if" computation checks and sequence logic ruled out some incorrect possibilities
and led to discovery of the noted anomalies in originally-typed tabulated depths; e.g., tuff sample
GA-L-145-99 cannot lie partially within non-tuff sample GA-L-146-99, and seven beds were
listed as much as 1 to 2.0 decimeters too thin or thick. Ages computed to compensate for those
anomalies dramatically smoothed the otherwise choppy depth vs. age correspondence curve (see
Results). That curve can be used to assign ages to non-tuff beds. These improvements were
accomplished simply by careful selection of computation origins, error correction, and sensitivity
verification with due diligence to let numbers fall where they naturally would, not by force
fitting or selective data-point choice.
2.3 Analytical Methods
2.3.1 X-ray diffraction (XRD)
XRD analysis determined the primary and second-rank minerals present in Bed I tuffs.
The equipment used was a PANalytical X’Pert Pro X-ray diffraction unit with CuKα1 radiation
with a wavelength of 1.5406 Å, operating at 45 Kv, 40 mA, and fitted with a reflection
transmission spinner. Sample vials were shaken and rotated several times in all three axes to
remix the material after storage and handling. Sample holder rings were inverted on a deeply
scored glass plate (to ensure a random reflection powder exposure), almost filled with
free-poured sample powders, and gently "closed" by placement of the inverted holder base on top.
The entire assembly was then carefully lifted without sliding the parts and returned to the upright
the plate moved in handling, the sample was returned to its vial for re-mixing and re-sampling.
Figure 10 shows the system with a sample in-process. Diffraction scans were about 15 minutes at
[image:44.612.94.518.152.470.2]“normal” resolution (0.001°, stepwise). Samples were scanned from 2-Theta = 5°-60°.
Figure 10 XRD system with the sample loading on the reflection transmission spinner
This data set comprises 25 samples. Four additional tuffs identified on the field
stratigraphic column could not be represented, because no samples exist: 8.83 m, no name / no
sample; 8.97 m, no name / no sample; 20.64 m, L-150-99, no sample; and 27.20 m,
GA-L152-99, no sample.
Analysis used PANalytical Data Collector, DataView and HighScore Plus software to
record, access, and manipulate diffraction data. HighScore used software-produced scores to
identify the predominant minerals in samples. However, it was also usually necessary to do
always identical to the algorithm's criteria. Results reported are the software-identified candidate
minerals that satisfied the most chart peaks with the fewest minerals (Ockham’s razor principle).
Some XRD peaks went unused, rather than force minerals to fit when using them led to
obviously strange choices for the geochemical situation. Figure 11 illustrates how XRD peaks for
sample GA-L-61-99 were "optimized" to a minimum of most prominent minerals. In this case,
[image:45.612.72.540.235.515.2]very few, minor peaks were not assigned to a mineral by HighScore after sensitivity trials.
Figure 11 Sample diffraction scan: Locality 80 Tuff ID sample GA-L-61-99, 1.839 Ma
2.3.2 Re-analysis of X-ray fluorescence (XRF) Data
Berry's (2012) XRF data for oxides (Appendix A) were processed to plot binary and
triangular relationships for the tuffs in this study for comparison with XRD findings. Some
groupings had to be re-normed to 100% from Berry's data for the various oxide and oxide ratio
2.3.3 Munsell Color Comparison
Powdered samples were viewed with a fresh (purchased 2013) Munsell Soil Color Chart
book (2009). Colors were examined in natural, northern exposure light and recorded for
comparison with XRD and XRF data. Schaetzl (2005) provides instructions on reading and
interpreting colors. Given the age of Loc 80 samples and their long desiccation in storage, the
recommendation that readings be taken at "soil-moist conditions" could not be followed.
2.3.4 Statistical Analysis
SPSS Version 19 (2010) examined possible dichotomous distributions, a relationship first
noticed in color assessment data then in XRD analyses. Dichotomous discriminant analyses were
performed in listwise and stepwise modes for SiO2, Al2O3, MgO, CaO, Na2O, K2O, and
(Na2O+K2O) around an age gap, 1.869 to 1.857 Ma defined by a subjectively noted change in
mineral authigenesis. "Dichotomous discriminant" relates to classifying a total population into
two groups for comparison to estimate whether a hypothesized commonality exists or not
(Agresti, 1996). This technique can test whether preconceived non-metric groups are distinct for
a particular "categorical dependent variable" considering all of the independent variables. It was
desired to know whether two distinct groups might exist, based on constituent cations as
predictor variables. The test can be run in listwise and stepwise modes. Listwise mode analyses
the entire data set in search of grouping. Stepwise mode selects the most correlated independent
variable, computes its contribution to categorization / classification of the sample group
members, and works progressively through the remaining input variables to determine which
contribute most to predicting the dependent variable. These tests are suitable for small sample
3. RESULTS
3.1 Age Model Reconciliation
Tuff depth-age Appendix C provides a graphical scaffold for estimating other ages
according to depth, specifically at Loc 80, and possibly extendable to the same beds at other
locations. Properly addressing realities of sample collecting and of recently augmented,
re-analyzed, and summarized geochronological knowledge (Deino, 2012) was complex and time
consuming. In testing proposed non-tuff sedimentation rate factors, it verified two and modified
a third. And, it revealed inconsistent sample depth reports for correction. The sampling depth vs.
conversion age curve, Appendix C.4 is imperfect, with some wobbles. One would expect to see
straightness, when using three line segment slopes, but the imperfections reflect the discipline
applied to extrapolating away from the firmest ages in toward each other, not to force fit points
to lines drawn between firm end-dates. The rather good closure of those extrapolations within the
respective data intervals suggests that the results are fairly reliable, as no effort was made to
make things fit, per se. That is, numbers were not rounded, tweaked, or discarded to achieve a
"desirable" outcome. Rather, iterative computation checks and crosschecks, chronology logic
checks, and data error corrections progressively cleansed the data and process. Deino (2012)
proposed a sedimentation factor of 22 and latter suggested trying 23 cm/ky (Deino, 2013) for the
interval Tuff IA to IB. The value 23.7 cm/ky worked better. Trial calculations above and below
23.7 cm/Ka at 23.6 and 23.8 resulted in distortions, but further, micro adjustments in a second
3.2 Tuff Mineralogy
3.2.1 X-ray Diffraction (XRD)
Mineralogical findings comprising Table 5 below are the central summary of outcomes
for this project and for understanding results and discussions that follow. Calcium and
magnesium-bearing minerals (Table 5) dominated tuffs deposited from 1.920 Ma until 1.893 Ma.
At that point XRD outputs show authigenesis of high-K minerals starting early, from 1.891 Ma
through Bed I until 1.803 Ma, a period of almost 90,000 years. An overlapping period of high-Ca
and Mg-bearing mineral deposition occurred from 1.891 Ma to 1.869 Ma. Na-rich minerals
appear as primary and second rank minerals at odd points along the entire timeline. Phillipsite is
not seen as a major first or second rank mineral through 1.869 Ma, and is prominent from 1.857
and onwards through the final deposition of Bed I. Of the ten tuffs deposited from then until
1.803 Ma, phillipsite was the main mineral in six and the second mineral in a seventh. Ca was
also significant in Tuff IE in this later period.
3.2.2 Re-analysis of X-ray Fluorescence
Comparing Table 5 data with Berry's (2012) chart (Figure 7) regarding relative salinity /
dilution according to meteorological cycles, but expressed in descriptive terms for tuff samples at
corresponding ages, reveals phillipsite formed in these regimes: "dilute" (4 times), saline /
alkaline (2 times), and transitional from saline to "dilute" (1 time) for a total of seven. The latter,
Tuff IE vitric in the transitional regime at 1.835 Ma, showed phillipsite as s significant second
Table 5 Tabular age model and summary XRD output
NH4 and Mg in phillipsite refer to mineral varieties with strong peak correspondence identified by HighScore. These have not been verified.
Sample ID, GA-L-x-99 Depth from Bottom Mod. Deino Date (Ma)
Tuffs Highest Score Mineral Second Score Mineral(s) Environ. (Berry, 2012)
153 27.40 1.803 Tuff IF phillipsite (NH4) sanidine sal/alk
151 27.15 1.803 Tuff IF f-spar sanid.-like none sal/alk 52 24.53 1.831 Tuff IE phillipsite (NH4) calcite dilute
53 24.28 1.831 Tuff IE orthoclase calcite dilute 54 24.24 1.831 Tuff IE phillipsite (NH4) f-spar
sanid.-like
dilute
57 24.00 1.835 Tuff IE Vitric?
anorthoclase phillipsite (Mg) entering dilute 61 23.40 1.839 Tuff ID ? phillipsite (NH4) high sanidine sal/alk
64 22.71 1.843 Tuff IC ? f-spar sanid.-like bloedite entering sal/alk 67 22.00 1.848 Tuff IB phillipsite (NH4) sanidine dilute
145 19.60 1.857 Tuff phillipsite (Mg) albite dilute 104 16.70 1.869 Tuff orthoclase (K
0.94)
anorthite (sodian)
entering sal/alk
100 16.05 1.871 Tuff sanidine calcite dilute
97 15.82 1.872 Tuff f-spar sanid.-like calcite dilute 95 15.56 1.873 Tuffs /
clays
interm. microcline
anorthite calcite dilute
92 15.09 1.875 Tuff calcite hydrotalcite dilute 85 14.20 1.878 Tuff sanidine jarosite interm.
dilute 128 11.40 1.890 Tuff f-spar sanid.-like hydrotalcite dilute 126 11.11 1.891 Tuff sanidine (high) bloedite dilute 124 10.74 1.893 Tuff calcite gypsum dilute 117 9.45 1.898 Tuff gypsum none dilute
24 4.95 1.916 Tuff ankerite anorthite entering sal/alk 19 3.87 1.920 Tuff IA calcite orthoclase entering
sal/alk 18 3.60 1.920 Tuff IA analcime dolomite entering
sal/alk 17 3.40 1.920 Tuff IA calcite analcime entering
sal/alk 16 3.20 1.920 Tuff IA calcite dolomite entering
These XRD results do not show consistent zeolite authigenesis cycles in the tuffs. Neither
phillipsite nor other zeolites appear firmly tied to the presumed strongest saline / alkaline waters.
Sanidine and sanidine-like feldspars seem to have formed from tuffs mostly in "dilute" waters,
but not exclusively.
A tendency is seen for high phillipsite tuffs to alternate with K-spar tuffs, even when
supposedly deposited almost contemporaneously. It was noted in Introduction that trachyte glass
phillipsite K-feldspar (Hay, 1963, 1964 and 1970; and Sheppard and Gude, 1968), but the
alternations are regular in these deposits, as though there were short cycle condition changes not
seen as cycles in Table 5.
Careful taking of tangent points at peaks and center points of transitions (inflections)
from Figure 7 yielded Appendix E used to plot Figure 12. Caution is required here, because the
Berry (2012) source curve was not statistically rigorous, and these secondary peak and inflection
data were taken visually from that curve. The portrayal is largely notional, but the gross temporal
relationships are clear. With the exception of four tuffs clustered at 1.920 Ma at a climate
inflection and the two extreme, extrapolated wet cycle points, four periods occurred when
Figure 12 Tuff deposition history related to Berry (2012) wet and dry cycles
Berry's curve salinity maxima, inflections, and minima are plotted against the new age model.
While each of the next seven analyses through paragraph 3.2.4, Tuff Color, taken
separately, is statistically very weak, a definite pattern will be seen.
1.770
1.790
1.810
1.830
1.850
1.870
1.890
1.910
1.930
T
uffs
by
A
GE,
M
a
Tuff Deposition Related to Wet and Dry
Cycles
Tuffs at Age
Berry Dry Maxima
Berry Wet Maxima -Extremes are extrapolated
Examination of alkali metal (Na2O +K2O) values compared to alkaline earth metal CaO
divided by MgO (as a weathering index) in Figure 13 matches expectations based on molecular
[image:52.612.85.521.154.576.2]composition that phillipsite-bearing Bed I tuffs should to be high in Na and K.
Figure 13 Tuff (Na2O +K2O) oxides vs. CaO/MgO ratios: Phillipsite vs. non-phillipsite tuffs
Older tuffs, including the two analcime-containing tuffs, tend to be correspondingly
higher in alkaline earth elements. The contrast is not extreme between the two weak regression
lines; non-zeolite tuffs average only about 1.5% percent lower (Na2O +K2O) sums. However,
the data scatter of both sets is quite large, and both linear regression R2 values are low. Six of the y = -0.4439x + 12.106
R² = 0.30
y = -0.4667x + 10.498 R² = 0.26
5.00 6.00 7.00 8.00 9.00 10.00 11.00 12.00 13.00 14.00
0.00 2.00 4.00 6.00 8.00 10.00
Na
2O
+K
2O,
no
rm
a
li
zed
w
t.%
s
CaO%/MgO%, normalized wt.%s
Tuff Na + K Oxides vs CaO/MgO Ratios by Tuff
Age Range
Tuffs =/< 1.857 Ma
Tuffs =/> 1.869 Ma
Analcime Tuffs =/> 1.869 Ma
Linear (Tuffs =/< 1.857 Ma)