Modelling thermal stratification in atrium using TAS program and verification of prediction results
16
0
0
Full text
(2) International Journal of Integrated Engineering (Issue on Civil and Environmental Engineering). 1.. INTRODUCTION. consecutive summer days from 22nd to 31st July 2004. Measurement was conducted on three levels in the atrium and the parameters recorded included indoor and outdoor air temperature, internal surface temperatures of the atrium roof glazing and the internal walls exposed to solar radiation, and etc. Analysis of the measured data has proven that the strong stratifications of internal air and surface temperatures particularly at higher levels led to thermal discomfort to users [4]. Hence, the objective of this dynamic thermal modelling, using TAS software (version 1.8.5), was to correctly model thermal stratification within the three-level atrium. TAS program has been routinely used to model smaller spaces regarded as ‘rooms’ in conventional buildings. However, for buildings with a large and complex multi-level space such as atria, assigning a large single zone or only dividing each level into one zone may not be sufficient to correctly model the space. In this case, therefore, a large space within the atrium was modelled as a group of zones, each of which had an air temperature, mean radiant temperature and six flows with the neighbouring zones. As there has been no published literature reported on this method to date, such technique was an attempt to correctly model thermal stratification of a large multi-level space within the atrium. The prediction results of modelling with blinds and without water spray, particularly indoor air and mean radiant temperatures, and roof blind surface temperature, were compared and verified with those of the site measurement in order to evaluate the capability and accuracy of the developed TAS model in simulating atrium’s indoor thermal environmental performance.. The atrium’s indoor thermal environment is directly related to the complex interaction between buildings’ elements (and construction materials), forms, and external weather conditions [1]. For a building with atrium in tropical regions, which normally consists of large glazed roof or walls, internal heat gain due to solar causes indoor discomfort as well as increases the cooling load required if the building is to be air-conditioned. Heat gains (or losses) usually occur as a result of transmission and absorption through the transparent or opaque building envelopes, or result from infiltration or casual gains. Dynamic thermal simulation models are mathematical representations of the thermal processes occurring in a building. An energy simulation software TAS is a complete solution for the dynamic thermal simulation of a building, and a powerful design tool in the optimisation of a building’s environmental, energy and comfort performance [2]. It utilises proven and accurate empirical methods for estimating convective heat transfer from internal surfaces [3]. This paper discusses the TAS computer simulation of a three-storey atrium of the Xihu Yuan Guesthouse, located at the South China University of Technology, Guangzhou, China (Fig. 1). The atrium building is equipped with two low cost solar control measures namely the high level solar blinds and water spray on the external surface of the single glazed west facing atrium’s roof and wall. Such measures were to minimise the possible overheat problems on upper floors around the atrium space. A field study by conducting field experiment and monitoring was carried out for 10 80.
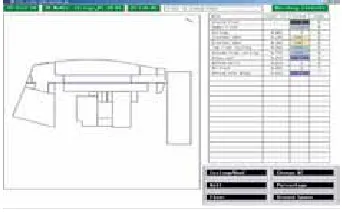
(3) International Journal of Integrated Engineering (Issue on Civil and Environmental Engineering). data file for the year 1989 for the city of Guangzhou was retrieved in order to generate the thermal response of the created model. Since these data were too old, they may not represent the current typical weather conditions and may affect the accuracy of the predicted results. As the site measurement of indoor conditions with blinds and without water spray were carried out on the 26th and 27th July 2004, the existing Guangzhou’s weather data in TAS for day 207 (26th July) and day 208 (27th July) should be amended in order to correctly model the measured conditions. The accuracy of the simulation results was largely associated with the similarity of the weather data in the weather file and the real local weather conditions for a particular day in question. The 24-hour weather data for both days include the hourly global and diffuse solar radiations, cloud cover, dry-bulb temperature, relative humidity, and wind speed and direction. Out of these seven climatic data required by TAS, only the outdoor air temperatures were measured during the field measurement, and thus could directly replace the existing dry-bulb temperature data for both days. The other weather data were amended accordingly to suit the general real weather conditions of the two days. Therefore, data on solar radiations, cloud cover and wind speed in the weather data file were slightly modified to reflect the real weather conditions of the two days: the local weather on the 26th July was generally hot and overcast whilst on the 27th July the weather was very hot and clear. In addition to having similar weather conditions, it was also very important that the geometry of the 3-D TAS model. PICTURE OF THE WEST FACING ATRIUM. Fig.1 Floor plan, cross section and a picture showing the west facing atrium. 2.. DESCRIPTION AND SPECIFICATION OF THE TAS ATRIUM MODEL. The building simulation in TAS is driven by weather conditions. Thus, the climatic data in its database contains recorded hourly variations in air temperature, humidity, solar energy, and wind speed and direction for a whole year. Weather 81.
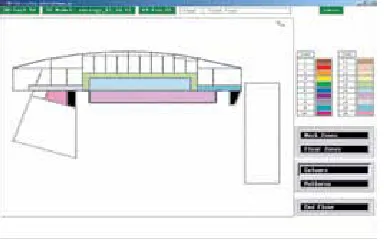
(4) International Journal of Integrated Engineering (Issue on Civil and Environmental Engineering). constructed (including construction details of all the building elements and internal conditions) be maintained as close as possible to the real measured conditions of the real building and its surrounding (nearby buildings and trees). In order to obtain better prediction results that have good agreement with the field measurement results, it is essential for TAS to generate similar simulation conditions.. elements and apertures were set up using the construction details programmer in building data editor.. Fig. 2 The 3-D geometric TAS model. 2.1. Development of TAS Model. The 3-D geometric model of the atrium building was created based on architectural drawings (Fig.2). The four-storey main building has a three-storey sloping single glazed west-facing atrium with two-storey height at its facade. The nearby building blocks were also included in the 3-D model so that TAS would calculate the possible shadow casts on the atrium during the course of the simulation day. However, to simplify the model the effect of the surrounding trees was not considered in this simulation. Initially, using the available architectural drawings of the real building, the floor plans were drawn in the 3DTAS (Fig. 3). The floor-to-floor height between each floor of the building was also specified. The north angle was set to reflect the orientation of the real building. The floor plan data includes specifying the building elements (ground floor and upper floor, internal and external walls, ceiling and roof, and no floor for the void areas between each floor) and apertures (windows, doors, vents, and zone divides to divide large internal spaces on each floor into separate zones). The details of building. Fig. 3 The ground floor plan of the TAS model. The next stage in the model development was to define zones within each floor (Fig. 4) for thermal simulation purposes. This zone definition was very crucial as it influence the way the model would be analysed. There were altogether 34 zones allocated for this model. The indoor thermal performance of the atrium, particularly related to higher level thermal stratification, was basically measured and analysed by comparing the hourly average indoor air temperature and mean radiant temperature of zones 15 to 17 for the first floor level and zones 23 to 25 for the second floor atrium level as shown in Fig. 5.. 82.
(5) International Journal of Integrated Engineering (Issue on Civil and Environmental Engineering). Fig. 4 First floor atrium zones allocation. Specifications of Building Data. The Building Data Editor menu in A-TAS provides facilities for defining and editing building data. The building elements and aperture types of the model were defined and edited in the Construction Details submenu, whilst the internal conditions were defined and edited in the Internal Conditions submenu. It is essential that construction details and internal conditions were defined and specified to closely match the real conditions as listed below: •. The external walls are mainly of plastered 180 mm width clay bricks. The other external wall materials include 152 × 152 × 114 mm clear glass block, and 10 mm width clear float glass with steel frame constructions;. •. The internal walls are of plastered 120 mm width clay bricks;. •. The atrium roof is of 10 mm width clear float glass with steel frame constructions; and. •. External doors and windows are of 10 mm width clear float glass with aluminum framing.. The floor, wall, roof and glazing constructions for the 3-D model were all simplified using common elemental construction materials and specified from the TAS Construction Database. The ground floor was simulated as being constructed on grade without a false floor. The thermal transmittance for this element was calculated to be 0.29 W/m2K. Intermediate floors/ceilings were of concrete and acoustic ceiling panels with a U-value of 0.95 W/ m2K. The 10 mm clear float glazed atrium roof construction with and without blinds had a U-value of 3.94 W/m2K and total solar transmittance of 0.49, and 6.23 W/ m2K and total solar transmittance of 0.76, respectively. The thermal transmittance of the main external walls of 180 mm width common brick plastered on either side was calculated to be 1.93 W/m2K. The external wall made of glass block was simulated as glazed windows of 6 mm width glass on either side with 12 mm air cavity. The thermal and total solar transmittance for this element was 1.78 W/m2K and 0.62 respectively. The internal walls of 120 mm. Fig. 5 Schematic cross-section showing atrium zones vertically. 2.2. •. The ground floor and intermediate floors are of reinforced concrete; 83.
(6) International Journal of Integrated Engineering (Issue on Civil and Environmental Engineering). width common brick plastered on either side had a U-value of 2.12 W/m2K. ‘Imaginary’ partitions (as shown in Fig.5 with dotted lines) that separate zones with no actual physical barrier within the large atrium volume were specified as zone divides (denoted by a slash (/) for TAS CCode) and ceiling/no floor, and also defined as apertures with 100% open in order to allow for airflow and thermal radiation and convection to occur vertically and horizontally between neighbouring zones. The windows were specified as being 10 mm clear float single glazed with thermal and total solar transmittance value of 5.33 W/m2K and 0.76, respectively. Whereas, for single glaze windows with blinds the U-value and total solar transmittance was 3.78 W/m2K and 0.49 respectively. In total the model has 36 building elements which includes apertures (windows and zone divides). In order to simulate the atrium thermal conditions when the blinds were extended from 0800-1800 hr, the new substitute building elements were created to represent both the atrium roof glass with blinds and clear glass windows/walls with blinds at the atrium facade. These new building elements were specifically put into the substitute building element and substitution schedule columns of the original building elements for both atrium roof glass and clear glass window. For internal conditions, the air temperature for all the ground floor zones were set to be between 20-24ºC and the plant operating period was set from 0700 to 2400 hr. This was to represent in the model that the air conditioning system was only confined in the ground floor of the real building. For simulation purposes, the occupancy period for most of the zones. was assumed to be 10 hours starting from 0800 to 1800 hr. The infiltration air rate for all zones was assumed and set to 0.5 ach, whilst the ventilation air rate was set to 0 ach (which assumes no ventilation air is introduced into the building from outside). The sensible and latent heat gains from occupants, lighting and equipments for each zone were set accordingly. Since the usage of the space was very irregular, it was assumed that on the average at any particular hour over the ten-hour period (0800-1800 hr) there were 10 persons around the reception/entrance hall and 20 persons in the cortile areas. The following assumptions and settings were considered for specifying internal conditions:. 84. •. Reception/entrance hall zones (floor area = 180.68 m2) – Zones 2 and 8: Infiltration rate = 0.5 ach (24 hours) Lighting gains = 13 W/m2 Occupant sensible gain = (10×80W)/ 180.68m2 ≈ 5 W/m2 Occupant latent gain = 2 2 (10×60W)/180.68 m ≈ 3 W/m Equipment sensible gain = (3PC at 160W each) ≈ 2 W/m2.. •. Cortile zone (floor area = 336.21 m2) – Zones 1, 3 and 9: Infiltration rate = 0.5 ach (24 hours) Lighting gains = 13 W/m2 Occupant sensible gain = (20×80W)/ 336.21m2 ≈ 5 W/m2 Occupant latent gain = (20×60W)/ 336.21m2 ≈ 4 W/m2.. •. Ground floor atrium zones – Zones 4,5 10 and 11: Infiltration rate = 0.5 ach (24 hours) Lighting gains = 5 W/m2 Occupant sensible gain = 2 W/m2 Occupant latent gain = 1 W/m2..
(7) International Journal of Integrated Engineering (Issue on Civil and Environmental Engineering). •. First and second floor balcony – Zones 15 and 23: Infiltration rate = 0.5 ach (24 hours) Lighting gains = 5 W/m2 Occupant sensible gain = 2 W/m2 Occupant latent gain = 1 W/m2.. •. First and second floor atrium void zones – Zones 16, 17 and 24, 25: Infiltration rate = 0.5 ach (24 hours) Lighting gains = 10 W/m2 Occupant sensible gain = 0 W/m2 Occupant latent gain = 0 W/m2.. 12 inlets sized 800 × 200 mm located at the sides of the first floor balcony facing the atrium with each supplying an average air volume rate of 1,245 m3/h, yielding the total supplied air volume rate of 14,940 m3/h. Similarly the volume flow rate was converted to mass flow rate, which in this case was 5.02 kg/s. In order to correctly model thermal stratification within the atrium, the total airflow rate was specified to the ground floor atrium zones (zones 4, 5, 6, 10, 11 and 12) accordingly based on the volume of each zone. For other zones, TAS would calculate the inter-zone mass flow rate automatically. The 0.6 × 1.0 m vent, which was defined as aperture and specified with 30% open, was located on the third floor to exhaust the air out of the building in order to keep the air quantity balanced. The TAS model was simulated for both measured conditions: day 207 (26th July) during which the weather was generally hot and overcast; and day 208 (27th July) when the weather was very hot and clear. For each simulation run, the model was ‘pre-conditioned’ for 10 days. This is a feature of the TAS program that allows the building to be simulated under the weather condition occurring for a number of days prior to the day when the simulation results are actually recorded. Its purpose is to ensure that the reported results are reflective of any thermal storage effects of the structure.. In the real building, the 24ºC conditioned air was supplied to the entrance hall/reception, restaurant and cortile areas by 20 inlets sized 350 × 350 mm with each supplying an average air volume rate of 957.5 m3/h. The total air volume rate supplied to these areas was 19,150 m3/h (5.32 m3/s). As TAS requires the airflow rate to be specified in mass flow rate (kg/ s), the volume flow rate (m3/s) has to be multiplied by the density of air at standard atmospheric pressure and a temperature of 20ºC (ρair = 1.210 kg/m3). Therefore the total mass flow rate to be specified for these zones was 6.44 kg/s. Since the restaurant area was not included in this modelling, it was assumed that the mass flow rate supplied to the reception/entrance hall and cortile areas was 4.02 kg/s calculated based on the zone volumes. Hence, reception/entrance hall zones (zones 2 and 8) and dining zones (zones 1, 3 and 9) were specified 1.60 kg/s and 2.42 kg/s, respectively. The amount specified in the inter-zone (zonal) air movement table in TAS for each of the zones was also calculated based on its volume. The conditioned air for the ground floor atrium, on the other hand, was supplied by. 3.. SENSITIVITY TEST OF THE TAS MODEL. Using the same 3-D TAS model and internal condition settings but modelling 85.
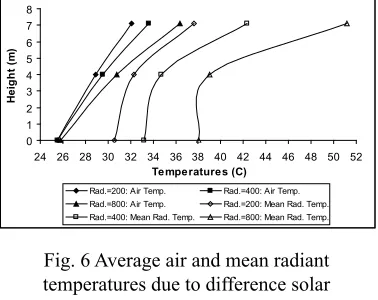
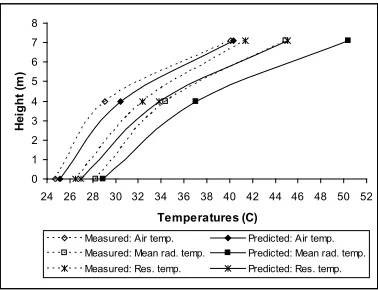
(8) International Journal of Integrated Engineering (Issue on Civil and Environmental Engineering). without internal solar blinds, a sensitivity test simulation was conducted. This test was to verify the capability of the TAS program to reflect the thermophysical response of the model to the changes in the main external weather parameter with regard to buildings with large glazed areas. In particular it was to verify the created TAS model in modelling thermal stratification within the multi-level atrium. This test is essential as it would provide a general picture of the expected thermal behaviour inside the atrium, and thus help to develop confidence in the model before being used to model the measured conditions. In this test, the air and mean radiant temperatures of all the zones within the three-storey atrium were the main outputs being measured from the model. These outputs were measured in response to changing global solar irradiance. In addition the inter-zone bulk air movement of all the atrium zones was also measured to ensure balanced air quantity within each zone. In order to simulate the model’s indoor thermal response due to different global solar irradiances, the weather file for Guangzhou for day 206 was retrieved and modified. The hourly diffuse solar radiation was fixed at 0 W/m2 and the original values for other weather parameters remained unchanged. The model’s response was simulated for three different hourly global solar radiation intensities: 200 W/m2, 400 W/m2 and 800 W/m2. As such, for each simulation the hourly global solar radiation from 0900 to 1800 hr was fixed accordingly based on the three global radiation intensities stated above. The model was ‘preconditioned’ for 10 days for all the simulation runs.. 3.1. Sensitivity Test Analysis. The purpose of the sensitivity test is to establish whether or not the TAS program is able to reflect the thermophysical response of the created 3-D model due to changes in solar radiation intensities. The approach for establishing this capability entailed the measurement of air and mean radiant temperatures within the three-storey atrium, and also the air movement between zones within the atrium and also the neighbouring zones. There were two main contributors to the resulting thermal condition inside the atrium. First, it is due to the heat transfer in internal building element surfaces as a result of conduction heat flow into the internal building surfaces, heat gain from convection and long-wave radiation exchange, casual gain from occupants, lightings and equipment, and solar heat gain from solar radiation entering from the transparent building components. Secondly, the air movement between different zones also causes the heat transfer and the change of moisture contents, thus affecting the thermal balance of each zone within the atrium. The average air temperatures and mean radiant temperatures for zones within each level of the three-storey atrium at 1600 hr (i.e. the hottest hour of the day at which the external dry-bulb temperature is 33.9ºC) are shown in Fig. 6. Generally the graph indicates that as the intensity of solar radiation increases, stronger thermal stratification occurs at upper levels. As expected, with the internal condition settings remained unchanged it can be clearly seen that the air temperatures and mean radiant temperatures, particularly on upper floors increase dramatically with increasing intensity of global solar irradiance. 86.
(9) International Journal of Integrated Engineering (Issue on Civil and Environmental Engineering). Since the ground floor of the atrium was air-conditioned, the air temperature of the ground floor atrium zones had been marginally affected by solar radiation. However, solar radiation greatly influenced the air and mean radiant temperatures of atrium zones on the upper levels. For the first and second floor levels, as illustrated in Fig. 6 the average air temperature increased by about 0.6 K and 1.4 K, respectively for every 200 W/m2 incremental values of solar irradiance. Similarly the same incremental values of solar irradiance resulted in the increase of average mean radiant temperature approximately 2.2 K for the first floor level and 4.4 K for the second floor level, respectively. This can best be explained by the fact that the solar gain for each of the zones due to solar radiation directly influenced the zone’s air and mean radiant temperatures.. transparent constructions to other zones. In the distribution process, the radiation absorbed by the surfaces of each atrium’s zone is totaled and stored in the quantities Qisol,int, which is the solar radiation (in kW) absorbed on internal surface i of the zone. For a transparent construction, radiation is actually absorbed within the construction, rather than at its surface. In this case the surface solar gains are calculated on the basis of the equivalent surface absorptances. Therefore, zone solar gain inside the atrium was the sum of the surface solar gains for all the surfaces facing into the zone, as given by the expression in Equation (1) [5]. Qisol,int = ∑ Qisol,int i. TAS defines the glazed portions of the internal and external structure as ‘transparent’ elements, whilst the nonglazed portions are defined as ‘opaque’ elements. For atrium zones partitioned and modelled as ‘zone divides’ and ‘ceiling/ no floor’, and defined as apertures with 100% open, the mean radiant temperature was relatively less compared to the zones modelled with ‘transparent’ and ‘opaque’ elemental surfaces. In general the solar gains on the ground floor of the atrium was mainly contributed by the opaque floor of zone 4 and 5, and opaque and transparent wall components of zone 5 and 11 (see Figures 6 and 7). As zones 5 and 11 also received the most direct solar radiation from the top, thus they contributed the most solar gains to the ground floor atrium. On the first floor, zone 17 contributed the most solar gain due to direct solar radiation on its transparent glazed walls. Although the air temperature of zone 15 is higher compared to zone 16 and 17, its mean radiant temperature is comparatively less resulting. 8. Height (m). 7 6 5 4 3 2 1 0 24 26 28 30 32 34 36 38 40 42 44 46 48 50 52 Temperatures (C) Rad.=200: Air Temp.. Rad.=400: Air Temp.. Rad.=800: Air Temp.. Rad.=200: Mean Rad. Temp.. Rad.=400: Mean Rad. Temp.. Rad.=800: Mean Rad. Temp.. Fig. 6 Average air and mean radiant temperatures due to difference solar irradiances (Solar radiation = 200; 400 & 800 W/m2). During TAS simulation, solar radiation entering the atrium through the glazed roof and walls is distributed over the zone’s internal surfaces. Some of this radiation may be transmitted back out of the building through the glazed envelopes, and some may be transmitted through further 40. Temperature (C). 38 36 34 32 30 28 26. 1. 2. 3. 4. 5. 6. 7. 8. 9. 10 11 12 13 14 15 16 17 18 19 20 21 22 23 24. Hours of the day 1st fl: Measured. 1st fl: Predicted. 2nd fl: Predicted. Outdoor. (1). 87. 2nd fl: Measured.
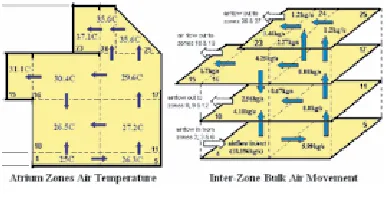
(10) International Journal of Integrated Engineering (Issue on Civil and Environmental Engineering). z. QSH_am = ∑ mszcp(Tai,s – Tai,z) s=0. 8. Height (m). 7 6 5 4 3 2 1 0. zones as illustrated in Fig. 7. In general the air moves laterally and vertically from zone of lower temperature to zone of higher air temperature except zone 10 where the air from higher temperature zones 16 and 11 moves towards it. This was due to the fact that zone 10 had been depressurised as most of its air flow out to neighbouring zones 8, 9 and 12. Fig. 7 also indicates the hotter upper level zones had enhanced the upward flow of air from cooler ground floor zone as demonstrated by the large mass flow rate from zone 5 to 11 (8.8 kg/s), from zone 11 to 17 (8.88kg/s) and from zone 17 to 23-25 (8.13 kg/s).. 24 26 28 30 32 34 36 38 40 42 44 46 48 50 52 Temperatures (C) Rad.=200: Air Temp.. Rad.=400: Air Temp.. Rad.=800: Air Temp.. Rad.=200: Mean Rad. Temp.. Rad.=400: Mean Rad. Temp.. Rad.=800: Mean Rad. Temp.. 40 38. Temperature (C). from the lower solar gains on its internal opaque surfaces. However, the high air and mean radiant temperatures on the second floor atrium zones were greatly caused by the highest solar gains from direct solar radiations on their opaque and transparent building components. Additionally the heat transfer due to convection and the long-wave radiation at the opaque and transparent zone surfaces also affected the air and mean radiant temperature of the neighbouring zones. Air movement between different zones within the atrium can cause the heat transfer and the change of moisture contents, thereby affecting the thermal balance of each zone. In TAS, air movement is calculated by mass flow rate and the net inter-zone bulk air movement inside the atrium at 1600 hr for global solar irradiance 800 W/m2 is shown in Fig. 7. The total sensible heat gain, (Watts), into zone z due to air movement is determined by Equation (2)[5].. 36 34 32 30 28 26. 1. 2. 3. 4. 5. 6. 7. 8. 9. 10 11 12 13 14 15 16 17 18 19 20 21 22 23 24. Hours of the day. 1st fl: Measured. 1st fl: Predicted. 2nd fl: Predicted. Outdoor. 2nd fl: Measured. Fig. 7 Zones air temperature and net inter-zone bulk air movement between the atrium zones at 1600 hr / 33.9ºC external air temperature (Solar Radiation = 800 W/m2). (2). where; msz : the mass flow rate from source zone s (with 0 representing the outside air) to zone z; z : the number of zones in the model; Tai,s : the air temperature in source zone s (or the outside temperature in the case (s = 0); and Tai,z : the air temperature in zone z.. TAS assumes that the air in any particular zone within the building is well mixed and therefore represented by a single zone temperature, which is calculated by balancing heat gains and losses at the air point. The zone air heat balance equates the rate at which heat is added to the air (QSH_air) to the total heat gain from infiltration (QSH_inf), ventilation (QSH_vent), air movement (QSH_am), casual gains (QSH_gains,conv), plant convection (QSH_plant,conv) and surface convection (∑Qiconv,int) [5]. It also can be seen from Fig. 7 that zones 17 and 25, which were partly enclosed. The quantity of inflow air and the outflow air calculated by TAS for each zone are perfectly balanced. As the ground floor atrium zones were pressurised, the air generally tends to flow upwards to the naturally ventilated upper levels atrium’s 88.
(11) International Journal of Integrated Engineering (Issue on Civil and Environmental Engineering). by large glazed elements, recorded slightly lower air temperatures compared to that of other zones enclosed largely by opaque elements, on the same levels respectively, despite receiving the highest solar radiation. The reason for this was that the presence of air movement within the zones had caused higher rate of heat loss due to convection at the glazed surface as well as through the glazing, thereby reducing the zones’ air heat balance which led to relatively lower air temperatures. The surfaces of opaque elements generally tend to be rough as compared to that of the glazed elements. Therefore it is expected that boundary layer airflow over opaque surfaces will be more turbulent than that for the glazing. This will result in comparatively higher convection heat transfer coefficients for the opaque elements. Nevertheless, this is expected to minimally affect the overall thermal resistance of the opaque element due to its high thermal inertia. On the contrary, glazing typically has a lower thermal inertia as compared to the opaque building elements. Therefore it is anticipated that the rate of heat loss through the glazing is going to be higher than that for the opaque element. Furthermore, it is expected that the total thermal transmittance for the glazing be more affected by the air movement as compared to that for the opaque elements. This study illustrates that solar radiation intensity greatly influences the thermal condition and airflow distribution within the atrium. Air and mean radiant temperature data of all atrium zones confirm that the amount of thermal stratification inside the three-storey atrium varies as a function of global solar irradiance, and that TAS accounts for these changes. In addition, this sensitivity test also confirms. that the created 3-D TAS model is capable to accurately model thermal stratification within the multi-level atrium, and thus can be used to model the measured conditions.. 4.. RESULTS AND DISCUSSION. It can be clearly seen from Figures 8 and 9 that TAS simulation results tend to be overestimated for both first and second floors. In addition to the €dissimilarity in weather conditions, the discrepancies between the measured and predicted results might also be due to the following:. 89. •. As a result of uncertainties of the thermal properties of the existing construction materials, the thermal properties of building elements including the glazed openings of the TAS model were estimated and specified using the construction details programmer in building data editor. Inaccurate specifications of thermal property data, particularly for the glazed roof and walls, led to higher prediction of solar penetration in the model, whereas in the real building solar penetration could be much smaller than that of the TAS model; thus, resulting in higher prediction of the indoor net heat gain in the model.. •. In the real building, there were numerous infiltration airflow paths which allowed the indoor heat to be dissipated. However, in the TAS model the infiltration rates were fixed and the values could be much lower than that of the real building. Hence, less heat dissipation in the TAS model led to.
(12) International Journal of Integrated Engineering (Issue on Civil and Environmental Engineering). higher prediction of the indoor heat gain. •. 8. Height (m). 7 6 5 4 3 2 1 0 24 26. However, both graphs above show similar trend which indicates that the temperature stratification occured at high level inside the atrium where the indoor air temperature on the second floor is well above the outdoor air temperature. For overcast day (day 207) the difference in air temperature between the first and second floors at 1500 hr (the hottest hour of the day) was 9.3 K for measured and 8 K for TAS prediction results respectively. For clear day (day 208), on the other hand, the air temperature difference at 1400 hrs (the hottest hour of the day) was 11 K and 9.9 K for measured and predicted results respectively. These results revealed that during the hottest hour of the day the measured conditions recorded slightly higher air temperature difference between the first and second floors compared to that predicted by TAS. In general for both overcast and clear days the predicted air temperatures on the first floor in the afternoon was comparatively higher than the measured conditions. The difference in air temperature on the first floor in the afternoon between measured condition and TAS prediction was in the range of 0.7 K to 1.5 K for overcast day and 0.2 K to 1.3 K for clear day respectively. Basically the higher air temperature on the second floor was due to the fact that there was no provision of rooftop vent to exhaust the hot air at higher level out of the building. It was found that for hot and overcast day, it was not easy to estimate and modify the amount of solar radiation and cloudiness compared to that of the hot and clear day. Fig. 8 shows considerable discrepancies between predicted and measured air temperature on the second floor particularly from early morning to 1200 hr where the differences ranged from 1.5K to 4.3K. On. In the TAS model, the fixed internal conditions were specified based on general assumptions and estimations. There is a tendency for the heat gains from occupants, lighting and equipment to be overestimated in the model since the occupancy pattern and the use of lighting and equipment in the real conditions were somewhat 28 30 32 34 36Moreover, 38 40 42 44 46 there 48 50 52 irregular. is also a Temperatures (C) great possibility that the infiltration rates and conditioned air supply rates were underestimated due to the uncertainties of the actual flow rates and uncontrolled actions of the users in the real building. All these resulted in higher prediction of the indoor heat gain in the model. Rad.=200: Air Temp.. Rad.=400: Air Temp.. Rad.=800: Air Temp.. Rad.=200: Mean Rad. Temp.. Rad.=400: Mean Rad. Temp.. Rad.=800: Mean Rad. Temp.. 40. Temperature (C). 38 36 34 32 30 28 26 1. 2. 3. 4. 5. 6. 7. 8. 9. 10 11 12 13 14 15 16 17 18 19 20 21 22 23 24. Hours of the day 1st fl: Measured. 1st fl: Predicted. 2nd fl: Predicted. Outdoor. 2nd fl: Measured. Fig. 8 Average measured/predicted air temperatures for hot and overcast day (simulation day 207) 42. Temperature (C). 40 38 36 34 32 30 28 26 1. 2. 3. 4. 5. 6. 7. 8. 9. 10 11 12 13 14 15 16 17 18 19 20 21 22 23 24. Hours of the Day. 8 7. Height (m). 6 5. 1st fl: Measured. 1st fl: Predicted. 2nd fl: Predicted. Outdoor. 2nd fl: Measured. Fig. 9 Average measured/predicted air temperatures for hot and clear day (simulation day 208). 4 3. 90. 2 1 0 24 26 28 30 32 34 36 38 40 42 44 46 48 50 52. Temperatures (C). load (N). 1200000. 800000. Measured: Air temp. Measured: Mean rad. temp.. Predicted: Air temp. Predicted: Mean rad. temp.. Measured: Res. temp.. Predicted: Res. temp..
(13) International Journal of Integrated Engineering (Issue on Civil and Environmental Engineering). the other hand, the predicted results on the first floor agree reasonably well with the measured air temperatures even though TAS calculations tend to be overestimated. However, during hot and clear day when the water spray was turned off and the solar blinds were extended, the TAS prediction results show a reasonably good agreement with the measured data as revealed by Fig. 9. Similar to the results for hot and overcast day, the discrepancies between the measured and predicted results generally occur from early morning to about noon. An explanation for this could be due to the large thermal storage effect calculated by TAS, which was carried on to the simulation day, as 10-day pre-conditioning period was considered for these modellings. Therefore the high air temperature due to thermal storage effect of the structure calculated by TAS a few days prior to the simulation day affected the air temperature of the simulation particularly from early morning to about noon. However, as the sun’s altitude gets higher, and since solar radiation is the dominant factor affecting thermal condition within a building with large glazed enclosures, a correct solar prediction could cover all small errors which subsequently led to more reasonable overall results particularly on the second floor. In general for both simulation days, the predicted and measured air temperatures on the second floor agree considerably well particularly from noon to midnight. However, from late night to around noon the predicted results were generally overestimated, and particularly between 0800-1100 hr the predicted and measured air temperature show considerably large differences. In contrast, predicted air temperatures on the first floor are slightly. underestimated from 1900 hr to about midnight. The reason for the large discrepancies between measured and predicted air temperatures on the second floor is apparently due to the large overestimation of internal surfaces temperatures by TAS (as depicted by higher prediction of both resultant temperature and blind surface temperature in Fig. 10). Therefore, at night when the external air temperature drops, TAS took into account the heat released by the hot internal surfaces, which led to the rise in air temperature within the atrium particularly on higher level. The same situation applies to the first floor level where the predicted air temperature is generally greater than the measured air temperature. However, when the solar blinds were fully retracted at 1800 hr, the predicted air temperatures fell below the measured air temperatures starting from about 1900 hr to midnight as the effect of blind’s surface temperature was not considered. 65. Temperature (C). 60 55 50 45 40 35 30 25. 9. 10. 11. 12. 13. 14. 15. 16. 17. 18. Hours of the day 1 s t fl: Me a s u re d R e s . te m p .. 2 n d fl: Me a s u re d R e s . Te m p .. 1 s t fl: P re d icte d R e s . Te m p .. 2 n d fl: P re d icte d R e s . Te m p .. Me a s u re d : B lin d s s u rf. te m p. P re d icte d : B lin d s s u rf. te m p .. Fig. 10 Average measured/predicted resultant temperature and roof blinds surface temperature for simulation day 208. Furthermore, the large discrepancies between measured and predicted air temperatures on the second floor between 0800-1100 hr was particularly due to the 91.
(14) International Journal of Integrated Engineering (Issue on Civil and Environmental Engineering). effects of blinds which were scheduled to be extended starting from 0800 hr. The contribution of higher surface temperature of the blinds, especially during the first few hours after being extended, led to higher air temperature predicted by TAS. On the first floor when the blinds were first extended at 0800 hr, there was a sudden drop in the predicted air temperature between 08000900 hr before it started to rise back later. The presence of blinds helped to cut direct solar radiation from penetrating deeply to lower level which subsequently reduced the air temperature. However, the eventual increase in blinds surface temperature at later hours as it absorbed more and more heat from solar radiation had resulted in the rise of air temperature for both the first and second floors. In real conditions during summer, however, the blinds were usually extended between 0900 to 1100 hr depending on the external weather condition. In general, the predicted and measured air temperatures on the first floor showed slight differences but were reasonably acceptable. It can be clearly seen from both Figures 10 and 11 that even though the measured and predicted air temperatures on the second floor differ slightly, the TAS prediction of resultant/mean radiant temperatures was relatively higher than the measurement. The reason was that in the TAS model, the blinds were assumed to cover the whole glazed roof area. Whereas in the real building, the roller solar blinds were installed in pieces and each glass panel provides gaps between each blind from which the air in between the glass roof and blinds could move freely. The higher air temperature in between the blinds and the glass roof predicted by TAS led to the increase in the blinds’ surface temperature significantly as depicted in Fig.. 10. Consequently, the resultant temperature on the second floor would also increase as a result of higher mean radiant temperature as illustrated in Fig. 11. However, the predicted resultant temperature on the first floor showed a considerably good Hours of data the Day due to agreement with the measured 1st fl: Measured 1st fl: Predicted 2nd fl: Measured slightly lower mean radiant temperature. 2nd fl: Predicted Outdoor 42. Temperature (C). 40 38 36 34 32 30 28 26. 1. 2. 3. 4. 5. 6. 7. 8. 9. 10 11 12 13 14 15 16 17 18 19 20 21 22 23 24. 8 7. Height (m). 6 5 4 3 2 1 0 24 26 28 30 32 34 36 38 40 42 44 46 48 50 52. Temperatures (C) Measured: Air temp. Measured: Mean rad. temp.. Predicted: Air temp. Predicted: Mean rad. temp.. Measured: Res. temp.. Predicted: Res. temp.. load (N). Fig. 11 Average measured/predicted air and mean radiant temperatures at 1400 hrs for 1200000 simulation day 208. Comparison of prediction results made by TAS and the results from site measurement has shown that the created 400000 TAS model is capable to model thermal stratification within multi-level atrium with t=4mm t=5mm reasonably accurate results. Quantitatively, t=6.3mm on0 0 hot and4 clear 8 day, considering the 20 12 16 deflection average air temperature difference between (mm) the second floor and first floor from 08001800 hr, measured data yielded 6.6 K whilst the predicted result gave 6.7 K. On the other hand, for hot and overcast day, the difference in air temperature between the second and first floor yielded 4.0 K for measured data and 5.0 K for predicted result respectively. This small error in the range of 0.1 to 1.0 K made by TAS is considered in the acceptable range. 800000. 92.
(15) International Journal of Integrated Engineering (Issue on Civil and Environmental Engineering). 5.. CONCLUSION. and valuable suggestions during the field measurement and monitoring period.. As anticipated, there would be discrepancies between the measured data and TAS prediction results since the measured conditions and the assumed simulation conditions made for the TAS model was not exactly similar. The fixed internal conditions settings made for the TAS model were merely based on general assumptions and estimations. Whereas in the real conditions there were a lot of uncertainties and irregularities in the occupancy patterns, infiltration rates, conditioned air supply rates, etc., as well as uncontrolled actions of the users, which directly influenced the measured parameters recorded. However, the general trend proves that large unwanted thermal stratification occurs at upper floor causing great thermal discomfort to the occupants. It is evident from this study that the developed 3-D TAS model is capable to model thermal stratification within multilevel atrium, with reasonably accurate results. The large atrium void can be divided into a group of zones so that the thermal condition for each individual zone and the bulk air movement between zones can be examined closely.. REFERENCES [2] M.R. Atif,. Daylighting and Cooling of Atrium Building in Warm Climates: Impact of the Top Fenestration and Wall Mass Area. Unpublished Ph.D. Thesis, Texas A&M University, 1992. [3] A.M. Jones, Software Package for the Thermal Analysis of Building. TAS EDSL Ltd: 13/14 Cofferidge Close, Stony Stratford, Milton Keynes, MK11 1BY, United Kingdom. [4] F. Alamdari, Appropriate Calculation Methods for Convective Heat Transfer from Building Surfaces. Institution of Chemical Engineers Symposium Series. No 86: 1201-1212, 1984. [5] A.H. Abdullah and F. Wang, Effect of Water Spray and Blinds on Indoor Thermal Environment in an Atrium in Tropical Climate, Proceedings of the Asean Postgraduate Seminar in Built Environment, Faculty of Built Environment, 5-7th December 2005, University of Malaya, Kuala Lumpur, Malaysia, pp. 79-87, 2005. [6] A-Tas Theory Reference Manual, TAS EDSL Ltd., United Kingdom, 2001.. ACKNOWLEDGMENT We wish to thank the University Tun Hussein Onn Malaysia (UTHM) and the Government of Malaysia for awarding the scholarship that enables us to carry out this research. We are also very grateful to staff at the Department of Architecture, South China University of Technology especially Professor Meng Qinlin and Associate Professor Zhao Lihua for their support 93.
(16) International Journal of Integrated Engineering (Issue on Civil and Environmental Engineering). 94.
(17)
Figure
+3

Related documents
We induced anxiety and depression in the rats and then tried to activate a neurotransmitter system called nitric oxide or NO in the important part of amygdala (basolateral
Student achievement data; school improvement plans for comprehensive and targeted support schools; principal evaluation protocol for districts; school climate survey results..
The key findings of the study highlight the important role that social workers who provide social services to abused women in shelters play in the process of
The closed-loop control performance first steadily worsened (decreasing SPCC, increasing NRMSTE) with the decrease of the stimulation frequency and tracking error sampling rate,
Calculations of the temperature, pressure, heat transfer, inside and outside coefficients, global heat transfer coefficient and area for every element of the HRSG (economizer,
In practice the construction is like a standard inverted Stewart platform - the platform is able to move in all six degrees of freedom with respect to its base.. The
11.. It is particularly helpful for building strength, the circulation is also improved, blood pressure is lowered, breathing gradually becomes deeper and this increases
This use case is about the Search of the Food Items.The Admin and Customer will search the Food Items from the Food Items Database But the Customer will
