Simplex-centroid mixture formulation for optimised composting of kitchen waste
N. Abdullah, N.L. Chin
*Department of Process and Food Engineering, Faculty of Engineering, Universiti Putra Malaysia, 43400 UPM, Serdang, Selangor, Malaysia
a r t i c l e
i n f o
Article history: Received 11 March 2010
Received in revised form 11 May 2010 Accepted 19 May 2010
Available online 17 June 2010
Keywords: Vegetable scraps Fish processing waste Newspaper Onion peels
Simplex-centroid mixture design
a b s t r a c t
Composting is a good recycling method to fully utilise all the organic wastes present in kitchen waste due to its high nutritious matter within the waste. In this present study, the optimised mixture proportions of kitchen waste containing vegetable scraps (V), fish processing waste (F) and newspaper (N) or onion peels (O) were determined by applying the simplex-centroid mixture design method to achieve the desired ini-tial moisture content and carbon-to-nitrogen (CN) ratio for effective composting process. The best mix-ture was at 48.5% V, 17.7% F and 33.7% N for blends with newspaper while for blends with onion peels, the mixture proportion was 44.0% V, 19.7% F and 36.2% O. The predicted responses from these mixture proportions fall in the acceptable limits of moisture content of 50% to 65% and CN ratio of 20–40 and were also validated experimentally.
Ó2010 Elsevier Ltd. All rights reserved.
1. Introduction
Waste has become a major problem to this world due to the increasing population, urbanisation, intensive agriculture and industrialization. Some 60% of the world’s population is expected to live in the cities by 2020 (Bhatt, 2009). Based on the nature of man-kind, people will produce kitchen waste everyday and everywhere no matter how much it is. Kitchen waste consists of considerable quantities of food processed and prepared for human consumption and all other constituents of the refuse like plastics and paper. While people give attention to recycle inorganic wastes such as plastics, glass and papers, the organic waste can be recycled into compost. This interpretation is similar withVeeken and Hamelers (1999), who found that the kitchen waste is rich in organic material and pos-sesses more than 90% of biodegradability. As such, composting of kitchen waste can be an effective method to reduce waste in landfills which helps to conserve the environment.
In the context of composting, an optimum value of moisture content enables bacterial action to work as water acts as a medium for bacteria to become active and survive. Too high a moisture con-tent will close the air pores, reduce the oxygen concon-tent and conse-quently turns composting into a fermentation process.Horiuchi et al. (2004)in their work of onion residues composting suggested that the moisture content has to be properly determined to main-tain proper oxygen transfer in composting material. Nevertheless, if there is excessive water during a composting process, the leach-ates can be recovered and recycled for mixture rewetting (Laos
et al., 2002). Previous studies have reported different ranges of optimum moisture content depending on the type of waste, i.e.
50–65% for olive pomace, poultry manure and wheat straw ( Arva-nitoyannis and Kassaveti, 2006), 61.8–64.2% for food waste, cow manure, mulch hay and wood shavings (Cekmecelioglu et al., 2005), 45–60% for exhausted olive cake, poultry manure and ses-ame bark (Sellami et al., 2008), and 65–80% for fresh vegetable pro-cessing waste (Stabnikova et al., 2005).
The optimum value of the carbon-to-nitrogen ratio (CN ratio) is also the other essential factor for microorganisms to perform the decomposition of organic wastes during a composting process (Qdais and Hamoda, 2004). Carbon provides the cellulose needed by the composting bacteria for conversion to sugars and heat. The carbon sources for microorganisms usually come from bulking agents such as sawdust and wood chips (Laos et al., 2002). Nitrogen provides the most concentrated protein, which allows the compost bacteria to thrive.Chang and Hsu (2008)have conclusively shown that substrate containing more protein has bacteria growing more rapidly and acids consumed faster rending a composting process which needs less time for maturity, produces more carbon dioxide, achieves higher temperatures during composting process and high-er pH values at the end (Chang and Hsu, 2008). The initial CN ratio of the material must be between 25:1 and 35:1 (Cekmecelioglu et al., 2005) to avoid the production of offensive odours due to the high nitrogen content, which can mineralize into ammonia (Qdais and Hamoda, 2004) and the difficulties of the material to attain the thermophilic stage if it has too low CN ratio (Arvanitoyannis and Kassaveti, 2006). High CN ratio values will also lower the biodegra-dation rate which results a longer time for composting process (Qdais and Hamoda, 2004; Arvanitoyannis and Kassaveti, 2006).
0960-8524/$ - see front matterÓ2010 Elsevier Ltd. All rights reserved. doi:10.1016/j.biortech.2010.05.068
* Corresponding author. Tel.: +60 389466353; fax: +60 389464440. E-mail address:[email protected](N.L. Chin).
Contents lists available atScienceDirect
Bioresource Technology
Since the initial moisture content and the CN ratio are two essential factors for a composting process, the correct formulation is necessary for commencing of the composting process. A system-atic method of mixture optimisation can be used to generate the individual portion of each substrate instead of the trial-and-error method. The common sense and the trial-and-error method to get the best mixture (Sánchez-Arias et al., 2008) could be time con-suming and require higher costs if results are not achieved after two to three replication. Besides in composting (Cekmecelioglu et al., 2005; Chang and Hsu, 2008), the mixture design has also been utilised to optimise mixture proportions in the food industry (Rehman et al., 2007), the pharmaceutical industry (Huang et al., 2005; Mura et al., 2005) and in engineering (Brandvik and Daling, 1998; Santafé-Moros et al., 2005). The objective of this paper is to find the optimum formulation of kitchen waste consisting vegeta-ble scraps (V), fish processing waste (F), and newspaper (N) or onion peels (O) for composting with aid of commercial softwares
i.e.the MINITAB and Expert-Design.
2. Methods
2.1. Materials
The vegetable scraps and fish processing waste used were en-sured its homogeneity as the composition of kitchen waste de-pends on the eating habits and varies significantly from day to day. Spinach (Spinacia oleraceaL.) from the family of Amarantha-ceae, can be found mostly in subtropical and tropical regions and Indian mackerels (Rastrelliger Kanagurta C.) from the family of Scombridae, commonly found in the Indian and West Pacific oceans, and their surrounding areas were bought from a local mar-ket. The root of spinach and3=
4of its stem were chopped into
max-imum length of 2 cm. The unused parts of mackerels were removed and ground using a kitchen blender (PB-323T, Pensonic, Malaysia). The onion (Allium cepa L.) peels, from the family of Alliaceae, widely distributed and cultivated in Europe and North America were obtained from a grocery shop and the old newspapers were ground using a knife-blade lab grinder (Dickson DFT-150, China) in order to get a uniform mixture for obtaining a consistent blend. Blending of mixtures was done using a kitchen blender (PB-323T, Pensonic, Malaysia). Each substrate,i.e.vegetable scraps, fish pro-cessing waste, newspaper and onion peels were individually deter-mined for their moisture, carbon and nitrogen content, as well as carbon-to-nitrogen (CN) ratio to verify the ability of these sub-strates acting as carbon and nitrogen source, and as bulking agent.
2.2. Mixture design
Two types of blends, A and B were produced to study on its opti-mum initial conditions of moisture content and carbon-to-nitrogen (CN) ratio for desired composting process. Blend A consisted of vegetable scraps, fish processing waste and newspaper while Blend B contained vegetable scraps, fish processing waste and onion peels. The MINITABÒRelease 14 (Minitab Inc., US) software was
used in determining the optimum proportions for each kitchen waste blend. The simplex-centroid mixture design was chosen for the experiments because all the components have the same range, which between 0–100, and there were no constrains on the design space. The simplex term refers to the geometry form of a triangle when in two-dimensions and tetrahedron when in three-dimensions. The simplex-centroid is more uniformly distrib-uted in the interior of the triangle and helps to detect curvature of response surface. All proportions of all substrates in each mixture were sum to 100% for a mixture load of 100 g. The Minitab soft-ware generated 13 runs for each blend where the moisture content
and CN ratio were determined experimentally for each run prior to generating the contour maps from the fitted regression models with the software.
2.3. Response analyses
The searched responses in this study were moisture content and CN ratio. Analyses were done in triplicates and means are reported. The moisture content was determined using the conventional air oven method (Kato and Miura, 2008; Mohee et al., 2008; Unmar and Mohee, 2008), where each fresh sample was oven-dried at 105°C until it achieved a constant weight (approximately for 24 h). The dried sample was then ground into a fine powder for finding the CN ratio. The percentage of moisture content was cal-culated following Eq.(1)(Schwab et al., 1994)
%Moisture¼WeightWetWeightDry
WeightWet
100 ð1Þ
The ash content was measured using the dry ashing method (Mohee et al., 2008; Unmar and Mohee, 2008) to obtain the volatile solids content prior to acquiring the total organic carbon content. Clean and empty crucibles were placed in a muffle furnace for 1 h at 550°C to ensure that there are no other carbon particles that can affect the readings. After cooling the crucibles in a desiccator, 2.5 g of blended samples were weighed into the crucibles and the samples were burned in the furnace at 550°C for about 2 h or until no stains of black carbon particles. The total organic carbon content was calculated following Eqs.(2)–(4)(Richard, 2007; Mo-hee et al., 2008)
%Ash¼WeightInitialWeightFinal WeightInitial
100 ð2Þ
%Volatile Solid¼100%Ash ð3Þ
%Total Organic Carbon¼%Volatile Solid
1:8 ð4Þ
The total nitrogen determination was measured using the Micro Kjeldahl method (Mohee et al., 2008; Unmar and Mohee, 2008), where 0.15 g of blended sample was weighed and placed in a boil-ing tube. For the blank, no sample was used. 0.8 g of mixed cata-lysts was first added into the boiling tube, then 2.5 ml of concentrated sulphuric acid was added before heating slowly on a heating coil under fume hood for the digestion process to break all the bonds in the sample. The contents were boiled until the solution became clear and gave a blue-green colour. After cooling to about 40°C, 5 ml of distilled water was added and the digested product was transferred into a distillation tube. Five millilitres of distilled water was added to wash any residues left inside the boil-ing tube. Ten millilitres of 45% of Natrium Hydroxide (NaOH) solu-tion was added slowly to separate the two layers of solusolu-tion. The distillation tube was fixed to the condenser neatly. Ten millilitres of 2% boric acid and three drops of indicator were added into a con-ical flask. The concon-ical flask was placed on the distillate platform and the tip of distillation tube was immersed into the acid solution. The distillation unit was run for 120 s. The unreacted boric acid was titrated with 0.05 N Sulphuric Acid (H2SO4) until neutral and
the same procedure was repeated for the blank sample. The per-centage of nitrogen content was calculated following Eq.(5)( Co-dell and Verderame, 1954).
%Total Nitrogen¼1:4ðRSÞN
W ð5Þ
whereRis volume of H2SO4to titrate boric acid (ml),Sis volume of
H2SO4to titrate blank (ml),Wis weight of sample (g), andNis
The carbon-to-nitrogen ratio was determined by dividing the total organic carbon content to the total nitrogen content.
3. Results and discussion
[image:3.595.312.562.85.388.2]3.1. Characterisation of composting materials
Table 1shows the moisture, carbon and nitrogen contents, and the CN ratio for individual composting substrate used. The vegeta-ble scraps have the highest moisture content, followed by the fish processing waste, onion peels and newspaper. As fish processing waste owns high protein content (Rahmi et al., 2008) as well as nitrogen content, it makes a good nitrogen source that supplies nutrient to composts. The CN ratio for newspaper is extremely high while fish processing waste possesses the lowest CN ratio. The newspaper and onion peels could be a carbon source due to rela-tively higher carbon contents of 50.56% and 50.27%, respecrela-tively.
3.2. Fitting for the best model
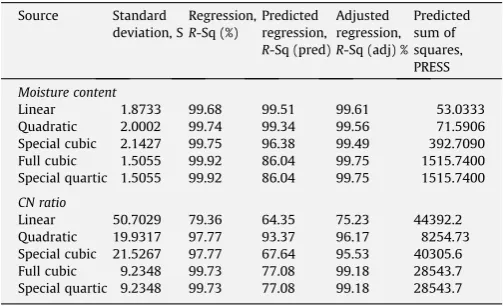
Table 2presents the results of mixture design studies. The inde-pendent variables and the runs were generated and arranged ran-domly by the Minitab software. To minimise variance, the moisture content and CN ratio for each run were triplicated. Both the inde-pendent and deinde-pendent variables were fitted to linear, quadratic, special cubic, full cubic and special quartic models and residuals plots were generated to check the goodness of model fit.Tables 3 and 4present the important values that were examined to deter-mine the adequate model for each dependent variable. Since the standard deviation is important for checking data distribution, the predicted sum of squares for measuring the model’s predictive ability and the predictedR-squared were calculated and compared. The best model has low standard deviation and predicted sum of squares, and high predictedR-squared (Cornell, 2002). Following these guides, the linear model was found the best fitted for the moisture content of both blends while the quadratic model was adequately fitted to the response of CN ratio for both blends.
3.3. Modelling of initial moisture content and CN ratio
Eqs.(6)–(9)show the optimised mixture proportion equations of Blend A and Blend B
YAm¼92:726x1þ75:326x2þ4:862x3 ð6Þ
YBm¼92:85x1þ75:52x2þ11:66x3 ð7Þ
YAcn¼14:9x1þ8:2x2þ281:6x3þ17:7x1x2273:3x1x3
509:3x2x3 ð8Þ
YBcn¼12:28x1þ7:02x2þ60:22x316:07x1x2þ39:5x1x3
49:27x2x3 ð9Þ
Eqs.(6) and (7)are linear terms for moisture content of Blend A and Blend B, respectively. Eqs.(8) and (9)are the quadratic terms for CN ratio of Blend A and Blend B, respectively.YAm is initial
moisture content (%) for Blend A,YBmis the initial moisture content
(%) for Blend B,YAcnis the inital CN ratio for Blend A, andYBcnis the
initial CN ratio for Blend B. The numbers refer to the regression coefficients listed inTable 5, andx1,x2andx3are the three
[image:3.595.311.563.426.579.2]inde-pendent variables, each representing vegetable scraps, fish pro-cessing waste and newspaper or onion peels, respectively.
Table 1 Percentage (%)a
of moisture, carbon and nitrogen content, and CN ratio.a .
Substrates Moisture content (%) Carbon content (%) Nitrogen content (%) CN ratio
Vegetable scraps 93.32 ± 0.33 37.87 ± 1.14 2.94 ± 0.14 12.87 ± 0.24
Fish processing waste 75.83 ± 0.43 42.60 ± 1.73 8.14 ± 1.24 5.30 ± 0.61
Newspaper 6.50 ± 0.32 50.56 ± 0.02 0.18 ± 0.01 288.15 ± 13.36
Onion peels 11.69 ± 0.22 50.27 ± 0.63 0.83 ± 0.01 60.91 ± 1.82
a
Data are in mean and standard deviation.
Table 2
Mixture design and response values for Blends A and B.
Run Independent variables,xij Dependent variables,Y
Vegetable scraps (%)
Fish processing waste (%)
Newspaper or onion peels (%)
Moisture content (%)
CN ratio
Blend A
1 16.667 16.667 66.667 26.12 62.7
2 0.000 50.000 50.000 40.05 24.2
3 100.000 0.000 0.000 93.14 13.0
4 0.000 0.000 100.000 6.73 297.6
5 33.333 33.333 33.333 59.13 24.2
6 0.000 100.000 0.000 75.72 4.7
7 50.000 0.000 50.000 48.02 89.8
8 0.000 100.000 0.000 75.27 4.8
9 16.667 66.667 16.667 66.61 10.5
10 100.000 0.000 0.000 92.97 13.2
11 0.000 0.000 100.000 6.27 278.7
12 50.000 50.000 0.000 83.87 5.8
13 66.667 16.667 16.667 75.40 23.8
Blend B
1 50.000 50.000 0.000 84.74 6.0
2 0.000 100.000 0.000 76.25 5.9
3 66.667 16.667 16.667 76.92 16.7
4 100.000 0.000 0.000 93.68 12.6
5 50.000 0.000 50.000 50.65 50.3
6 0.000 100.000 0.000 76.08 5.7
7 33.333 33.333 33.333 55.60 22.6
8 0.000 0.000 100.000 11.53 59.6
9 100.000 0.000 0.000 93.51 12.7
10 0.000 50.000 50.000 44.72 22.3
11 16.667 16.667 66.667 38.63 36.0
12 16.667 66.667 16.667 65.92 16.2
13 0.000 0.000 100.000 11.84 62.2
Table 3
Model summary statistics for moisture content and CN ratio of Blend A.
Source Standard deviation, S
Regression, R-Sq (%)
Predicted regression, R-Sq (pred)
Adjusted regression, R-Sq (adj) %
Predicted sum of squares, PRESS
Moisture content
Linear 1.8733 99.68 99.51 99.61 53.0333
Quadratic 2.0002 99.74 99.34 99.56 71.5906 Special cubic 2.1427 99.75 96.38 99.49 392.7090 Full cubic 1.5055 99.92 86.04 99.75 1515.7400 Special quartic 1.5055 99.92 86.04 99.75 1515.7400
CN ratio
[image:3.595.42.569.689.743.2]The regression coefficients for all the terms in the optimised models are summarised inTable 5. The magnitudes of the coeffi-cients for the three materials indicate that the vegetable scraps (92.73 and 92.85) have higher moisture content than fish process-ing waste (75.33 and 75.52), newspaper (4.86) and onion peels (11.66). For CN ratio, the coefficients values for the three materials show that the fish processing waste (8.20 and 7.02) have low CN ratio compared to vegetable scraps (14.90 and 12.28), newspaper (281.60) and onion peels (60.22). Since moisture content for both the blends fitted the linear model, the coefficients for two-blend mixtures ofb12,b13andb23did not exist. Positive coefficients for
a two-blend mixtures means that the two materials are comple-mentary and if the two-blend mixtures have negative coefficients, the two materials are opposed towards one another. The mixture containing vegetable scraps (b13) or fish processing waste (b23)
with either newspaper or onion peels produced significant CN ratio withp< 0.05. This suggests that composting of food waste is rec-ommended using either vegetable scraps or fish processing waste singly combined with newspaper or onion peels. TheR-squared (R2) more than 97% indicate that the models chosen fitted the data
very well.
3.4. Mixture proportion optimisation
Using the Minitab software, the optimisation calculations were performed to find an optimum mixture proportions for commence of composting process. Based on the combined optimum initial moisture content and CN ratio of 60 and 30%, respectively, the
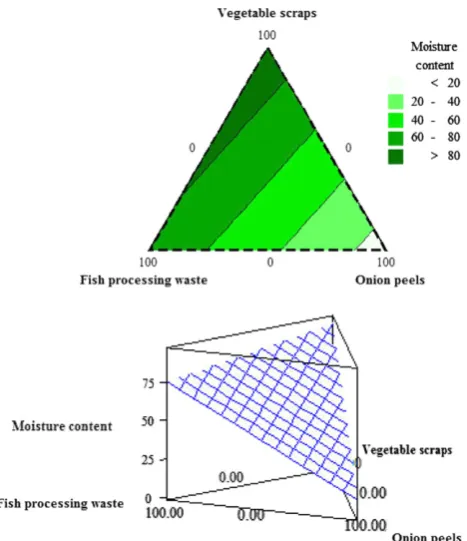
[image:4.595.33.284.85.255.2]fin-est mixture proportions that met the composite desirability of approximately one was obtained.Figs. 1 and 2 show that both blends A and B gave similar results for the contour and surface plots. The newspaper and onion peels offer greater effect in adjust-ing the moisture content. The surface plots show that the lowest moisture content was obtained when mixed with a large amount of newspaper (Fig. 1) or onion peels (Fig. 2).
Table 4
Model summary statistics for moisture content and CN ratio of Blend B.
Source Standard deviation, S
Regression, R-Sq (%)
Predicted regression, R-Sq (pred) %
Adjusted regression, R-Sq (adj) %
Predicted sum of squares, PRESS
Moisture content
Linear 1.9258 99.60 99.47 99.52 48.8388
Quadratic 2.0632 99.68 99.14 99.44 79.0690 Special cubic 2.0107 99.74 96.33 99.47 336.9420 Full cubic 1.6487 99.88 79.85 99.64 1849.3000 Special
quartic
1.6487 99.88 79.85 99.64 1849.3000
CN ratio
Linear 5.9967 92.67 89.44 91.20 518.0090
Quadratic 3.9280 97.80 91.37 96.22 423.4020 Special cubic 3.9664 98.08 71.32 96.15 1406.4500 Full cubic 1.3121 99.86 87.56 99.58 609.7770 Special
quartic
1.3121 99.86 87.56 99.58 609.7770
Table 5
Regression coefficients, R2
for two dependent variables of two blends.
Coefficient Moisture content CN ratio
Blend A Blend B Blend A Blend B
b1 92.73 92.85 14.90 12.28
b2 75.33 75.52 8.20 7.02
b3 4.86 11.66 281.60 60.22
b12 – – 17.70 16.07
b13 – – 273.30* 39.50*
b23 – – 509.30** 49.27*
R2
99.68 99.60 97.77 97.80
Subscripts: 1 = vegetable scraps; 2 = fish processing waste; 3 = newspaper or onion peels.
Blend A consists of vegetable scraps, fish processing waste and newspaper, Blend B consists of vegetable scraps, fish processing waste and onion peels. *Significant at 0.05 level.
[image:4.595.313.545.152.417.2]** Significant at 0.001 level.
Fig. 1.Mixture contour plot (above) and surface plot (below) of moisture content for Blend A.
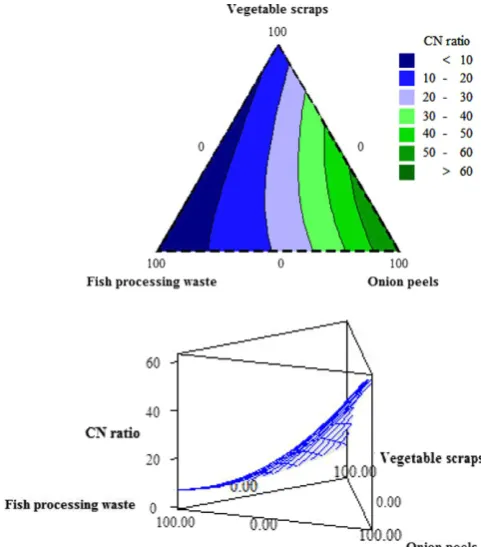
[image:4.595.310.544.457.728.2] [image:4.595.33.284.608.699.2]Fig. 3shows that the area of the optimum initial CN ratio (30) is located at the middle of the contour plot for Blend A. Almost all amounts of vegetable scraps gave optimal CN ratio. The CN ratio in-creases when larger amount of the newspaper is combined but de-creases when large amount of fish processing waste is used. The contour plot inFig. 4suggests that the highest CN ratio is obtained when the amount of onion peels is large. The lowest CN ratio was achieved when the mixture contained more fish processing waste, little or no onion peels, and nearly all or no vegetable scraps.
Fig. 5points up two overlaid contour plots for Blends A and B, respectively, which the mixture components used are three factors. The feasible regions that satisfy both optimum response variables settings are illustrated as the white area inside each plot. These over-laid contour plots are important for finding the best mixture propor-tions for optimising the initial moisture content and CN ratio of the blends and any combinations that fall inside the white area are suit-able for composting. The shaded areas on the graphical optimisation plot refer to responses which do not meet the selection criteria.
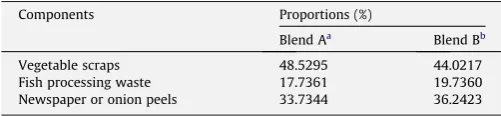
For response optimisation, the combined goals for moisture content of 60% and CN ratio of 30 was satisfied by mixture propor-tions given inTable 6. These solutions provided moisture content of 60% for both blends, and CN ratio of 29.9931 and 29.9980 for Blend A and B, respectively. These predicted responses were cho-sen because they gave the highest composite desirability, which are 0.9997 for Blend A and 0.9999 for Blend B, than other accept-able optimum combinations that fall in the feasible regions in
Fig. 5. The predicted responses and the composite desirability near to one indicate that the optimum initial moisture content and CN ratio was met. Zero composite desirability denotes that one or both responses are outside their acceptable limits.
3.5. Validation of the model
The experimental data were fitted into the Eqs.(6)–(9)and the optimum proportions were found to be 48.5% of vegetable scraps, 17.7% of fish processing waste and 33.7% of newspaper for Blend A, and 44.0% of vegetable scraps, 19.7% of fish processing waste and 36.2% of onion peels for Blend B. At these optimum formulations,
[image:5.595.315.556.66.340.2] [image:5.595.312.554.417.729.2]the moisture content was 61.48% for Blend A and 58.13% for Blend B, which are reasonably close to the predicted value of 60%. These results are comparable to those ofCekmecelioglu et al. (2005)and
Fig. 3.Mixture contour plot (above) and surface plot (below) of CN ratio for Blend A.
Fig. 4.Mixture contour plot (above) and surface plot (below) of CN ratio for Blend B.
[image:5.595.47.292.475.738.2]Sellami et al. (2008)findings, whom reported 61.8–64.2% and 45– 60%, respectively. The CN ratio is quite close to the predicted value of 30, where Blend A gave 33.3 and Blend B gave 30.5. Although the CN ratios were slightly higher than the predicted value, they are still in the range of ideal CN of 20–40 for composting. The moisture content of 50–65% (Arvanitoyannis and Kassaveti, 2006; Chang et al., 2006) and CN ratio of 20–40 (Chang et al., 2006) were ideal conditions for composting.
4. Conclusions
The proportion of each substrate is important to ensure the effi-ciency of composting. Different amounts of vegetable scraps, fish processing waste, newspaper and onion peels gave effect to the ini-tial moisture content and CN ratio of the kitchen waste. The mix-ture design used for predicting this waste recipe prior to composting studies through an optimisation process provides the best condition for degradation process take place.
Acknowledgements
The authors wish to acknowledge the R&D collaborative work of UPM-O3 Solutions (2008–2010) and thank Dr. Chon Seng, Tan from Biotechnology Research Centre, Malaysian Agricultural Research and Development Institute, for their assistance and valuable advice.
References
Arvanitoyannis, I.S., Kassaveti, A., 2006. Current and potential uses of composted olive oil waste. Int. J. Food Sci. Technol. 42, 281–295.
Bhatt, H., 2009. The Great Plastic Headache. The Sun. Available from:<http:// www.sun2surf.com/article.cfm?id=37420> (accessed 17.03.10).
Brandvik, P.J., Daling, P.S., 1998. Optimisation of oil spill dispersant composition by mixture design and response surface methods. Chemom. Intell. Lab. Syst. 42 (1– 2), 63–72.
Cekmecelioglu, D., Demirci, A., Graves, R.E., Davitt, N.H., 2005. Applicability of optimised in-vessel food waste composting for windrow systems. Biosyst. Eng. 91 (4), 479–486.
Chang, J.I., Hsu, T.-E., 2008. Effects of compositions on food waste composting. Bioresour. Technol. 99 (17), 8068–8074.
Chang, J.I., Tsai, J.J., Wu, K.H., 2006. Thermophilic composting of food waste. Bioresour. Technol. 97 (1), 116–122.
Codell, M., Verderame, F.D., 1954. The determination of nitrogen in copper– titanium alloys. Anal. Chim. Acta 11, 40–47.
Cornell, J., 2002. Experiments with Mixtures: Designs, Models, and the Analysis of Mixture Data, Third. John Wiley and Sons, Inc., New York.
Horiuchi, J.-i., Tada, K., Kobayashi, M., Kanno, T., Ebie, K., 2004. Biological approach for effective utilization of worthless onions-vinegar production and composting. Resour. Conserv. Recycl. 40 (2), 97–109.
Huang, Y.-B., Tsai, Y.-H., Lee, S.-H., Chang, J.-S., Wu, P.-C., 2005. Optimization of pH-independent release of nicardipine hydrochloride extended-release matrix tablets using response surface methodology. Int. J. Pharm. 289 (1–2), 87–95. Kato, K., Miura, N., 2008. Effect of matured compost as a bulking and inoculating
agent on the microbial community and maturity of cattle manure compost. Bioresour. Technol. 99 (9), 3372–3380.
Laos, F., Mazzarino, M.J., Walter, I., Roselli, L., Satti, P., Moyano, S., 2002. Composting of fish offal and biosolids in northwestern Patagonia. Bioresour. Technol. 81 (3), 179–186.
Mohee, R., Driver, M.-F.B., Sobratee, N., 2008. Transformation of spent broiler litter from exogenous matter to compost in a sub-tropical context. Bioresour. Technol. 99 (1), 128–136.
Mura, P., Furlanetto, S., Cirri, M., Maestrelli, F., Marras, A.M., Pinzauti, S., 2005. Optimization of glibenclamide tablet composition through the combined use of differential scanning calorimetry and d-optimal mixture experimental design. J. Pharm. Biomed. Anal. 37 (1), 65–71.
Qdais, H.A.A., Hamoda, M.F., 2004. Enhancement of carbon and nitrogen transformations during composting of municipal solid waste. J. Environ. Sci. Health. Part A Environ. Sci. Health Part A Environ. Sci. Eng. A39 (2), 409–420. Rahmi, M., Faid, M., ElYachioui, M., Berny, E.H., Fakir, M., Ouhssine, M., 2008. Protein
rich ingredients from fish waste for sheep feeding. Afr. J. Microbiol. Res. 2, 073– 077.
Rehman, S.U., Paterson, A., Piggott, J.R., 2007. Optimisation of flours for chapatti preparation using a mixture design. J. Sci. Food Agric. 87, 425–430.
Richard, T., 2007. Estimating Carbon Content. Cornell Waste Management Institute. Available from:<http://cwmi.css.cornell.edu/> (accessed 17.03.10).
Sánchez-Arias, V., Fernández, F.J., Villaseñor, J., Rodríguez, L., 2008. Enhancing the co-composting of olive mill wastes and sewage sludge by the addition of an industrial waste. Bioresour. Technol. 99 (14), 6346–6353.
Santafé-Moros, A., Gozálvez-Zafrilla, J.M., Lora-García, J., García-Díaz, J.C., 2005. Mixture design applied to describe the influence of ionic composition on the removal of nitrate ions using nanofiltration. Desalination 185 (1–3), 289–296. Schwab, B.S., Ritchie, C.J., Kain, D.J., Dobrin, G.C., King, L.W., Palmisano, A.C., 1994.
Characterization of compost from a pilot plant-scale composter utilizing simulated solid waste. Waste Manage. Res. 12 (4), 289–303.
Sellami, F., Jarboui, R., Hachicha, S., Medhioub, K., Ammar, E., 2008. Co-composting of oil exhausted olive-cake, poultry manure and industrial residues of agro-food activity for soil amendment. Bioresour. Technol. 99 (5), 1177–1188. Stabnikova, O., Ding, H.-B., Tay, J.-H., Wang, J.-Y., 2005. Biotechnology for aerobic
conversion of food waste into organic fertilizer. Waste Manage. Res. 23, 39–47. Unmar, G., Mohee, R., 2008. Assessing the effect of biodegradable and degradable plastics on the composting of green wastes and compost quality. Bioresour. Technol. 99 (15), 6738–6744.
[image:6.595.32.283.86.144.2]Veeken, A., Hamelers, B., 1999. Effect of temperature on hydrolysis rates of selected biowaste components. Bioresour. Technol. 69, 249–254.
Table 6
Optimum mixture proportions for each blend.
Components Proportions (%)
Blend Aa
Blend Bb
Vegetable scraps 48.5295 44.0217
Fish processing waste 17.7361 19.7360
Newspaper or onion peels 33.7344 36.2423
a
With newspaper.
b