2017 2nd International Conference on Computer Science and Technology (CST 2017) ISBN: 978-1-60595-461-5
Apply Image Technology to Flow Discharge Estimation
Ming-Tsung YEH
1, Yu-Xian HUANG
1, Hao LONG
1,
Chien-Wen LAI
2,b, Deng-Jyi JUANG
1and Yi-Nung CHUNG
1,a*1Department of Electrical Engineering, National Changhua University of Education,
Changhua 500, Taiwan
2Changhua Christian Hospital, Changhua 500, Taiwan
a[email protected], b[email protected]
*Corresponding author
Keywords: Water flow information measurement, Flow discharge estimation, Large-Scale particle image velocimetry.
Abstract. In this paper, an image based approach of the water flow information measurement is proposed. Applying the image based measurement is a safely and efficiently non-contact method. The image based flow discharge estimation method is proposed in this paper. The multi virtual water level probes (MVWLP) method is proposed to estimate water level. This approach mainly applies the color space adjustable technique to reduce noises and uses the adaptive edge detection to extract the water line. Then, the velocity area method (VAM) is applied to estimate flow discharge in this study. The depth-averaged velocity of sampling verticals of the designed transection can be obtained by the image-based surface velocity estimation method denoted large-scale particle image velocimetry (LS-PIV). We convince that the proposed methods are accurate, robust and adaptable enough to overcome multiple conditions.
Introduction
In Taiwan, the central mountain range bisects this island that results in most rivers have short watercourses, small basins and rapid flows. These rivers do not have obvious discrimination of upstream, midstream and downstream section due to the distinctive topography feature. The flow discharge is fewer during the dry season but the flood often happens during the rainy season that is consequent on the climate change. The water flows of rivers also have vast changes in the typhoon and flood situations, and cause great damage to people lives and properties. The water information of rivers includes water flow velocity, water level and flow discharge. The river infrastructures which have bridges, embankments, dams and reservoirs need to apply these types of information to design and plan the disaster prevention. The water resource agency uses the flow velocity and water level to estimate the early water warning and note the downstream residents to evacuate during flood or typhoon. Therefore, to real time monitor the river flow is important.
The VAM divides the surveyed transection of river into several sub-channels, and then calculates the area of each sub-channel and depth-averaged velocity respectively. The flow discharge used by the VAM method is obtained by the summation of product of the area and mean velocity each sub-channel.
Rating Curve of Stage-Discharge Relationship
The rating curve of flow discharge generally used some gauges to estimate in natural rivers before. The flow information was directly measured at favorable time, the base flow condition or steady flow situation. The water velocity usually used the current meter to survey in several vertically cross-sectional points of sub-channel to calculate the depth-averaged velocity. The flow discharge is estimated by the depth-averaged velocity and area of each sub-channel for the specific transection. In this meantime, the water stage is also measured. Then, these gathered data are used to build the relationship of the discharge and water stage. Therefore, the rating curve is a curve of gathered statistics to collect the long-term data about the stage and discharge.
The complexity of rating curves depends on the variations of flow situation, the river reach and regime. These relations are typically created empirically from directly periodic measurement of water stage and discharge. Hence, the rating curves are drew by the gauging station of water information in specific river locations where the investigated environment has quasi-stable river bed and the favorable flow conditions. Subsequently, the rating curve is needed to periodically track or adjust by regular measurements for validating the stage-discharge relationship.
[image:2.612.206.417.546.671.2]The stage-discharge relationship can be unique when the flow stream is assumed uniform for all flow range on the specific surveyed area under all situations. Gathering the direct measurements on the steady condition, the unique relations can produce a rating curve of single-valued relationship as the solid line with extended dotted line shown on Figure 1. However, the river flow do not always keep stable that are fluctuation by the flow condition changes. Discharge measurements are difficult during the high flow condition or extreme situation due to the potential risk of human or the restriction of instruments. Therefore, the really measuring definitions of upper and lower portion of rating curve are generally missing. These parts are always applied by the extrapolations that are subject to cause serious errors. These errors affect the flood management corresponding to the upper curve and water resource arrangement corresponding to the lower curve. The additional measurement method is needed to calibrate and shifts these parts during the extreme flow condition.
Figure 1. The steady flow rating curve and loop rating curve for unsteady flow.
condition is resulted in the water surface slope changed by speedily rising or rapidly falling water level. The water surface slope is obviously steeper during rising stage than the base flow condition that causes to have greater discharge than the extrapolated value from the single-valued rating curve of steady flow. For the falling stage, that has the reverse perspective which has lower discharge. The loop rating curve is used to state this unsteady flow by many researchers. The loop rating curve is obviously distinguished from the single-valued rating curve which is created by an acceleration and deceleration sequence of flood flow [2].
Eq. (1) is used to form a power or polynomial curve for the rating curve which is the most commonly used to treat the discharge as unique curve function of the water stage. The (h-a) presents the effective depth of river on this specific transection. The
coefficient b can be denoted as the slope of the rating curve which is corresponding to the surveyed cross section. In general, this coefficient is influenced by some factors including the depth, width and shape of transection and Manning coefficient, etc. The bathymetry of river bed in the natural environment is generally the shape of parabola that can set the b as 2 [3].
( ) ( )b
Q h =C h a− (1)
Where h is the water stage, Q is the flow discharge, a is the gauge height of zero flow,
and C and b is the calibration constant coefficient. In Taiwan, the stream way is often
changed due to the distinctive topography feature. The river bed of transection is unstable and variable by the extreme flow conditions or artificial dredging. The stage-discharge relationship needs to regularly calibrate by these uncertain situations. That causes the implementation of rating curve has some restrictions. The Velocity Area Method (VAM) can overcome this disadvantage of rating curve and obtain more accurate flow discharge.
Velocity Area Method and Experimental Results
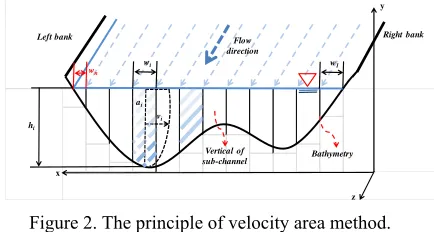
The most popular method of measuring river discharge in open channels is the velocity area method (VAM) that estimates by measuring the cross-sectional area and the mean water velocity. The specific surveyed cross section is divided into several sub-channels. The velocities and depths of sub-channel are sampled at defined positions on its vertical all over the section. The principle of the VAM is shown on Figure 2. Each vertical needs to measure the water depth which is the distance from the surface to the bathymetry, and point velocities that usually survey at 0.2 and o.8 depth to calculate the mean velocity. Then, the segmental discharge is determined as the product of the sub-channel area which obtains by multiplying the water depth by the width of segment, and the average water velocity of subsection. The total discharge is the sum of segmental discharges over the entire subsections of the cross-section as Eq. (2).
1 1 i 1
n n n
i i i i i
i i i
Q
q
a v
w h v
= =
=
==
=
(2)Where Q is the total discharge, qi is the partial discharge, and wi, hi, vi is the width,
sub-channels. In the conventional investigation, the vertical velocity profile and water depth were obtained by the wading measurements. However, to perform this survey is difficult during high flow condition or flood situation. Therefore, the bathymetry of the specific surveyed cross section can be measured in advance under safe condition. The river bathymetry in conjunction with the image based water level measurement and the width of subsection can use to provide the segmental water area. In the natural river situation, the vertical velocity profile can be assumed as ether logarithmic or parabolic distribution. Hence, the mean velocity of each sub-channel can calculate by the water surface velocity of LS-PIV measurement that will detail later.
There are two commonly used integration methods to estimate the water area of subsection that are the mean-section and mid-section method. The mean-section method uses the mean depth as the subsection depth which calculates from two heights of adjacent border of the right and left vertical is similar to the trapeze shape. The mean velocity is the depth-averaged velocity of this subsection vertical. The mid-section method forms a subsection which is a rectangle centered in the border between this subsection and extending to half distance from the adjacent vertical. The subsection depth is the height of the rectangle and the mean velocity is the depth-averaged velocity measured at this rectangle of interest. These two methods are resulted in the same area integrations and also have similar flow discharge. In this study, the surface velocity estimated by LS-PIV is used to calculate the depth-averaged velocity of subsection. Therefore, the mean-section method is proposed to estimate the water area due to the measured subsection of designated transection can be set as the same part with the sampling segment which is corresponding to the LS-PIV surface velocity surveyed region.
Right bank Left bank
y
x
z
hi
wi
vi ai
Vertical of sub-channel Flow direction
Bathymetry wn
[image:4.612.201.418.391.507.2]w1
Figure 2. The principle of velocity area method.
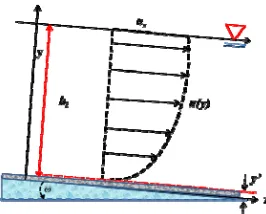
If the vertical velocity profile is universal distribution and is shown as Figure 3, the flow velocity at sampling points along the vertical can be determined by the function of power law as Eq. (3) in an open channel. The u(y) is the surface velocity if the y is equal
to the height hi. The coefficient a and exponent m are the parameters about the type of
Figure 3. The distribution of vertical velocity profile.
' *
' *
( )
( ) ,
m,
s f
u y
y
a
u
ghS
y
k
u
=
y
=
=
γ
(3)Where the u(y) is the vertical velocity at any point where the upward distance is y
from the river bed,
u
* is the shear velocity of bathymetry, Sf is the energy slope,y
'is characteristic distance from the river bad, ks is the roughness height, m is the exponent.' '
*
( )m ( )m
s s
f
u h u h
a a
u = y ghS = y (4)
2 2 1 30 m m s s m f u k h a gS +
= (5)
The empirical coefficient A=30ma / (1+m) can be used to substitute into Eq. (5) and
obtain Eq. (6). In the natural river, the m=1/6 and A=7.68 can be determined by the
Manning Stickler experiential formula. The Manning Stickler formula can be more suitable to use in a gravel river.
2 2 1 (1 ) m m s s f u k h
A m gS
+ =
+ (6)
To acquire the relationship between the surface velocity and depth-averaged velocity, Eq. (3) can be executed integral by the water depth each side as Eq. (7). Then, the right side of Eq. (7) is decomposed and re-calculated to obtain Eq. (8) and can be divided by the water depth h synchronously each side. The result is as Eq. (9) and the
depth-averaged velocity (
v
) is denoted as Eq. (10). The previously equation'
/ 30
s
y
=
k
can be applied to obtain the relationship between the surface velocity and depth-averaged velocity as Eq. (11) [4]. Eq. (12) is used to denote the ratio of vertical averaged velocity to the surface velocity. The k is defined as the velocity correctioncoefficient which uses to convert the surface velocity measured by the LS-PIV to the depth-averaged velocity in conjunction with the image based water level that results to provide discharge.
' '
' ' '
*
( )m
h y h y
y y a
y
u
dy
dy
u
y
+ +
=
'
'
' 1 ' 1
' *
1 ( )
( 1) m m m h y y a
h y y
u
udy
y m+ +
+
+ −
+
=
(8)'
' ' 1 ' 1
' *
1 ( )
( 1)
m m
m h y
y a
h y y
u h y h m
udy
+ + + + − +=
(9)' ' h y y v h udy + =
(10)1
1
1 (30 1) 1
( 1) 30 m
m s
s s
v k h
u m h k
+ + + − +
=
(11),
ss
v
k
v
ku
u
=
=
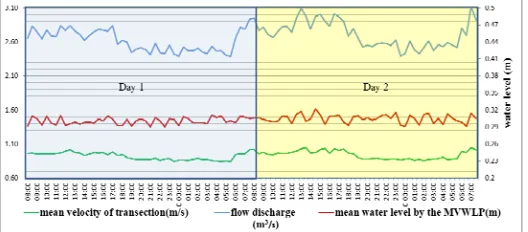
(12) The surface velocities of sampling points of the designated transection in conjunction with the cross-sectional water depth provide the flow discharge for each time stamp. The results are shown as Figure 4 and contrasted with the surface velocities and water levels. The mean cross-sectional surface velocity is 0.9301 m/s and the result of mean flow discharge estimation is 2.6638m3/s. The flow discharge at night time islower than the estimation at day time as the outcome because the surface velocity measurement has fewer detectable particles resulted in the lower flow and poor accuracy. In the 2nd day, the surface velocity is faster and the water depth is slightly
[image:6.612.181.445.420.536.2]raised that produce more flow discharge.
Figure 4. The result of flow discharge estimation.
Conclusions
Acknowledgments
This work was supported by the Ministry of Science and Technology under Grant MOST 103-2221-E-018-017- and MOST 105-2221-E-018-023 -.
References
[1] M. Jodeaua, A. Hauetb, A. Paquiera, J. Le Coza, and G. Dramaisa. “Application and evaluation of LS-PIV technique for the monitoring of river surface velocities in high flow conditions,” Flow Measurement and Instrumentation, Vol.19, Issue 2, pp.
117–127, 2008.
[2] G. Nord, F. Gallart, N. Gratiot, M. Soler, I. Reid, D. Vachtman, J. Latron, J. P. Martín-Vide, and J. B. Laronne. “Applicability of acoustic Doppler devices for flow velocity measurements and discharge estimation in flows with sediment transport,”
Journal of Hydrology, Vol. 509, pp. 504-518, Feb. 2014.
[3] J. L. Coz, B. Camenen, X. Peyrard, and G. Dramais. “Uncertainty in open-channel discharges measured with the velocity–area method,” Flow Measurement and Instrumentation, Vol. 26, pp. 18-29, Aug. 2012.