2017 3rd International Conference on Artificial Intelligence and Industrial Engineering (AIIE 2017) ISBN: 978-1-60595-520-9
Emotion Representation in Whole-brain Functional Connectivity
Patterns: An fMRI Study
Yin LIANG
School of Computer Science and Technology, Tianjin Key Laboratory of Cognitive Computing and Application, Tianjin University, Tianjin 300350, P.R. China
Keywords: Emotion, Functional magnetic resonance imaging, Functional connectivity, Multivariate
pattern analysis, Machine learning.
Abstract. The representation of emotion in human brain is an important question in the cognitive neuroscience. However, it was remained unclear to what extent the connections between different brain regions contribute to the emotion recognition. The present study mainly focused on the emotion decoding based on the functional connectivity patterns. We designed the experiment and collected the neural activities while participants viewed emotion stimuli using the functional magnetic resonance imaging (fMRI) technology. We constructed the whole-brain functional connectivity patterns for each emotion, and performed emotion classification using multivariate pattern analysis combined with machine learning algorithms. We found that emotions could be successfully decoded from the whole-brain functional connectivity patterns. These results provide new evidence that large-scale functional connectivity patterns contain rich emotion information and contribute to the emotion recognition. Our study extends exist fMRI studies on emotion perception and may further our understanding of how human beings achieve easy and quick recognition of emotions.
Introduction
Humans can effectively recognize others’ emotions and make the corresponding reactions. The mechanism under which human brains represented emotion information to achieve the easy and exact recognition of emotions is an important question and was intensively studied.
Functional magnetic resonance imaging (fMRI) technology can accurately locate the increased neural activities in brain areas, providing a wealth of time and space information and does no harm to subjects, thus it was widely used in the cognitive studies. Previous fMRI studies had identified several brain regions which showed preferential activation for emotions. For instance, the superior temporal sulcus (STS) had been identified perceiving faces and bodies [1,2] and exhibited sensitivity to the movements, postures and emotions [3,4], the amygdala (AMG) was considered as a top-down control of the visual responses to fear [5] and the human motion cortex was also found sensitive to dynamic emotion information [5,6]. However, previous studies on emotion perception mainly focused on the activation in single brain regions by measuring the average response signals. As there are certain connections between different brain regions, it remains unclear to what extent these connections contribute to the decoding of emotion information.
Experiment and Data Collection
Experimental Procedure
The emotion stimuli were taken from the GEneva Multimodal Emotion Portrayals (GEMEP) Corpus [7]. Our experiment contained three emotions (joy, anger and fear), which were most adopted in the relevant fMRI studies on emotion perception [5,8,9,10]. Videos of eight identities (4 males) displayed 3 emotions were selected, thus totally 24 videos clips. All videos were cropped to 2 s to retain the transition from neutral to emotion apex and were converted to the gray scale according to previous studies [5,8,9,11] for the consideration of controlling low-level features.
Our experiment employed a block design. At the beginning, there was a 10 s fixation cross, followed by a stimulus block and then a 2 s button press task. Successive stimulus blocks were separated by a fixation cross of 10 s. During each block, 8 trails of the same emotion were presented in a pseudo-random order, with each presented for 2 s separated by an inter-stimulus interval (ISI) of 500 ms. Participants indicated their discrimination of the emotion they had seen in the previous block by pressing a button. The schematic representation of the employed paradigm was shown in Figure1. The scan session included 18 blocks presented in a pseudo-random order, with each emotion category appearing 6 blocks. We used E-Prime 2.0 Professional (Psychology Software Tools, Pittsburgh, PA, USA) to display the stimulus.
Figure 1. Illustration of the experimental paradigm.
fMRI Data Acquisition
Sixteen healthy participants (right-hand, range from 19 to 25 years old) were recruited in this study. They were with normal or corrected-to-normal visions and declared having no history of neurological or psychiatric disorders. All participants signed the informed consent before the experiment and this study was approved by the local ethics committee.
Methods
Preprocessing
Functional images were preprocessed using SPM8 toolbox (http://www.fil.ion.ucl.ac.uk/spm/software/spm8/) before the further analysis of functional connectivity. The first 5 images were discarded to allow for T1 equilibration effects. The remaining images were corrected for slice-timing and head motion. The structural images were segmented and co-registered to the functional data and then the functional images were normalized in the standard Montreal Neurological Institute (MNI) space. And the normalized images were smoothed with a 4-mm full-width at half-maximum Gaussian kernel.
Functional Connectivity Estimation
The estimation of the functional connectivity was carried out with CONN toolbox (http://www.nitrc.org/projects/conn). We employed Harvard-Oxford atlas (96 cortical regions and 16 subcortical regions) to define the 112 brain notes in the whole-brain functional connectivity estimation [12]. For each participant, the preprocessed functional data were used to construct the connectivity patterns. Time series of each condition were extracted from each voxel and averaged within each ROI. Then a component-based (CompCor) strategy was used to remove the non-neural confounders. The data were temporally filtered with a previously used for task-relate connectivity analysis 0.01 – 0.1 HZ band-pass filter [13].We conducted ROI-to-ROI analysis to assess pairwise correlations between ROIs. Finally, we got 3 connection matrices (112 × 112) for each participant, one per emotion. Then we conducted second-level analysis for each emotion for the group comparisons of the functional connectivity (FC) patterns (p<0.001, FDR corrected for connection-level, two-sides).
Classification Scheme
In order to explore whether functional connectivity (FC) patterns effectively represented emotion information, we employed classification scheme to examine the emotion classification performance based on the estimated FC patterns. In accordance with the previous study [13], in this part, we only used positive FCs as inputs, which had values significantly higher than zero with one-sample t-test across participants and corrected with multiple comparisons with false discovery rate (FDR) q=0.01. We performed emotion-pairwise classification (joy VS anger, joy VS fear, and anger VS fear) with a leave one subject out cross-validation (LOOCV) scheme [13,14]. In each iteration, data of one subject was used as testing data while the data of the remaining subjects were used for training. Feature selection was executed using ANOVA (p<0.05) to extract the FCs which were significantly contributed to discriminate different emotions. The feature selection procedure was only conducted using the training data in each LOOCV iteration to ensure the separation of the training and testing data. The overall classification performance for each emotion pair was obtained by averaging the accuracies of all iterations. The statistical significance of the results was generated by the permutation test, in which emotion labels were randomly exchanged and the cross-validation scheme executed for 1000 times. P value was calculated as the fraction of the accuracies from all permutations that were equal to or larger than the actual accuracy using correct labels. If p<0.05, the results were considered to be significant.
Results
Results of FC Patterns
[image:4.612.162.448.141.271.2]For each participant, we obtained 3 FC matrices which contained connections between brain notes for the 3 emotions. Figure 2 shows the second-level analysis results for the group comparisons of the functional connectivity (FC) patterns for each emotion (p<0.001, FDR corrected for connection-level, two-sides).
Figure 2. Group-level results for the FC patterns of each emotion.
Classification Results Based on FC Patterns
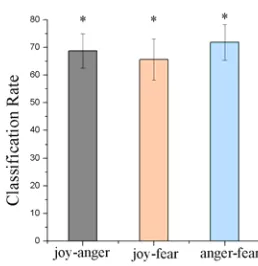
[image:4.612.235.364.405.538.2]Using FC patterns as input, we explore the emotion decoding performance with pairwise classification scheme. Statistical significance was generated through the permutation tests in which the cross-validation was executed on randomly exchanged emotion labels for 1000 times.
Figure 3 shows the accuracies for each emotion-pairwise classification. With the p value calculated across 1000 permutation tests, we found all classification rates were significant, indicating that emotion information could be successfully decoded from the FC patterns.
* represents significant across the 1000 permutation tests
Figure 3. Classification accuracies between each emotion pair.
Discussion
Acknowledgement
This work was supported by the National Basic Research Program (973 Program) of China (No. 2013CB329301), National Natural Science Foundation of China (No.61571327), Shandong Provincial Natural Science Foundation of China (No. ZR2015HM081) and Project of Shandong Province Higher Educational Science and Technology Program (J15LL01).
References
[1] D.Y. Tsao, S. Moeller, and W.A. Freiwald, Comparing face patch systems in macaques and humans, Proc Natl Acad Sci USA. 105 (2008) 19514-19519.
[2] M.A. Pinsk, M. Arcaro, K.S. Weiner, J.F. Kalkus, S.J. Inati, C.G. Gross et al. Neural representations of faces and body parts in macaque and human cortex: a comparative FMRI study, J Neurophysiol. 101 (2009) 2581-2600.
[3] J. Grezes, S. Pichon, and B. De Gelder, Perceiving fear in dynamic body expressions, Neuroimage. 35 (2007) 959-967.
[4] M. Candidi, B.M. Stienen, S.M. Aglioti, and B. De Gelder, Event-related repetitive transcranial magnetic stimulation of posterior superior temporal sulcus improves the detection of threatening postural changes in human bodies, J Neurosci. 31 (2011) 17547-17554.
[5] N. Furl, R.N. Henson, K.J. Friston, and A.J. Calder, Top-down control of visual responses to fear by the amygdala, J Neurosci. 33 (2013) 17435-17443.
[6] N. Furl, F. Hadj-Bouziane, N. Liu, B.B. Averbeck, and L.G. Ungerleider, Dynamic and static facial expressions decoded from motion-sensitive areas in the macaque monkey, The Journal of neuroscience : the official journal of the Society for Neuroscience. 32 (2012) 15952-15962.
[7] T. Banziger, M. Mortillaro, and K.R. Scherer, Introducing the Geneva Multimodal expression corpus for experimental research on emotion perception, Emotion. 12 (2012) 1161-1179.
[8] M. Wegrzyn, M. Riehle, K. Labudda, F. Woermann, F. Baumgartner, S. Pollmann, C.G. Bien, and J. Kissler, Investigating the brain basis of facial expression perception using multi-voxel pattern analysis, Cortex. 69 (2015) 131-140.
[9] M.E. Kret, S. Pichon, G. Grèzes, and B.D. Gelder, Similarities and differences in perceiving threat from dynamic faces and bodies. An fMRI study, Neuroimage. 54 (2011) 1755-1762.
[10] M.E. Kret, S. Pichon, G. Grèzes, and B.D. Gelder, Men Fear Other Men Most: Gender Specific Brain Activations in Perceiving Threat from Dynamic Faces and Bodies – An fMRI Study, Nature Precedings. 2 (2011) 1-11.
[11] H. Kawasaki, N. Tsuchiya, C.K. Kovach, K.V. Nourski, H. Oya, M.A. Howard, and R. Adolphs, Processing of facial emotion in the human fusiform gyrus, J Cogn Neurosci. 24 (2012) 1358-1370. [12] C. Meng, F. Brandl, M. Tahmasian, J. Shao, A. Manoliu, M. Scherr et al, Aberrant topology of striatum’s connectivity is associated with the number of episodes in depression, Brain. 137 (2014) 598–609.
[13] X. Wang, Y. Fang, Z. Cui, Y. Xu, Y. He, Q. Guo et al, Representing object categories by connections: Evidence from a multivariate connectivity pattern classification approach, Hum Brain Mapp. 37 (2016) 3685–3697.