ISSN: 1992-8645 www.jatit.org E-ISSN: 1817-3195
FACTORS INFLUENCING BEHAVIORAL INTENTION TO
USE THE INTERACTIVE WHITE BOARD
AMONG TEACHERS
1LOH WAI LING, 2WAN FATIMAH WAN AHMAD, 3TERMIT KAUR RANJIT SINGH
1
St. Bernadette’s Convent Secondary School, Batu Gajah, Perak, MALAYSIA
2
Department of Computer Information Sciences, Universiti Teknologi Petronas, Tronoh, MALAYSIA
3
School of Educational Studies, Universiti Sains Malaysia, Penang, MALAYSIA
E-mail: [email protected], [email protected], [email protected]
ABSTRACT
The education system around the world has gone through diverse transformation with the introduction, innovation and adoption of the Interactive White Board (IWB). Using the Unified Theory of Acceptance and Use of Technology model (UTAUT) model, countless research exploring the factors that determine the behavioral intentional to use the IWB among teachers have been carried out in western countries. This primary aim of this research is to review and test UTAUT’s applicability in Malaysia by exploring the factors that depict influence on the teachers’ behavioral intention to use the IWB in SMK St. Bernadette’s Convent Secondary School, Batu Gajah in the state of Perak Darul Ridzuan in Malaysia. A questionnaire was distributed to 55 teachers to investigate whether the UTAUT model 4 key constructs , namely
Performance Expectancy (PE),Effort Expectancy (EE), Social Influence (SI) and Facilitating Conditions
(FC) influence the teachers’ behavioral intention (BI) to use IWB. This paper also proposes a new construct for the modified conceptual model for UTAUT; ‘Motivators’(MOT). To determine the reliability, validity and applicability of the revised model, the Partial Least Squares analysis results showed that the independent variables PE and Motivators are positively associated and interrelated to teachers’ Behavioral
Intention to use the IWB, the only dependent variable in this research.
Keywords: Behavioral Intention To Use The IWB, Teachers, UTAUT, Motivators, Partial Least Squares
1. INTRODUCTION
Interactive white boards have gained popularity, are currently being used by teachers in varied settings to replace the ‘chalk and talk’ method of teaching in schools. By utilizing the Unified Theory of Acceptance and Use of Technology model (UTAUT) model, countless research on the factors influencing Interactive White Board (IWB) usage among teachers were extensively conducted in Europe and the United States of America for the past few decades.
The usage of IWBs has been proven to benefit both students and teachers. IWBs provide newer and better interactive teaching tools thus increasing student motivation, displaying attractive graphics, enabling lessons with various audio-visual tools, providing more teaching materials, and also catering to a wide varieties of learning styles. In
and learning environment. With both teachers’ and the students' efforts, the ultimate aim of utilizing an IWB in teaching lessons enhance the student achievement and teachers performance leading to the increase in technology literacy
ISSN: 1992-8645 www.jatit.org E-ISSN: 1817-3195 training to create an effective instructional process
in schools.
Many will agree that the IWB changes the way teachers presenting information to students. The usage of IWB's basic features help teachers presenting materials in a new, exciting way, ensuring that students having fun and remain engaged throughout a lesson. Besides motivating the students as well as engaging students in the instructional process, more collaboration and interaction in the classroom are encouraged thus inculcating in teachers a sense of achievement, advancement, recognition and sense of growth.
Student learning outcomes can be improved, demonstrating an increase in their reliance and adoption on technologies for the purpose of communication and entertainment. Thus, if IWB technology can be utilized effectively in classroom lessons, it will bring about an obvious increase in the level of learning and achievement as students and teachers would be motivated to participate in the process of teaching and learning [5,6].
1.1 Research Problem
The introduction of the IWB in SMK St. Bernadette’s Convent Secondary School (SMC) recently has been met with differing opinions amongst the teachers. Most of the teachers have welcomed this new technology with great enthusiasm and intention to use it whilst some mention that the IWB distracts teaching and learning instructions. Since the introduction of the IWB as one the latest ICT tools for teaching and learning process, not all the teachers are accepting and practicing it as prescribed. The main problem is the IWB is not fully used by SMC teachers to enhance their job performance and to promote student-centered learning in line with the constructivism learning theory. Some still prefer the old methods of chalk and talk teaching and are not motivated to use the IWB.
1.2 Research Objectives
An in-depth study should be to be carried out to explore the factors influencing the BI to use of the IWB for teaching purposes and to enhance student engagement and achievement among the SMC teachers. The constructs set in Venkatesh et al.’s [7] UTAUT Model, was the key instrument used when the data was collected. A new construct, Motivators was also added. Generally, the researchers aim to study the extent to which:
1) PE influences the BI to use the IWB among the teachers.
2) EE influences the BI to use the IWB among the teachers.
3) SI influences the BI to use the IWB among the teachers.
4) FC influences the BI to use the IWB among the teachers.
5) MOT influences the BI too use the IWB among the teachers.
2. BACKGROUND
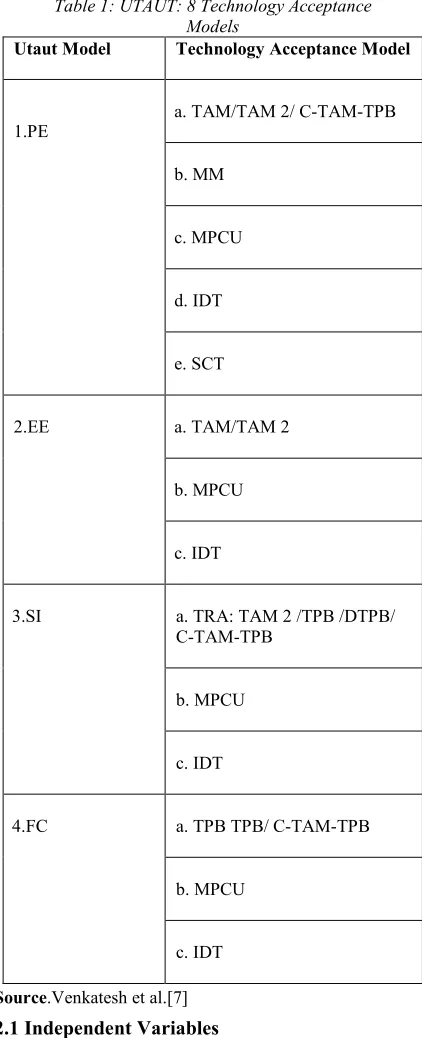
Numerous theories on the BI to employ and adopt new ICT tools including the IWB have been intensively researched. Venkatesh et al.’s UTAUT model, synthesizing several leading information systems (IS) researchers which include the theory of reasoned action (TRA) [8], the theory of planned behavior (TPB) [9], the technology acceptance model (TAM), Model of PC Utilization (MPCU), Innovation Diffusion Theory (IDT), Social Cognitive Theory (SCT), Motivational Model (MM) and finally the UTAUT model which undergoes numerous extensions and modifications. Currently, the IWB adoption is considered to be one the most researched area [10,11] as it is a very useful tool in educational technology acceptance environment [12].
ISSN: 1992-8645 www.jatit.org E-ISSN: 1817-3195 Table 1: UTAUT: 8 Technology Acceptance
Models
Utaut Model Technology Acceptance Model
1.PE
a. TAM/TAM 2/ C-TAM-TPB
b. MM
c. MPCU
d. IDT
e. SCT
2.EE a. TAM/TAM 2
b. MPCU
c. IDT
3.SI a. TRA: TAM 2 /TPB /DTPB/
C-TAM-TPB
b. MPCU
c. IDT
4.FC a. TPB TPB/ C-TAM-TPB
b. MPCU
c. IDT
Source.Venkatesh et al.[7]
2.1 Independent Variables
PE: the degree when teachers believe that their performance will be improved from the usage of the IWB.
EE: the degree of ease which is related to the usage of the IWB.
SI: the degree when teachers perceive that it is important other teachers believe they ought to use
FC: the degree when teachers believe that the existing school administration, organizational and ICT technical infrastructure motivate and support the IWB usage.
MOT: the additional construct includes internal factors which are psychological needs that yield satisfaction and were perceived as an additional benefit that may influence the BI to use the IWB among SMC teachers. Examples of these needs are achievement, advancement, work itself, recognition and sense of growth [13].
3. METHODOLOGY
For this study, the researchers use the exploratory quantitative method. Purposive sampling, a type of non-probability sampling method is also utilized as the 55 SMC teachers’ results will be employed to generalize and postulate the whole population for this initial study of the influence of the IWB on teachers. A seven-point Likert scale printed 31 items questionnaire focusing on the majority of the variables from the UTAUT four key constructs was developed and distributed to the teachers. For the MOT construct, 10 items in Herzberg’s Motivation Hygiene Theory [13] were also used. The questionnaire which consists of a total of 41 survey questions was administered and collected from all 55 SMC teachers involved in this IWB project. Another 10 demographic statements on the user profile were also included for further analysis of the user behavior. The response rate of the survey on the teachers was 100% as all the questionnaires distributed were collected and completed.
ISSN: 1992-8645 www.jatit.org E-ISSN: 1817-3195 4. RESULTS
In order to measure the reliability and validity, a testing on goodness of measures has been conducted. The results has been analyzed with PLS using Smart PLS 3.0 which is widely used in IS research [14, 15]. PLS is used to find the answer to all the numerous interrelated research questions and the impact of PE, EE, SI, FC and MOT on BI to use the IWB.
4.1 Reliability
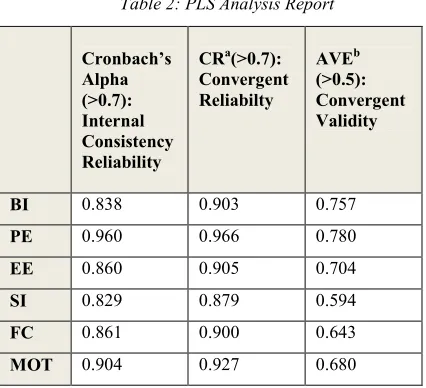
In this study, a test has conducted on the 55 school teachers in SMC who have undergone training to use the IWB in the school. The researchers tested the construct reliability based on the Cronbach’s Alpha Coefficient with the average values each of the constructs: PE (0.966), EE (0.905), SI (0.878), FC (0.900), MOT (0.927) and BI to use the IWB (0.903).
[image:4.612.86.299.495.689.2]To measure the internal consistency of this model, besides using Cronbach’s alpha correlations, the SEM reliability coefficients are also used [16]. For confirmatory analysis, Cronbach’s alpha have to exceed 0.7 [17,18] before it is considered acceptable in technology acceptance literature. The Cronbach’s alpha correlations and composite reliability coefficients in this study are higher than 0.7 showing that the variables reliability of the internal consistency and the PLS analysis are justifiable for this study as shown in Table 2. All the independent variables have high reliability, including the extended construct, MOT. PE has highest figures whereas SI has the lowest.
Table 2: PLS Analysis Report
Cronbach’s Alpha (>0.7): Internal Consistency Reliability
CRa(>0.7): Convergent Reliabilty
AVEb (>0.5): Convergent Validity
BI 0.838 0.903 0.757
PE 0.960 0.966 0.780
EE 0.860 0.905 0.704
SI 0.829 0.879 0.594
FC 0.861 0.900 0.643
MOT 0.904 0.927 0.680
4.2 Construct Validity
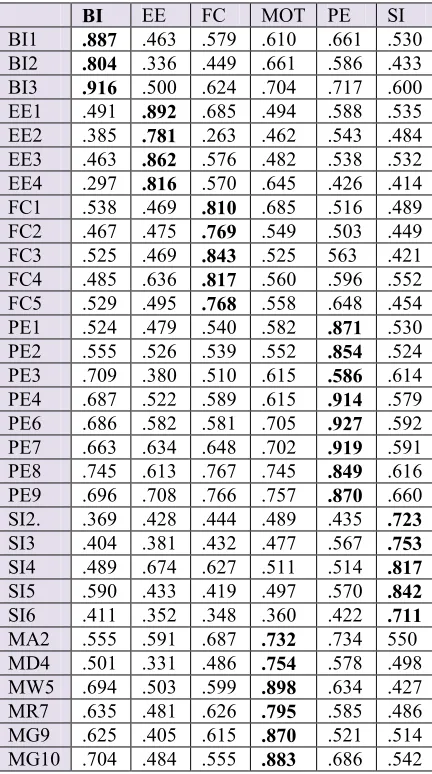
Construct validity evaluates the degree the results obtained from the study fits the test that was designed, especially through the convergent and discriminant validity. Table 3 shows the cross loadings and their respective loadings to determine specific items that face problems when the threshold limit value for the loadings at 0.5 is considered as significance [17, 18].
On the whole, items with loadings more than 0.5 on two or more factors shows that their cross loadings are significant. The items in Table 3 depicts constructs that are highly loaded on their own construct and loaded less compared to other constructs, thus reaffirming construct validity in this study.
4.3 Convergent Validity
ISSN: 1992-8645 www.jatit.org E-ISSN: 1817-3195 Table 3: Loadings (>0.5) and Significant Cross
Loadings
BI EE FC MOT PE SI
BI1 .887 .463 .579 .610 .661 .530
BI2 .804 .336 .449 .661 .586 .433
BI3 .916 .500 .624 .704 .717 .600
EE1 .491 .892 .685 .494 .588 .535 EE2 .385 .781 .263 .462 .543 .484 EE3 .463 .862 .576 .482 .538 .532 EE4 .297 .816 .570 .645 .426 .414 FC1 .538 .469 .810 .685 .516 .489 FC2 .467 .475 .769 .549 .503 .449 FC3 .525 .469 .843 .525 563 .421 FC4 .485 .636 .817 .560 .596 .552 FC5 .529 .495 .768 .558 .648 .454 PE1 .524 .479 .540 .582 .871 .530 PE2 .555 .526 .539 .552 .854 .524 PE3 .709 .380 .510 .615 .586 .614 PE4 .687 .522 .589 .615 .914 .579 PE6 .686 .582 .581 .705 .927 .592 PE7 .663 .634 .648 .702 .919 .591 PE8 .745 .613 .767 .745 .849 .616 PE9 .696 .708 .766 .757 .870 .660 SI2. .369 .428 .444 .489 .435 .723 SI3 .404 .381 .432 .477 .567 .753 SI4 .489 .674 .627 .511 .514 .817 SI5 .590 .433 .419 .497 .570 .842 SI6 .411 .352 .348 .360 .422 .711 MA2 .555 .591 .687 .732 .734 550 MD4 .501 .331 .486 .754 .578 .498 MW5 .694 .503 .599 .898 .634 .427 MR7 .635 .481 .626 .795 .585 .486 MG9 .625 .405 .615 .870 .521 .514 MG10 .704 .484 .555 .883 .686 .542
Item loadings higher than the recommended value of 0.5 are in bold.
4.4 Discriminant Validity
Discriminant validity is depicted when several items differentiate themselves among the measure distinct constructs or concepts. This type of validity can be tested by assessing the interrelations between the constructs measures that are potentially overlapping. The items loadings in this model exceed their own constructs. Besides that, the variance shared between each construct and the other constructs has to be lower than the average variance which is shared between all the constructs [19].
Table 4 depicted the average variance that is extracted by indicators greater than the squared correlations of every key construct indicates the
discriminant validity is adequate. In addition to that, the cross-loadings for all the key constructs with their respective measures are also shown. The bold figures are the own-loadings of each construct which are all larger than 0.7 as compared to the cross-loadings with other measures. In short, the proposed measurement model indicated that not only the convergent validity to be adequate but also the discriminant validity and they are determined y the two PLS indicators below:
(a) the cross-loadings are less than their own-loadings than ;
(b) the correlations with other key constructs are lower than the square root of every construct’s AVE [7].
Table 4: Key Constructs Discriminant Validity
BI EE FC MOT PE SI
BI .870
EE .501 .839
FC .636 .633 .802 MOT .757 .566 .719 .825
PE .755 .633 .706 .753 .883
SI .603 .593 .589 .605 .671 .841
The diagonal bold entries is the square root of AVE whilst the others are its correlations with other key constructs
In short, the construct validity fulfills the quality criteria of this research statistically.
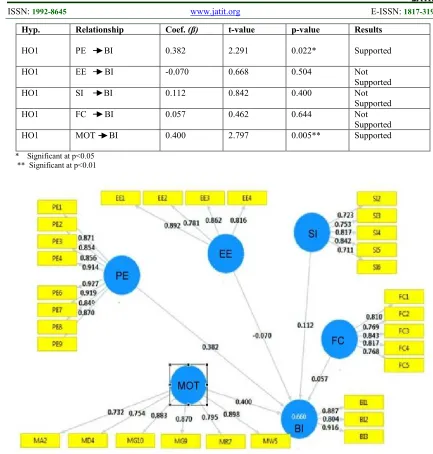
4.5 Hypotheses Testing
These are the hypotheses tested in this study. HO1: PE shows an influence towards teachers’ BI
to use the IWB.
HO2: EE shows an influence towards teachers’ BI to use the IWB.
HO3: SI shows an influence towards teachers’ BI to use the IWB.
HO4: FC shows an influence towards teachers’ BI to use the IWB.
HO5: Motivators (MOT) shows an influence towards teachers’ BI to use the IWB.
ISSN: 1992-8645 www.jatit.org E-ISSN: 1817-3195
Hyp. Relationship Coef. (β) t-value p-value Results
HO1 PE BI 0.382 2.291 0.022* Supported
HO1 EE BI -0.070 0.668 0.504 Not
Supported
HO1 SI BI 0.112 0.842 0.400 Not
Supported
HO1 FC BI 0.057 0.462 0.644 Not
Supported
HO1 MOT BI 0.400 2.797 0.005** Supported
* Significant at p<0.05 ** Significant at p<0.01
[image:6.612.83.516.70.524.2]: New construct Motivators
Figure 1: Results Of The Path Analysis
strongest influence on BI.HO1 and HO5 are also supported due to the R² value of 0.660 demonstrating that 66.0% of the variants are the teacher’s BI to use the IWB.. Moreover the t-value of PE exceeds 1.96, p<0.05 whilst the t-value of MOT exceeds 2.58, p<0.01. Thus, HO1 and HO5 are supported as their p-values are less than 0.05.
To determine the minimum adequate size of a sample size for a study, the 10 times rule of the thumb has been utilized over the years as a guideline. In other words, the minimum sample size must 10 times the maximum amount of arrowheads pointing at any latent variable in the PLS path
ISSN: 1992-8645 www.jatit.org E-ISSN: 1817-3195 In this study, the Behavioral Intention to Use
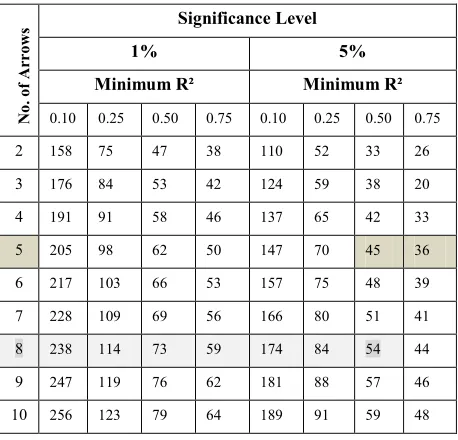
[image:7.612.85.314.314.534.2]construct has 5 arrows, the highest number of arrows pointing at it as shown in Figure 1. In order to reach a statistical power of 80%, Table 6 depicts at 5% significance level and R² of 0.660, a sample size of 36 to 45 is adequate. Thus, this study which comprised 55 samples has fulfilled the minimum requirement of 80% statistical power. If statistical power is high, there is an effect between new construct MOT and BI to use the IWB. Thus, the statistical significance used in most research, reporting only the significant p-value for any analysis is not adequate to understand the results fully as it is also determined by both sample size and effect size [22].
Table 6: Pls-Sem Size Recommendation For 80%. Statistical Power
Source.Cohen, J.[19]
5. DISCUSSIONS
The analysis of the five key constructs in this suggested research model indicated that out of the five hypotheses, two are accepted. PE and MOT have significant relationship with BI whereas EE, SI and FC have no significant relationship with BI. The study concludes that the factors that have an impact on the BI to use the IWB among teachers are PE and MOT. The proposed measurement model thus contributes to a substantial understand of the factors that have an impact on the BI to use IWB among SMC teachers in Batu Gajah, Perak Darul Ridzuan. If teachers’ performance
motivated to use the IWB, this may be able to help them to improve students’ academic performance and achievement. The applicability of the new construct, MOT needs further exploration.
In this hypothesized and extended model, two out of five paths were statistically significant. According to Chin [15], the ideal standardized paths should be above 0.30 even though a coefficient of at least 0.20 would be acceptable in order to be considered as meaningful. This indicates that there is quite a good fitness between results in this study and the UTAUT model. The R-squared value for BI to use the IWB is 0.660. If the sample is larger, this can also be an ideal model that will be of explaining cause and effect of latent variables such as PE, EE, FC, SI and lastly the new construct, MOT and the behavioral intention to use the IWB among SMC teachers in Batu Gajah,
Perak Darul Ridzuan.
PLS analysis which is based on a small number of samples has become among one of the most debated topics recently [20]. When the size of the sample is comparatively small, PLS bootstrapping technique assume each re-sample case will provide a good approximation for the population and necessitates a sample that is not biased. PLS will perform better in smaller samples with less biasness, more reliable and accurate as the effects of its measurement error will be reduced substantially [23]. In short, PLS prioritizes smaller error variance indicators based on their predictive validity, contributing significantly to the measurement of the latent variables and the consistency in assessment criteria of this research model
6. LIMITATIONS
Utilizing the UTAUT model to investigate the usage of the IWB is the latest and the most recent endeavor in the field of education in Malaysia. For this purpose, this study was conducted and it has demonstrated a few limitations that need to be addressed to make recommendations for the future research. The results and its implications, as discussed and mentioned above are all based one single case study, targeting only on a very small sample of teachers in SMC in Batu Gajah, Perak Darul Ridzuan behavioral to use the IWB.
There is not much consensus on the adequate recommended sample size. In order to provide sufficient statistical power to analyze the data, any
N
o
.
o
f
A
rr
o
w
s Significance Level
1% 5%
Minimum R² Minimum R²
0.10 0.25 0.50 0.75 0.10 0.25 0.50 0.75
2 158 75 47 38 110 52 33 26
3 176 84 53 42 124 59 38 20
4 191 91 58 46 137 65 42 33
5 205 98 62 50 147 70 45 36
6 217 103 66 53 157 75 48 39
7 228 109 69 56 166 80 51 41
8 238 114 73 59 174 84 54 44
9 247 119 76 62 181 88 57 46
ISSN: 1992-8645 www.jatit.org E-ISSN: 1817-3195 Unfortunately, only 55 teachers in SMC were
involved in the IWB training and all 55 have become the respondents for this study. A larger sample could not be collected to enable researchers to further validate the results further as this is a one-off training session for the teachers.
Further research should be carried out to evaluate the validity of this modified UTAUT model and the results of this study. A longitudinal study may enhance the understanding of the multiple interrelated variables and their causality which are vital to the acceptance of the IWB by teachers in SMC. Generally, reviewed literature has shown that research related usage of the IWB in the western countries was extensive in the last decade. Nevertheless the findings may not relevant and applicable in the Malaysian context.
7. CONCLUSION
The researchers in this study presents only the preliminary findings of the factors that have an influence or effect on the BI to use the IWB among SMC teachers in Batu Gajah, Perak Darul Ridzuan, Malaysia. A more comprehensive study to compare all the key constructs of the eight pioneer models of the UTAUT and its extended model is recommended in future to explore new constructs besides PE, EE, SI and FC in influencing the usage of the IWB among teachers in the whole country.
This research hopes to provide validity to the applicability of the revised UTAUT theory in Malaysia education system. The model was revised and its constructs were extended by including the
‘Motivators’ construct to explain and predict the BI
to use the IWB. It hopes to provide teachers a better and useful framework to evaluate whether their BI to use the IWB were successful in the Malaysian education system. Education policy designers will be able to pro-actively design training for teachers to motivate them to enhance the quality of education system.
Results from this study also indicated that teachers are positively incline towards further utilization and integration of the IWB to enhance their job performance and student achievement. Teachers in SMC should be sent for continuous training sessions and not only on a one-off basis to further upgrade their IWB knowledge and motivation. This may inculcate a sense of achievement, advancement, recognition and sense of growth in teaching students. Not merely, a qualitative research but also a longitudinal research utilizing the randomized, probability sampling,
should be conducted at the following stages of the study to further understanding additional factors that influence teachers’ BI to use IWB in schools.
In conclusion, it is hoped that teachers will be able to get benefits from the usage of the IWB by fully optimizing it in classroom instruction. Further development, communication, motivation, training are need to design a wider range of the IWB applications so that teachers and students will have an intention to use the IWB for improving academic achievement in the school and also for personal development and satisfaction.. Finally, teachers should also be encouraged to reflect on and given the chance to make decisions about their own perceived IWB development needs on ongoing basis.
8. ACKNOWLEDGMENTS
This research was financially supported by Universiti Teknologi Petronas and Universiti Sains
Malaysia (Short term Grant
:304/PGURU/6312017).The authors also thank the Principal of SMK. St Bernadette’s Convent, Batu Gajah and Teh Thian Lai, the Senior Assistant of SMK Tok Indera Wangsa Ahmad, Batu Gajah for their assistance and cooperation.
REFRENCES
[1] M. De Vita, L. Verschaffel and J. Elen., “Interactive whiteboards in mathematics teaching: A literature review”, Education
Research International, 2014.
[2] K. Swan, J. Schenker and A. Kratcoski, “The effects of the use of interactive whiteboards on student achievement”, Research Center for
Educational Technology, Kent State University,
USA [email protected] , 2010.
[3] D. Maher, R. Phelps, N. Urane and M. Lee,. “Primary school teachers’ use of digital resources with interactive whiteboards”, The Australian context Educational Technology.
Vol. 28, 2012, pp. 138-158.
[4] K.T. Yang and T.H. Wang, “Interactive whiteboard: Effective interactive teaching strategy designs for biology teaching”,
1National Taiwan Normal University 2National
HsinChu University of Education Taiwan, 2012.
[5] A.F. Ibrahim Mohamed and A.K. Abdelmoneim Hassan, “Difficulties facing teachers in using interactive whiteboards in their classes”,
American International Journal of Social
ISSN: 1992-8645 www.jatit.org E-ISSN: 1817-3195 [6] K. Termit and M. Abdul Rashid, “Secondary
students’ perspective on the use of the interactive whiteboard for the teaching and learning of science in Malaysia”, Journal of
Education and Practice. Vol. 3, 2012, pp. 9-14.
[7] V. Venkatesh, M. Morris, G. Davis and F.D. Davis, “User acceptance of information technology: Toward a unified view”, MIS
Quarterly. Vol. 27, 2003, pp. 425-478.
[8] F.D. Davis, R.P. Bagozzi and P.R. Warshaw, “User acceptance of computer technology: A comparison of two theoretical models”,
Management Science. Vol. 35,1989, pp.
982-1003.
[9] M. Fishbein and I. Ajzen, “Belief, Attitude, Intention and Behavior: An Introduction to Theory and Research”, Addison-Wesley,
Reading MA, 1975.
[10] I. Ajzen, “The theory of planned behaviour”,
Organizational Behavior and Human Decision
Processe,. Vol. 50, 1991, pp. 179-211.
[11] P.J. Hu, P.Y.K. Chau, O.R.L. Sheng and K.Y. Tam, “Examining the technology acceptance model using physician acceptance of telemedicine”, Journal of Management
Information Systems, Vol. 16, 1999.
[12] I. Kabakçı-Yurdakul, Ö.F. Ursavaş and G. Becit-İşçitürk, “An integrated approach for preservice teachers’ acceptance and use of technology: UTAUTPST Scale”, Eurasian Journal of
Educational Research, Vol. 55, 2014,pp.21-36.
http://dx.doi.org/10.14689/ejer.2014.55.2 [13] Tan and W. Amna, “Herzberg’s
motivation-hygiene and job satisfaction in Malaysian retail sector: Mediating effect of love of money”,
Asian Academy of Management Journal, Vol.
16, 2011, pp. 73-94.
[14]P.B. Lowry and J. Gaskin, “Partial Least Squares (PLS) Structural Equation Modeling (SEM) for building and testing behavioral causal theory: When to choose it and how to use it”, IEEE
Transactions on Professional Communication,
Vol.5, 2014.
[15]W.W. Chin, “How to write up and report PLS analyse, In V.Esposito Vinzi, W. W. Chin, J. Henseler and H. Wang (Eds.). Handbook of partial least squares: concepts, methods and applications in marketing and related fields,
Berlin:Springer, 2010.
[16] Lai, D. C.-F., Lai, I. K.-W., & Jordan, E. “An extended UTAUT model for the study of negative user adoption behaviours of mobile commerce”, Paper presented at the
Proceedings of the Ninth International
Conference on Electronic Business, 2009.
[17]R. Arumugam, D. Yahya, K. Rozalina.H. Fauzi, O. Sofian and G. Marina, “Technology acceptance on smart board among teachers in Terengganu using UTAUT model”, Asian
Social Science, Vol. 10, 2014.
[18] U. Sekaran and R. Bougie, “Research methods for business: A skill building approach”, Wiley, UK, 2010.
[19] J.F. Hair, W.C. Black, B.J. Babin and R.E. Anderson., “Multivariate data analysis”,
Prentice-Hall, Upper Saddle River, 2010.
[20] M.J. Vilares, P.S. Coelho, “Likelihood and PLS estimators for structural equation modeling: An assessment of sample size, skewness and model misspecification effects.
[20] M.J. Vilares, P.S. Coelho, “Likelihood and PLS estimators for structural equation modeling: An assessment of sample size, skewness and model misspecification
In J.LitadaSilva., Caeiro , I.Natário , C.A. Braumann (Eds.), Advances in regression, survival analysis, extreme values, Markov processes and other statistical applications”,
Berlin, Germany: Springer, 2013, pp. 11–33.
[21] Hair, JF, Hult, GTM, Ringle, CM & Sarstedt, M , “A primer on partial least squares structural equations modeling (PLS-SEM)”, Sage, Los Angeles, 2014.
[22] N.S. Pratyush and H.K. Kevin, “A Comparison of PLS and ML Bootstrapping Techniques in SEM: A Monte Carlo Study”, paper presented at the 7th International Conference on PLS and
Related Methods in Houston, 2012.
[23] C. DiStefano,, M. Zhu and Mîndrilă, Diana, “Understanding and Using Factor Scores: Considerations for the Applied Researcher”,
Practical Assessment, Research and Evaluation,
Vol.14, 2009, ISSN pp. 1531-7714. Available online:
http://pareonline.net/getvn.asp?v=14&n=20. [24] T. Teo, “Using Structural Equation Modeling
(SEM) in Educational Research: practices and Issues”, International Journal of Applied