ISSN: 1992-8645 www.jatit.org E-ISSN: 1817-3195
306
DISCREET RISK-MODELS OF THE PROCESS OF THE
DEVELOPMENT OF VIRUS EPIDEMICS IN NON-UNIFORM
NETWORKS
VICTORIA VIKTOROVNA ISLAMGULOVA
Voronezh State Technical University,
Moskovsky prospect, 14, Voronezh, 394026, Russian Federation
ALEXANDER GRIGORYEVICH OSTAPENKO
Voronezh State Technical University,
Moskovsky prospect, 14, Voronezh, 394026, Russian Federation
NIKOLAY MIKHAILOVICH RADKO
Voronezh State Technical University,
Moskovsky prospect, 14, Voronezh, 394026, Russian Federation
RUSLAN KALANDAROVICH BABADZHANOV
Voronezh State Technical University,
Moskovsky prospect, 14, Voronezh, 394026, Russian Federation
OLGA ALEXANDROVNA OSTAPENKO
Voronezh State Technical University,
Moskovsky prospect, 14, Voronezh, 394026, Russian Federation
ABSTRACT
The presented paper discusses networks with a non-uniform node degree during the development of a virus epidemic. The study is based on a layerwise simulation of a process of a virus infection of a non-uniform network. That approach is quite novel and less studied, but its practical application seems promising. The feature of the proposed model is that all nodes are divided into layers, which provides a certain hierarchy consideration of a network in the context of its infection. It was established that the process of an epidemic can develop by various scenarios: upward, downward, along layers and, finally, in all mentioned directions. For calculations we proposed to use a matrix with layerwise internal coherence of a network. That matrix allows to considerably simplify calculations. As the result of the study we obtained analytical expressions for the calculations of risk, damage and epidemic resistance on that basis. The results allowed to propose a generalized flowchart of the algorithm of layerwise simulation of an epidemic process in a network ("star parade" algorithm). That algorithm has a number of advantageous properties: a possibility to consider several sources of infection, heterogeneous value of nodes, mutations of a virus during an epidemic process, correction for a ratio of infected nodes at various stages of analysis.
Keywords: Risk, Networks, Epidemic Resistance, Fractal, Epidemic.
1. INTRODUCTION
Paradigmatic models of epidemics [9-23] are of explicit analogous nature. However, in reality the processes of epidemics are discreet. Each node of a network transfers to one of discreet stages: infection, recovery, etc. Therefore, models, which describe those processes, must be discreet.
At that, those models in fact must solve a problem of virus protection of an analyzed object, i.e. evaluate its security towards possible epidemics. Often a criterion of that evaluation is risk, as a possibility of damage of a certain value. The damage in that case is a relative quantity and quality of infected elements of an object at each
stage of a process of development of an epidemic. It is proposed to discuss the result of the presented work exactly in that context.
The development of that kind of models for network structures is of big interest. As is well known, there is a certain variety of types of networks.
ISSN: 1992-8645 www.jatit.org E-ISSN: 1817-3195
307 relationship of distribution of degree of its nodes P(k), which is different from the constant of grid-type networks, is of interest. At that, the ratio of k-degree nodes P(k) can be exponential, power and other relationship of k [9-23].
2. METHODOLOGY OF DEVELOPMENT OF THE MODEL OF A NETWORK
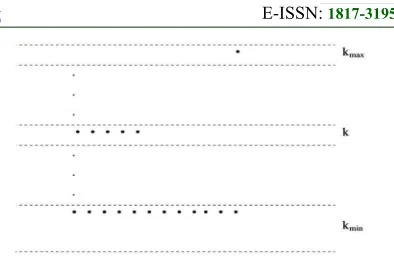
For convenience, a network can be formally divided into layers by degrees of k values. That technique is presented in Figure 1. That approach is natural because the stratification of nodes of a network is provided by the distribution kit P(k) itself.
The number of layers M k k is
defined by the total number of nodes of a network N, and P(k) – by a law of distribution of its nodes degree. For example, kmin can reach 1, and kmax can be found from the following expression:
P k .
From that for exponential distribution:
kmax = lnN,
and for power distribution:
k √N,
where γ = 2÷3.
However, let us leave the types of laws of distribution of ratio of nodes with a specified degree P(k) for the time, and mark out only one of their features: the higher the degree, the lower the number of that kind of nodes N.
The proposed layerwise formalization (Figure 1) allows to carry out a certain hierarchical consideration of a network in the context of its infection. At that, the process of an epidemic, theoretically, can develop in various directions:
- upward (from an infected node of the layer k to nodes of higher levels (k+1), kmax;
- downward (from an infected node of the k-layer to nodes of lower levels (k-1), kmin;
- along access layers (from one infected node of the k-layer to other nodes of adjacent access layers);
[image:2.612.323.520.75.203.2]- finally, in all of the mentioned directions simultaneously, which is the most probable without access restrictions.
Figure 1. Multilayer Representation Of Non-Uniform Networks
It is appropriate to discuss each of these variants, while evaluating the risks of infections of nodes of a network and their epidemic resistance. At that, in the latter case the practical restrictions on the communication between members of different layers of a network (especially a corporate one) should be taken into consideration. For example, nodes of the k-layer can interact with nodes of specified layers, for instance, with variety of (k± r)-layers.
In this regard, it seems important to obtain residual equations and their resulting parameters and characteristics for the whole variety of epidemics (SI, SIS, SIR etc.). At that, it is possible to develop discreet models of development of a process of an epidemic in a discussed class of networks. It is related to the fact that all conditions of nodes are discreet. Each of nodes is either subjected, infected, recovered, immunized, etc. Therefore in intervals, which are commensurable with the incubation period of infection, the discussed process can be discretized, which was carried out in previous studies [3], [4], [6].
A problem of the probability of infection of a single node is worth being discussed. In grid networks, where all nodes can be considered practically identical, these probability is constant p = const. In networks with distribution of their node degree that is not observed. Often the degree of protection is reversely proportional to the uniqueness of a node. Therefore, as a variant, the probability of infection of a node of that kind of network can be expressed as follows:
pk = akP(k), (1)
where ak – coefficient considering the degree of danger for the k-layer of a discussed type of infection.
ISSN: 1992-8645 www.jatit.org E-ISSN: 1817-3195
308 must be carried out for various directions of the development of epidemics.
Not all nodes are in equilibrium in a network. It is mostly possible for grid networks, but for complicated networks (with distribution of its node degree) weights of nodes increase with the increase of their uniqueness P(k). Therefore, in the context of risk-analysis and evaluation of damage, weight (value) of a node of a network must be considered layerwise. Thus, for the k-layer:
δ ≅ . (2) Multiplier [beta] can be defined as follows. Total value of nodes of a network layerwise:
C ∑ δ n ,
where = NP(k) – the number of nodes in the k-layer.
After substitutions:
C ∑ NP k .
Thus
β !,
where (MN) – potential of a network.
Expression (2) may be useful for the evaluation of an epidemic resistance of weighted numbers.
The evaluation of the correlation properties of a network in terms of the adjacency of its nodes exactly in the context of a discreet description of the process of propagation of epidemics is also of some interest.
From the point of view of objects of the study, the aforementioned problems can be divided into the necessity of an analysis of a process of epidemics in the following types of non-uniform networks of finite and infinite size:
- ultrasmall – "small worlds" type networks;
- exponential networks with P(k)~exp(-k);
- scaleless networks with P(k)~ k-γ;
- spatial (Poisson) fluctuations with P k "#
!e&".
Considering a process of infection sequentially, it is necessary, first of all, to underline that probability to infect the k-layer is equal to:
Pk = pkP(k),
where P(k) – probability of infection, which is attacking a network, to enter its k-layer;
pk – probability of damage of a single node belonging to the k-layer (1).
That situation is presented in Figure 2.
Figure 2. Model Of The Damage Of A Node In The K-Layer By A Virus
Thus, the risk of zero stage (beginning of epidemics) is as follows:
Risk[0] = Pkδk,
then, after substitution of expressions (1) and (2):
Risk*0, P k *a P k , .P k / a β P k ,β
i.e. the risk at that stage is proportional to ak,
[beta] and P(k).
On the basis of the proposed approach residual equations for the further stages of a process of an epidemic can be derived. At that, it is desirable to take into account the effect of coherence of layers. For example, in a case of a random distribution of links between layers in a network, the number of contacts of a node of the k-layer with nodes of the s-layer can be calculated as follows:
1 k|s ≃ 4P s , (3)
for each K rounding must be carried out in order to:
5 1 4|6 4.
89:
; 8<=
degree s must be in the boundaries:
k > s > k . (4) If ∑E FBCD K k|s @A, then nodes of the k-layer will tend, in their links, to layers with degree higher then k (s>k). If ∑ &BGHK k|s @A, then they tend to s<k. The first case is frequent in social networks and the second case – in technological networks.
In that regard a sector preferentially contacting with the k-layer can be defined by the inequalities:
- for upward oriented infection:
k I s @ k; (5)
- for downward oriented infection:
k @ s I k ; (6)
ISSN: 1992-8645 www.jatit.org E-ISSN: 1817-3195
309 S = k.
The latter case is possible if the k-layer contains more than k nodes, i.e.:
n NP k @ k. (8)
In that case it is possible that the number of infected modes can be found through a binominal distribution:
P r, k LM4NpP 1 p &P,
where r = 1(1)k – possible number of infected nodes. In fact, its average can be defined by means of statistical expectation:
I*1, *p k, (9) Then, damage in the k-layer at the first step will be equal to:
u*1, δ *p k,.
In turn, the number of nodes, which were not infected in the first step:
S*1, 4 u*1,, Therefore the effect of the protection is:
v*1, δ *VW 4 , *p k, . (10)
Thus, [1,2,25] epidemic resistance of the k-layer at the first stage of an epidemic is:
N *1, X* ,Y* , *Z[ ,&*\# ,
*\# , . (11)
In that case the weight of nodes doesn't play an important role, because the process is occurring in one layer. The last expression (11) can be easily
developed for a random number of discrete steps of a process of an infection, because all processing are occurring in the k-layer.
The case with the propagation of an infection along a layer of a network is a particular case, and that's why in that case using of binominal distribution is sufficient [24], [8], [25]. For the propagation in a fantail manner (the most possible scenario of the development of an epidemic) it will be necessary to use polynomial distribution.
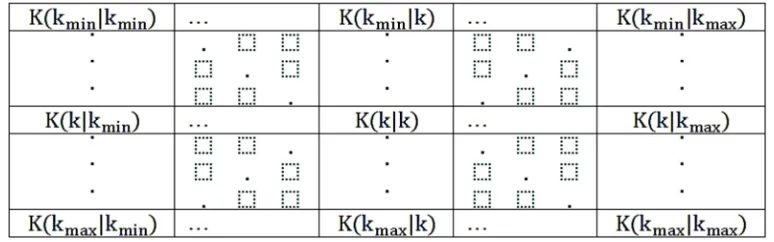
[image:4.612.112.499.406.527.2]Let us preliminary define the coherence of layers of a network; in order to do that let us create the corresponding table.
Table 1. Matrix Of Layerwise Coherence In The Network
That matrix has a number of properties. In particular, the sum of the elements of each of its rows is equal to the number of a raw, i.e.
5 K k|s k.
BCD
E BGH
also, the matrix ||K|| is symmetric relatively to diagonals:
K i|j K j|i ; i, j k 1 k .
2.1. Development of the macro-model
Let us use that matrix in the further discussion.
Let us presume that in the network there are M = {k , …, k } layers, and an infected node of
degree k can interact with those layers according to ||K|| – the matrix of layerwise coherence inside the network. Then, the probability that it will contact in these layers, correspondingly, with k , … , k (according to a polynomial law by a corresponding raw of matrix ||K||) will be equal to:
P_K k|k … K k|k … K k|k `
P_k , … , k ` a!… b!! #, (12)
where kE K s|k at s k 1 k , at that
k , … , k – not negative integers, such as k c ⋯ c
k k.
ISSN: 1992-8645 www.jatit.org E-ISSN: 1817-3195
310 Thus, it seems possible to calculate the expected number of infected nodes in the s-layer (at the first stage):
IE*1, *pEkE,, (13)
as well as the value of the damage in the s-layer: uE[1] = [pEkE]δE, (14) where [pEkE] – integer part of mathematical expectation of the number of infected (at contact with k-node) nodes of the s-layer. In total damage at the first stage of the process of an epidemic:
u*1, ∑f BCDBGH*uE,. (15) In further, let us define the number of nodes of the s-layer, which were not infected:
SE*1, * 1 pE kE,. 16 As a result, we obtain the expected effect from a virus protection in the s-layer at a first stage of an epidemic:
vE*1, = *NP s ,δE [(1-pE)kE, δE. (17) In total, an effect of an antivirus protection at a first stage is:
v[1] = ∑f BCDBGHuE*1,. (18)
Epidemic resistance [1, 2, 25] can be found as the ratio of (17) and (18).
N E*1,
* E ,&∑#BCDh i #BGH*\j j,kj
∑h i #BGH#BCD * &\j j,kj . (19)
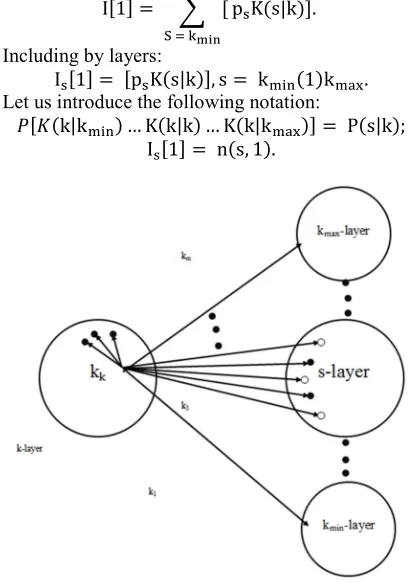
The presented procedures must be carried out for each of infected nodes (considering its belonging to a layer and its correlation links), and obtain a result for a second stage etc. In fact, that will form a fractal of a model (Figure 3).
As for the risk for the given (Figure 3) fractal (i.e. at the first stage of an epidemic process), it will be equal to:
Risk*1, P_K k|k … K k|k …
K k|k ` ∗ 5 IE*1,δE. 20
BCD
f BGH
The total risk at the first stage is equal to:
Risk∑*1, Risk*0, c Risk*1,.
In further a process of an epidemic, from the point of view of topology, will be a parade of this kind of fractals, where nodes, which had been infected at a previous stage of the process, act as a center of a star (Figure 3). Thus, at the first stage by a binominal procedure the number of nodes is:
I*1, 5 * BCD
f BGH
pEK s|k ,.
Including by layers:
IE*1, *pEK s|k ,, s k 1 k .
Let us introduce the following notation:
W*1 k|k … K k|k … K k|k , P s|k ;
[image:5.612.312.517.184.477.2]IE*1, n s, 1 .
Figure 3. Fractal Of The Layerwise Epidemic Discreet Model Of A Network With Consideration Of Coherence Of Its Layers. The Star Of The Layerwise Propagation Of
An Infection From A Node Of K-Degree
In the framework of that notation let us develop a discreet model of a process of an epidemic at the second stage (Figure 4). It illustrates the work of secondary sources of infections, in particular, on an example of one of them in the s-layer.
At the first stage we are dealing with a phenomenon of one star (Figure 3) with a center in one of the nodes of the k-layer. At the second stage we are dealing already with a "constellation" of secondary sources of infection. One of the multiplicity of that stars can be seen in Figure 3. Probability of flashing of that star in a node of the s-layer will have a polynomial mechanism (12), and correspond to ||k||-matrix.
ISSN: 1992-8645 www.jatit.org E-ISSN: 1817-3195
311 Constellation of secondary infections is formed on the basis of multiplicity of infected nodes I[1], which are centers of these stars.
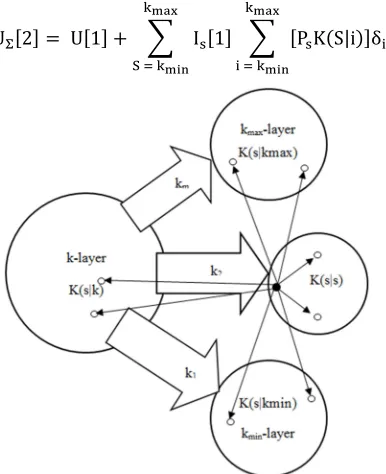
Damage, which occurs at "flashing" of the discussed star, by analogy, with (13) – (15) will be totally equal to:
UE*2, IE*1, ∑ BCDBGH*pEK S|i ,δ.
Thus, for "star parade" in total it will be equal to:
Uo*2, U*1, c 5 IE*1,
BCD
f BGH
5 *PEK S|i ,δ
BCD
BGH
[image:6.612.99.292.215.452.2].
Figure 4. Illustration Of A Second Stage Of A Process Of An Epidemic, In Which Secondary Sources Of Infection
Operate (Vectors K1 … Kn Illustrate Links At The First
Stage Of The Process)
Here "star parade" is the process (Figure 4) of the formation of their multiplicity on the basis of the secondary sources of an infectionIE*1,, which were formed at a first step of an infection for all layers of a network S k 1 k . That effect is the basis of absence epidemic threshold in non-uniform
networks [9-23], and their low epidemic resistance [1, 2, 25].
On the basis of the aforementioned, it is possible to evaluate the risk of that event by a total of products of possibilities of corresponding damages:
Risk*2, Risk*1, c 5 PEUf*2,
BCD
f BGH
.
Thus, epidemic resistance at the second stage:
N*2, C UU o*2,
o*2, ,
where C – total value of all nodes of a network.
By analogy, at a random step (j+1) considering calculations at j-step:
Uo*j c 1,
Uo*j, c 5 IE*j,
BCD
f BGH
5 K S|i δ ; BCD
BGH
21
Risk*j c 1, Risk*j, c 5 PfUf*j c 1,;
BCD
f BGH
22
N*j c 1, C UU o*j c 1,
o*j c 1, , 23
where:
Uf*j c 1, If*j, ∑ BCDBGH*pEK S|i ,δ.
ISSN: 1992-8645 www.jatit.org E-ISSN: 1817-3195
312
[image:7.612.98.296.120.626.2]2.2. Algorithm of the simulation
Figure 5. Generalized Flowchart Of The Algorithm Of Layerwise Simulation Of An Epidemic Process In A
Network ("Star Parade" Algorithm)
Analytical expressions (20)-(23) are quite cumbersome; therefore it is appropriate to develop an algorithm for the numerical calculation of the proposed discreet model, including features of
layers, on the basis of the proposed fractal (Figure 4).
Corresponding flow chart of the algorithm is presented in Figure 5.
In fact the algorithm must provide calculation by "star parade", where the basis (fractal) is the risk-analysis of the star of links between the layers of an infected node of a network, which is provided in cycles with firework like propagation of an infection. Strictly speaking, that process is not branching, especially, at latter stages of an epidemic. In that regard, it is appropriate to add correction at every step of the calculation, which will consider the current ratio of infected nodes in the total number of nodes, i.e. PEθ, where θ tj*u,.
2.3. Development of the micro-model
Development of fractals of infections in a uniform medium of a single layer is a special problem. The case is that analogous expressions are obtained from the presumption about a binominal distribution of probability of infection [7], where mathematical expectation is defined as a product of a single infection on the number of nodes, which contacted with "disease". Strictly speaking, this situation is quite widely spread for homogeneous and heterogeneous networks. Although, infection agents can mutate, and probabilities of infection will change with them, which is not considered by analogous epidemic models [9-23].
Therefore, the development of a generalized fractal, which is simulating a process of infection at micro level, is of real theoretical and practical interest. Let us call it micro-fractal, and the star of propagation of an epidemic is macro-fractal.
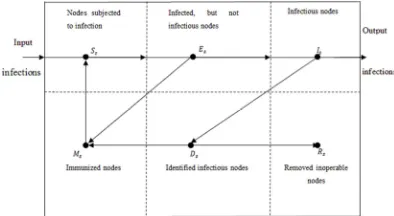
In general, that fractal will consist of several sections of one layer (Figure 6); top sections belong to infection process, bottom section – to recovery process.
Between sections there are probabilistic processes, which are transferring nodes (by their discreet conditions) from one multiplicity to another:
SE – multiplicity of not infected, but subject infection nodes in the s-layer;
EE – multiplicity of infected nodes in the s-layer, which are incapable to spread infection (incubation);
IE – multiplicity of infected nodes of the s-layer; Beginning
End Input of data C,N,||K||,kmin,kmax,psnθs, where s =
kmin(1)kmax
Introduction of specification for a number of steps R
Calculation of Ps, for each raw of matrix ||K||
Calculation of U[1],Risk[1],I[1],N[1]
Introduction of θ-correction
Introduction of correction for mutation of the
virus ps-ps’
Input of data Risk[R] and N[R] Number of steps
ISSN: 1992-8645 www.jatit.org E-ISSN: 1817-3195
313 DE – multiplicity of identified infected nodes in the s-layer;
RE – multiplicity of lost nodes of the s-layer, which lost operability as a result of infection;
ME – multiplicity of priorly infected nodes as a result of recovery EE and IE.
Obviously, E-section is an incubator of an infection, and D-section is a hospital for healing from it. Cycles of both processes must be in the time framework of a discretization model, i.e. incubation period and length of recovery must be less than its discreet step.
[image:8.612.101.288.382.462.2]This micro-fractal (Figure 6) is called generalized paradigmatic model due to the fact that from this structure it is possible to obtain all known paradigmatic models by exclusion of some of its elements. For example, by neglecting incubation nodes and directly connecting S and I, and not calculating immunization of nodes (corresponding processes are removed), a relatively simple SIR-model can be obtained.
Figure 7. Linear Graph Of Micro-Fractal
Figure 6. Generalized Paradigmatic Model Of The Effect Of A Virus Arrack Of Nodes In Uniform Layer
(Micro-Fractal)
From another point of view, if we presume that with time or due to appearance of a new virus immunized nodes lose their properties and transfer to S-submultiplicity, in fact, it is possible to obtain MSEIR model.
Therefore, on a basis of the proposed fractal (Figure 6), it is possible to apply any known paradigmatic model in description of epidemic processes. The problem, in fact, is only in the calculation of the probability of ps for them. At that, the issue consists in virus actions coming to input, and it is important to carry out probabilistic evaluation of the number of secondary sources of infection at output.
Let us use the graph (Figure 7), in which the following notations are used:
|SE| – cardinality of a set SE; |EE| – cardinality of a set EE;
|IE| – cardinality of a set IE; |ME| – cardinality of a set ME; |DE| – cardinality of a set DE;
|RE| – cardinality of a set RE;
KEE |fjE| – the ratio of receptive nodes in the s-layer;
pfx s – the probability of a single infection of a receptive node in the s-layer;
pyfx s 1 pfx s – the probability of that a receptive node of the s-layer will not become infected, but obtain immunity for a given infection;
pxt s – the probability of that an infected node of the s-layer will become infectious;
py s 1 pxt s – the probability of that an infected node of the s-layer will recover and obtain immunity;
pt s – the probability of that an infectious node of the s-layer will become a secondary source of infection;
pyt s 1 pt s – the probability that an infections node will be identified in the s-layer and will be subjected to healing;
pz s – the probability of that an identified infectious node of the s-layer will be healed and obtain immunity;
pyz s 1 pz s – the probability of that an identified infectious node of the s-layer will not be healed and lost operability;
[image:8.612.95.292.518.626.2]ISSN: 1992-8645 www.jatit.org E-ISSN: 1817-3195
314 py f s 1 p f s – the probability of that an immunized node of the s-layer will remain immunity;
The actual graph (Figure 7) is a reflection of functional links of the micro-fractal (Figure 6) and resulting residual equations:
|SE| |I E|KEEc p f s |ME|;
|EE| |SE|pfx s ; |IE| |EE|pxt s ; |I{Y|| |IE|pt s ; |DE| pyt s ;
|RE| |DE|pyz s ;
|ME| |SE|pyfx s c |EE|pyxt s c c|DE|pz s
c |ME|pyz s .
According to Meason equation, transfer from input to output (probability ps) is equal:
pf KEE1 Lpfx s pLxt s pt s
A L~ L•, 24
where: L p f s pyxt s ;
LA py f s ;
L~ pfx s pyxt s p f s ;
L• pfx s pxt s pyt s pz s p f s .
From (24) the number of the secondary sources of infection at output of s-layer will be equal to:
|I{Y| E| pfK k|s ,
|I{Y|E| K k|s – the number of the nodes of the
s-layer attacked by virus (from the k-layer) .
The model proposed in Figures 6 and 7 can be modernized for other paradigmatic structures like SIR, SIRS etc. [24] by means of its simplification.
3. RESULTS AND DISCUSSION
Network security nowadays is becoming a topical problem in conditions of wide-scale confrontation in networks; virus attacks aimed at the creation of epidemics often become one of tools in these confrontations. Their acuteness in many aspects depends on the structural and functional features of attacked networks, and in this regard the orientation of the presented study on non-uniform networks is quite relevant.
Characteristic feature of the results obtained in the presented study is, first of all, the rejection of analogous modeling and discussion of a process of an epidemic as a sequence of stages, which allowed not only change the methodology of analysis, but also carry out the required algorithmization.
The proposed algorithm has the following features (as compared to analogous models of Pastor-Satorras, 2001-2005) [9-23]) (Figure 5):
possibility to use several starting sources of an infection, which allows to consider multiplicity of epidemic processes in a network;
possibility to introduce current correction, which considers a ratio of infected nodes of a network at any step of a process of an epidemic.
consideration of heterogeneous value of nodes;
possibility in the course of simulation on a level of micro-fractals to consider mutation of a virus and changes of its probabilistic characteristics of infection of nodes of a network, considering not only the change of the parameters of one sign of distribution [24], but even the change of type of law of distribution of probability of infection (healing, immunization, etc.) of a single node of a network.
4. CONCLUSION
The proposed model can be used not only for the analysis of epidemics, but also for the distribution of a positive content in the context of the reaction on it in a network. The authors see the prospects of the development of the presented study in this direction.
REFERENCES:
[1] Ostapenko, G.A., D.G. Plotnikov, O.Y. Makarov, N.M. Tikhomirov and V.G. Yurasov, 2013. Analytical Estimation of the Component Viability of Distribution Automated Information Data System. World Applied Sciences Journal, 25(3): 416-420.
[2] Ostapenko, G.A., L.V. Parinova, V.I. Belonozhkin, I.L. Bataronov and K.V. Simonov, 2013. Analytical Models of Information-Psychological Impact of Social Information Networks in Users. World Applied Sciences Journal, 25(3): 410-415.
ISSN: 1992-8645 www.jatit.org E-ISSN: 1817-3195
315 [4] Radko, N.M., A.G. Ostapenko, S.V. Mashin,
O.A. Ostapenko and D.V. Gusev, 2014. Assessment of the System’s EPI-Resistance under Conditions of Information Epidemic Expansion. Biosciences Biotechnology Research Asia, 11: 173-176.
[5] Ostapenko, A.G., S.S. Kulikov, N.N. Tolstykh, Y.G. Pasternak and L.G. Popova, 2013. Denial of Service in Components of Information Telecommunication Systems through the Example of “Network Storm” Attacks. World Applied Sciences Journal, 25(3): 404-409. [6] Butuzov, V.V., A.G. Ostapenko, P.A. Parinov
and G.A. Ostapenko, 2014. Email-Flooder Attacks: The Estimation and Regulation of Damage. Life Science Journal, 11(7s): 213-218. [7] Ostapenko, A.G., M.V. Bursa, G.A. Ostapenko
and D.O. Butrik, 2014. Flood-Attacks within the Hypertext Information Transfer Protocol:
Damage Assessment and Management.
Biosciences Biotechnology Research Asia, 11: 173-176.
[8] Ermakov, S.A., A.S. Zavorykin, N.S. Kolenbet, A.G. Ostapenko and A.O. Kalashnikov, 2014. Optimization of Expert Methods Used to Analyze Information Security Risk in Modern Wireless Networks. Life Science Journal, 11(10s): 511-514.
[9] Pastor-Satorras, R., M . Boguňá and A. Vespignani, 2002. Absence of Epidemic Threshold in Scale-Free Networks with Connectivity Correlations. Phys. Rev. Lett., 90(2): 1-4.
[10] Pastor-Satorras, R., Y. Moreno, A. Vazquez and A. Vespignani, 2002. Critical Load, Congestion Instabilities in Scale-Free Networks. Europhys. Lett., 62: 292.
[11] Pastor-Satorras, R., M. Barthelemy, A. Barrat and A. Vespignani, 2005. Dynamical Patterns of Epidemic Outbreaks in Complex Heterogeneous Networks. Journal of Theoretical Biology, 235(2): 275-288.
[12] Pastor-Satorras, R., A. Vazquez and A. Vespignani, 2001. Dynamical, Correlation Properties of the Internet. Phys. Rev. Lett., 87(25).
[13] Pastor-Satorras, R., M. Boguňá, A. Diaz-Guilera and A. Arenas, 2003. Emergence of Clustering Correlations Communities in a Social Network Model.
[14] Pastor-Satorras, R. and A. Vespignani, 2002. Epidemic Dynamics in Finite Size Scale-Free Networks. Phys. Rev. E., 65(3).
[15] Pastor-Satorras, R. and A. Vespignani, 2001. Epidemic Dynamics, Endemic States in Complex Networks. Phys. Rev. E., 63(6). [16] Pastor-Satorras, R., M. Boguňá and A.
Vespignani, 2003. Epidemic Spreading in Complex Networks with Degree Correlations. In Statistical Mechanics of Complex Networks: Contribution to the Proceedings of the XVIII Sitges Conference.
[17] Pastor-Satorras, R. and M. Boguňá, 2002. Epidemic Spreading in Correlated Complex Networks. Phys. Rev. E., 66(4).
[18] Pastor-Satorras, R. and A. Vespignani, 2001. Epidemic Spreading in Scale-Free Networks. Phys. Rev. Lett., 86.
[19] Pastor-Satorras, R. and A. Vespignani, 2002. Immunization of Complex Networks. Phys. Rev. E., 65(3).
[20] Pastor-Satorras, R., A. Vazquez and A. Vespignani, 2002. Large-Scale Topological, Dynamical Properties of the Internet. Phys. Rev. E., 65.
[21] Pastor-Satorras, R., V. Colizza and A. Vespignani, 2007. Reaction-Diffusion Processes, Meta-Population Models in Heterogeneous Networks. Nature Physics, 3: 276-282.
[22] Pastor-Satorras, R., A. Vazquez and A. Vespignani, 2004. Topology, Hierarchy, Correlations in Internet Graphs. In Lecture Notes in Physics, Springer, pp: 425-440. [23] Pastor-Satorras, R., M. Barthelemy, A. Barrat
and A. Vespignani, 2004. Velocity and Hierarchical Spread of Epidemic Outbreaks in Scale-Free Networks. Phys. Rev. Lett, 92: 178-701.
[24] Radko, N.M., A.G. Ostapenko, S.V. Mashin, O.A. Ostapenko and A.S. Avdeev, 2014. Peak Risk Assessing the Process of Information
Epidemics Expansion. Biosciences
Biotechnology Research Asia, 11: 251-255. [25] Ostapenko, A.G., E.F. Ivankin, V.S. Zarubin
and A.V. Zaryaev, 2013. The Usefulness and
Viability of Systems: Assessment