ISSN: 1992-8645 www.jatit.org E-ISSN: 1817-3195
CLUSTER ANALYSIS APPLICATION ON PERMEABILITY’S
DIRECTION IN NUMERICAL SIMULATION
1YUAN Li, 1YAO Junbo, 2TAN Junxiang, 3MA Yujie, 1 LI Guorong, 1YI Xiangyi, 1LU Yuan
1.Chengdu University of Technology “State Key Laboratory of Oil and Gas Reservoir Geology and Exploitation”
2.Chengdu University of Technology, College of Earth Sciences, Chengdu, China
3.PetroChina Changqing Oilfield Company Geological Institute of No.8 Oil Production Plant, Shanxi Xi’an 710065,China
Email: [email protected]
ABSTRACT:
They are permeability scalar data which doesn’t has direction in geologic modeling due to lack of data. However, we can get the value and volume coordinate data from the minimum nine-square cube in the gridding model. As a secure and accurate classification methodology in multivariate statistics analysis, the ward-method cluster analyzing can classify the permeability data by clustering slow-changed data in some directions. Then we decompose the permeability into x, y, z directions by three-dimensional space geometric operation. It has an significant impact on improve the numerical simulation accuracy after the processing transformation of permeability data, which provide the basis for the development of the oil field.
Keywords-Permeability: Direction, Gridding Model, Cluster Analysis, Direction Decomposition
1. INTRODUCTION
As an important geologic parameter both in history matching and production forecasting for numerical simulation job. When in history matching, horizontal and vertical permeability’s accuracy directly impact single well and whole field’s oil producing rate and water production’s match extent. Meanwhile, if the forecasting of the distribution of pressure, water breakthrough time and remaining oil distribution has an error by using an inaccuracy permeability value, it will has an bad influence on oil field production development plan’s early period arrangement and middle-late periods adjustment, which leads to significant failures and major economic damage.
Vertical permeability value always has a sharper fall than horizontal permeability with the increase of the buried depth and formation pressure, and the rock permeability aeolotropy in the formation could be obviously displayed [1-3]. In the oil field development research, we are difficult to obtain the permeability value in all directions. The assessment of the permeability value in anisotropic medium is a very difficult but important job. So many geologic
modeling products a permeability gridding model which permeability is scalar and has no direction, but numerical simulation processing do requires three-direction permeability value models.
ISSN: 1992-8645 www.jatit.org E-ISSN: 1817-3195
Figure1: Cluster Method And Flow-Process
2. CLUSTER ANALYSIS THEORY AND METHOD SELECTION
2.1 Obtain the distance of data
When the permeability model value data’s variation is not so severe, we can analyze the closeness between data by using Euclidean distance calculation formula, and process with Hierachical cluster analysis, we choose ward method for clustering.
Applying Q cluster analysis, primary samples can be clustered by using distant factor as class statistic amount. The smaller the samples distance, the smaller the samples diversity. If the samples distance is big, they are supposed to belong to different classes. Because the ward cluster method based on the analysis of variance require the distance is Euclidean distance, so we use Euclidean distance for distance calculation in this research, and the formula as follows:
∑
−= i
i
i y
x y
x
d 2
) (
) ,
( (1)
2.2 Choosing cluster analysis method
The template is used to format your paper and style the text. All margins, column widths, line spaces, and text fonts are prescribed; please do not alter them. You may note peculiarities. For example, the head margin in this template measures proportionately more than is customary. This measurement and others are deliberate, using specifications that anticipate your paper as one part of the entire proceedings, and not as an independent document. Please do not revise any of the current designations.
+ −
=
j i j i ij
n n X
X
D 2 / 1 1 (2)
Dij is distance between sample of I and j, and the distance between sample of l and class composed
by I and j is :
2 , 2
, 2
, 2
,ij lij LJ ij
l D
nj ni nl
nl D
nj ni nl
ni nl D nj ni nl
ni nl D
+ + − +
+ + + + +
+ =
3. PROCESSING THE DESIGN OF EXPERIMENT BY USING CLUSTER ANALYSIS
3.1 The modeling of the experiment and flow-process
Figure2: A Nine-Square Cube Unit In The Gridding Model
Exported data from petrel modeling software include keyword of "PERMEABILITY" whose short form is perm, where below contains the data volume derived from the model, each value represents the permeability value of each grid, but it has no directions. However, actually in geology
Export permeability data
If permeability value around center are 0
Use conventional method to assign permeability value Determine the major
direction of permeability
Processing cluster analysis
Find the eligible l
Determine the value of permeability
Acquire θx、θy、θz by using coordinate fomula
Obtain permeability value of x/y/z directions If azimuth, angle of dip
opposite to known formation dip angle, take absolute value
Drive cube center moving alone x, y, z direction in turn
ISSN: 1992-8645 www.jatit.org E-ISSN: 1817-3195 subsurface situation, it should have directions
(permx, permy, permz), Tradition is artificially assignment operation permx = perm;permy = perm; permz = 1/10perm. Although this approach used empirical formula is of significance to some extent, it is still unscientific.
Permeability value in every grid has a three dimensional coordinate, according to cluster analysis, we search the 27 values in the nine-square cube, and cluster into two classes. Permeability values closed to the value in the center of the cube are class A, the others are class B. We can determine the major direction by pointing to the gravity centre of the permeability values points in class A except for cube center from cube center. And the value of the direction can be acquired by using method of weighted mean. We can decompose this permeability value into the x/y/z directions by using sine and cosine formula. The minimum nine-square cube in the gridding model is show as follow:
Drive the nine-square cube center move alone x, y, z direction in turn, and repeat the steps above,
then we can obtain three directions permeability values of values in all the grids. Comparing with conventional method of matrix assignment operation, this method embraces the idea of mathematical geology, and can process matrix assignment operation approximating to actual geology situation when data’s variance is small.
3.2 Preparing the testing data
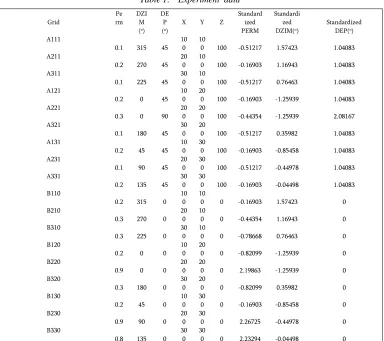
[image:3.612.116.500.376.717.2]There are permeability values in the modeling grid, the data types of each column must be the same, point of permeability value lies in every grid’s upper left corner, process the cluster analysis using nine-square cube as a unit, when run over, the center will move to the next cube center alone x, y, z directions in turn automatically. Considering samples generally have different dimensions, we have to process value data's standardization to put data of different dimensions and different ranges together to compare, and make sure the mean value of each column data is 0 and variance is 1. The testing data are shown as follows:
Table 1: Experiment data
Grid Perm DZIM
(o)
DE P
(o) X Y Z
Standard ized PERM
Standardi zed
DZIM(o) Standardized DEP(o)
A111
0.1 315 45 100 100 100 -0.51217 1.57423 1.04083
A211
0.2 270 45 200 100 100 -0.16903 1.16943 1.04083
A311
0.1 225 45 300 100 100 -0.51217 0.76463 1.04083
A121
0.2 0 45 100 200 100 -0.16903 -1.25939 1.04083
A221
0.3 0 90 200 200 100 -0.44354 -1.25939 2.08167
A321
0.1 180 45 300 200 100 -0.51217 0.35982 1.04083
A131
0.2 45 45 100 300 100 -0.16903 -0.85458 1.04083
A231
0.1 90 45 200 300 100 -0.51217 -0.44978 1.04083
A331
0.2 135 45 300 300 100 -0.16903 -0.04498 1.04083
B110
0.2 315 0 100 100 0 -0.16903 1.57423 0
B210
0.3 270 0 200 100 0 -0.44354 1.16943 0
B310
0.3 225 0 300 100 0 -0.78668 0.76463 0
B120
0.2 0 0 100 200 0 -0.82099 -1.25939 0
B220
0.9 0 0 200 200 0 2.19863 -1.25939 0
B320
0.3 180 0 300 200 0 -0.82099 0.35982 0
B130
0.2 45 0 100 300 0 -0.16903 -0.85458 0
B230
0.9 90 0 200 300 0 2.26725 -0.44978 0
B330
ISSN: 1992-8645 www.jatit.org E-ISSN: 1817-3195
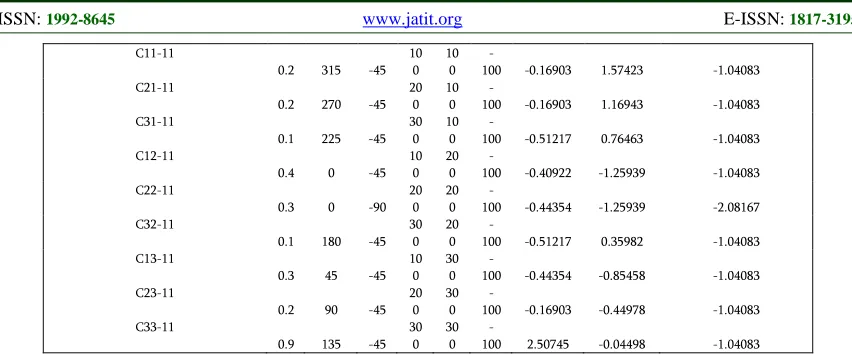
C11-11
0.2 315 -45 100 100 100 - -0.16903 1.57423 -1.04083
C21-11
0.2 270 -45 200 100 100 - -0.16903 1.16943 -1.04083
C31-11
0.1 225 -45 300 100 100 - -0.51217 0.76463 -1.04083
C12-11
0.4 0 -45 100 200 100 - -0.40922 -1.25939 -1.04083
C22-11
0.3 0 -90 200 200 100 - -0.44354 -1.25939 -2.08167
C32-11
0.1 180 -45 300 200 100 - -0.51217 0.35982 -1.04083
C13-11
0.3 45 -45 100 300 100 - -0.44354 -0.85458 -1.04083
C23-11
0.2 90 -45 200 300 100 - -0.16903 -0.44978 -1.04083
C33-11
0.9 135 -45 300 300 100 - 2.50745 -0.04498 -1.04083
3.3 Clustering analysis algorithm
[image:4.612.92.518.72.249.2]Calculate the distance between standardized samples by using Euclidean formula, and the process can be implemented by SPSS statistical analysis software, and output a similar coefficient distance matrix. Then run the Hierachical Cluster Analysis, input given number of clusters. When analyzing in method modular, we choose ward clustering analysis algorithm. To reveal a clear relationship between samples directly [5], we always use dendrogram to show the result of cluster analysis. And from the figure below, we can clearly see that B230,B330,B220,C33-1 belong to one cluster, and the others belong to another cluster, which exactly match the initial data classification. Therefore we can safely draw the conclusion that ward method clustering analysis can process clustering the data stably and securely, and don’t deviate from original geology law of permeability values distribution.
Figure 3: Dendrogram Of Ward Method Cluster Analysis’s Result
3. OBTAIN THE PERMEABILITY VALUES OF THE THREE DIRECTIONS BY TRANSFORM THREE-DIMENSIONAL SPACE GEOMETRY ANGLE
4.1 Obtain The Permeability Value Of The Main Direction
Obtain permeability of the main direction and the permeability value of main direction after clustering analysis method finds this kind of category that conform to the conditions. Through the clustering method we can find out n values of the same class which close to the value of centre. Take advantage of Arithmetic average method (such as formula (1)), we obtain the permeability value of the main direction.
K=
n
k k
k + + i+ + n
+ ... ....
k1 2 (4)
A. Obtain the main direction of permeability
We have known the three points which belong to the same class form a plane of triangle in space, and also we have known the space coordinates of three points. Firstly, obtain the midpoint coordinates of each side by using the midpoint formula. Secondly obtain Center of gravity M(x0、 y0、z0) by using constant ratio formula of internal point of division, and got the formula of center of gravity as following:
(
+λ) (
+λ)
= /1
x0 x1 x2 ,y0 =
(
y1+λy2) (
/1+λ)
,(
+λ) (
+λ)
= /1
y0 y1 y2 (5)
Where: λ=1/2
ISSN: 1992-8645 www.jatit.org E-ISSN: 1817-3195 4.2 Obtain The Permeability Value Of Three
Directions By Transformat Angular In Three-Dimensional
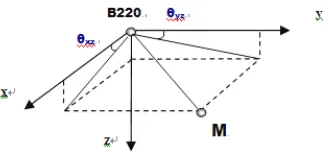
[image:5.612.122.286.205.281.2]First of all, make projection of the main direction of the permeability to plane xz and yz respectively in the three-dimensional space. According to three-dimensional space coordinates of center M and the point of center of gravity, we obtain θyz, θxz. The projection is shown in Figure 5.
Figure 4: Projection on the three dimensional space
Cosθyz = (y0-yj)/[(y0-yj)2+(z0-zk)2]1/2 (6) Cosθxz = (x0-xi)/[(x0-xi)2+(z0-zk)2]1/2 (7) θyz = arccos(y0-yj)/[(y0-yj)2+(z0-zk)2]1/2 (8)
θxz = arccos(y0-yj)/[(y0-yj)2+(z0-zk)2]1/2 (9)
Where: θyz —the angle between the line of projection to the surface and coordinate axis y
θxz —the Angle between the line of projection to the surface and coordinate axis x. The length of the projection to the yz plane L,
L=[(y0-yj)2+(z0-zk)2]1/2 (10)
The length of the main direction line in three-dimensional space:
H =[(x0-xi)2 +(y0-yj)2+(z0-zk)2]1/2 (11)
CosΦyz = [(y0-yj)2+(z0-zk)2]1/2/[(x0-xi)2 +(y0 -yj)2+(z0-zk)2]1/2
(12)
where:
Φyz—the angle between main direction line of permeability and the line of the projection to the yz plane
Kyz = Cos Φyz*K = [ (y0- yj) 2
+(z0 - zk) 2
]1/2/[(x0 - xi) 2
+
(y0 - yj)2 + (z0- zk)2]1/2*K (13)
Kz = sinθyz * Kyz = sinarccos (y0-yj)/[(y0-yj) 2
+(z0 -zk)2]1/2*[(y0-yj)2+(z0-zk)2]1/2/[(x0-xi)2 +(y0-yj)2+(z0
-zk)2]1/2*K (14)
Ky = Cosθyz*Kyz = (y0-yj)/[(y0-yj)2+(z0-zk)2]1/2*[(y0
-yj)2+(z0-zk)2]1/2/ [(x0-xi)2+(y0-yj)2+(z0-zk)2]1/2*K (15)
Similarly,
Kx = (x0-xi)/[( x0-xi)2 + (z0-zk)2]1/2*[(x0-xi)2 +(z0
-zk)2]1/2/[(x0-xi)2 + (y0- yj)2+(z0-zk)2]1/2*K (16)
where:
Kyz—the permeability of projection to the yz plane; Kz—permeability values on the z direction Ky—permeability values on the y direction; Kx— permeability values on the x direction
Then we can calculate the permeability of the next grid until the calculation of all grids is completed in the work area.
ACKNOWLEDGMENT
In this paper, we process permeability data exported from Petrel modeling software by using clustering analysis method to obtain permeability of the three directions, and process transformation in three dimensional space. This method is scientific and accord with knowledge of geological law o some extent, especially when the single grid unit is small enough. Compared with the experience formula of artificially assign value method, this method has a significant improvement on the grid model permeability value accuracy which could be feasible. This method provides powerful technical support for development plan design of oil fields.
REFERENCES
[1] Gatens JM, Lee W J, The Effects of Permeability Anisotropy on the valuation and Design of Hydraulic Fracture Treatments and Well Performance, SPE 21501, pp.211-222,1991.
[2] Pryor W A, Permeability-porosity patterns and variations in some Hocene san bodies, AAPG Bull,pp.162-189, 1973. K. Elissa, “Title of paper if known” .
[3] Larry W Lake, “The Origins of Anisotropy”, Journal of Pet Tech, pp.395-396,1988.
[4] Zhang Runchu, “Multivariate Statistical Analysis”, Beijing, Scientific and Technical Publishers, pp.13-19,2006.