DCT Sectorization for Feature Vector Generation in CBIR
H.B.Kekre
Sr. Professor
MPSTME, SVKM’s NMIMS (Deemed-to
be-University)
Vile Parle West, Mumbai -56, INDIA
Dhirendra Mishra
Associate Professor & PhD Research Scholar
MPSTME, SVKM’s NMIMS (Deemed-to
be-University)
Vile Parle West, Mumbai -56, INDIA
ABSTRACT
We have introduced a novel idea of sectorization of DCT transformed components. In this paper we have proposed two different approaches along with augmentation of mean of zero and highest row components of row transformed values in row wise DCT transformed image and mean of zero- and highest column components of Column transformed values in column wise DCT transformed image for feature vector generation. The sectorization is performed on even-odd plane. We have introduced the new performance evaluation parameters i.e. LIRS and LSRR apart from precision and Recall, the traditional methods. Two similarity measures such as sum of absolute difference and Euclidean distance are used and results are compared. The cross over point performance of overall average of precision and recall for both approaches on different sector sizes are compared. The DCT transform sectorization is experimented on even-odd row and column components of transformed image with augmentation and without augmentation for the color images. The algorithm proposed here is worked over database of 1055 images spread over 12 different classes. Overall Average precision and recall is calculated for the performance evaluation and comparison of 4, 8, 12 & 16 DCT sectors. The use of Absolute difference as similarity measure always gives lesser computational complexity.
General Terms:
Content based image retrieval, pattern recognisition
Keywords
CBIR, DCT, Euclidian Distance, Sum of Absolute Difference, Precision and Recall, LIRS, LSRR.
1.
INTRODUCTION
Content-based image retrieval (CBIR), [1][2] is any technology that in principle helps to organize digital picture archives by their visual content. By this definition, anything ranging from an image similarity function to a robust image annotation engine falls under the purview of CBIR. This characterization of CBIR as a field of study places it at a unique juncture within the scientific community. People from different fields, such as, computer vision, machine learning, information retrieval, human-computer interaction, database systems, Web and data mining, information theory, statistics, and psychology contributing and becoming part of the CBIR community. Amidst such marriages of fields, it is important to recognize the shortcomings of CBIR as a real-world technology. One problem with all current approaches is the reliance on visual similarity for judging semantic similarity, which may be problematic due to the semantic between low-level
content and higher-level concepts. While this intrinsic difficulty in solving the core problem cannot be denied, it is believed that the current state-of-the-art in CBIR holds enough promise and maturity to be useful for real-world applications if aggressive attempts are made. For example, many commercial organizations are working on image retrieval despite the fact that robust text understanding is still an open problem. Online photo-sharing has become extremely popular, which hosts hundreds of millions of pictures with diverse content. The video-sharing and distribution forum has also brought in a new revolution in multimedia usage. Of late, there is renewed interest in the media about potential real-world applications of CBIR and image analysis technologies, There are various approaches which have been experimented to generate the efficient algorithm for CBIR like FFT sectors [5-8], Transforms [16][17], Vector quantization[16], bit truncation coding [17][18]. In this paper we have introduced a novel concept of complexFullWalsh transform and its sectorization for feature extraction (FE).Two different similarity measures namely sum of absolute difference and Euclidean distance are considered. The performances of these approaches are compared.
2.
DISCRETE COSINE TRANSFORM
DCT is made up of cosine functions taken over half the interval and dividing this half interval into N equal parts and sampling each function at the center of these parts. The discrete cosine transform matrix is formed by arranging these sequences row wise.The most common DCT definition of 1D Sequence of Length N is
(1)
For u= 0,1,2….N-1
Similary inverse transform is given as :
(2)
(3)
3.
FEATURE
VECTOR
GENERATION
[image:2.612.76.274.316.436.2]The proposed algorithm makes novel use of DCT transform to design the sectors to generate the feature vectors for the purpose of search and retrieval of database images. The rows in the discrete cosine transform matrix have a property of increasing sequency. Thus zeroeth and all other even rows have even sequencies whereas all odd rows have odd sequency. To form the feature vector plane we take the combination of co-efficient of consecutive odd and even co-efficient of every column and putting even co-efficient on x axis and odd co-efficient on y axis thus taking these components as coordinates we get a point in x-y plane as shown in figure 1.
Figure 1: The DCT Plane used for sectorization
We have proposed plane namely even-odd component plane for feature vector generation taking mean value of all the vectors in each sector with sum of absolute difference[7-13] and Euclidean distance [7-9] [11-14] as similarity measures. In addition to these the feature vectors are augmented by adding two components which are the average value of zaroeth and the last row and column respectively. Performances of both these approaches are compared with respect to both similarity measures. Thus for 4, 8, 12 & 16 DCT sectors 8, 16, 24 and 32 feature components along with augmentation of two extra components for each color planes i.e. R, G and B are generated. Thus all feature vectors are of dimension 30, 54, 72 and 102 components.
3.1 Four DCT Sectors:
To get the angle in the range of 0-360 degrees, the steps as given in Table 1 are followed to separate these points into four quadrants of the complex plane. The DCT of the color image is calculated in all three R, G and B planes. The even rows/columns components of the image and the odd rows/columns components are checked for positive and negative signs. The even and odd
TABLE I. FOUR DCTSECTOR FORMATION
Sign of Even row/column
Sign of Odd row/column
Quadrant Assigned
+ + I (0 – 900)
+ - II ( 90 – 1800)
- - III( 180- 2700)
- + IV(270–3600)
However, it is observed that the density variation in 4 quadrants is very small for all the images. higher number of sectors such as 8, 12 and 16 were tried.
Sum of absolute difference measure is used to check the closeness of the query image from the database image and precision and recall are calculated to measure the overall performance of the algorithm.
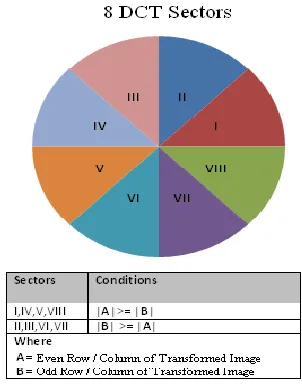
3.2 Eight DCT Sectors:
[image:2.612.356.507.346.540.2]Each quadrants formed in the previous obtained 4 sectors are individually divided into 2 sectors each considering the angle of 45 degree. In total we form 8 sectors for R,G and B planes separately as shown in the Figure 2.
FIgure 2: Formation of 8 sectors of DCT
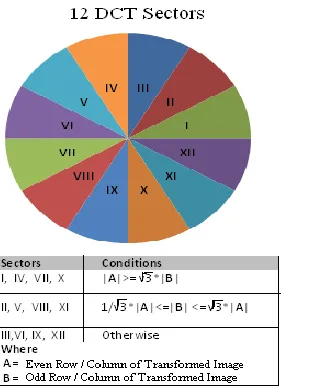
3.3 Twelve DCT Sectors:
FIgure 3: Formation of 12 sectors of DCT
3.4 Sixteen DCT Sectors:
Sixteen sectors are obtained by dividing each one of eight sectors into two equal parts.
4.
RESULTS
AND
DISCUSSION
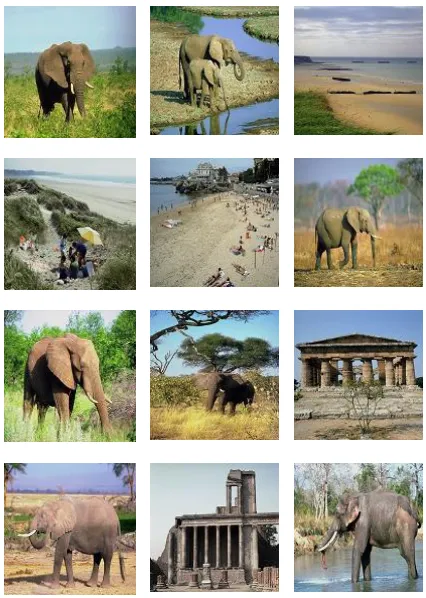
The sample Images of the database of 1055 images of 12 different classes such as Flower, Sunset, Barbie, Tribal, Puppy, Cartoon, Elephant, Dinosaur, Bus, Parrots, Scenery, Beach is shown in the Figure 4.
[image:3.612.103.262.78.272.2]Figure 4. Sample Image Database
Figure 5. Query Image
[image:3.612.56.317.415.673.2]Figure 6: First 21 Retrieved Images of 16 DCT Sectors (column wise) with sum of Absolute Difference as similarity measures for the query image shown
in the Figure 3
Figure 7: First 21 Retrieved Images of 16 DCT Sectors (row wise) with sum of Absolute Difference as similarity measures for the query image shown in
the Figure 3
Once the feature vector is generated for all images in the database a feature database is created. A query image of each class is produced to search the database. The image with exact match gives minimum absolute difference. To check the effectiveness of the work and its performance with respect to retrieval of the images we have calculated the precision and recall as given in Equations (4) & (5) below along with this we have introduced two new performance evaluation parameters for the first time namely length of initial relevant string of images (LIRS) and Length of string to recover all relevant images(LSRR) in the database as given in equation (6) and (7):
Number of relevant images retrieved
Precision=--- (4) Total Number of images retrieved
Number of relevant images retrieved
Recall=--- (5) Total number of relevant images in database
[image:4.612.330.543.74.373.2]
Length of string to recover all relevant images LSRR = --- (7) Total images in the Database
All these parameters lie between 0-1 hence they can be expressed in terms of percentages. The newly introduced parameters give the better performance for higher value of LIRS and Lower value of LSRR.
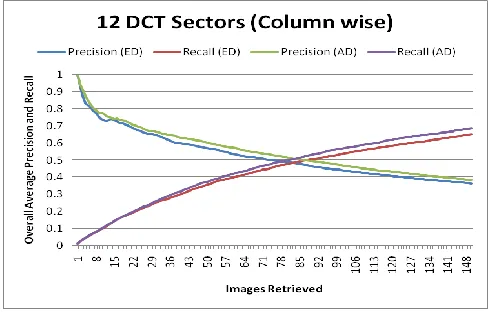
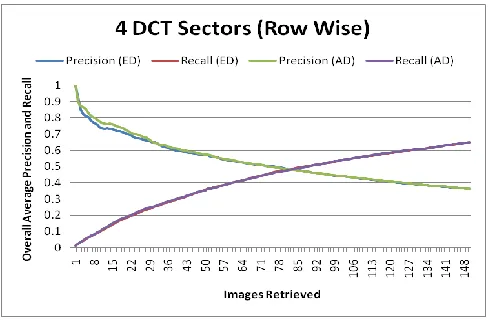
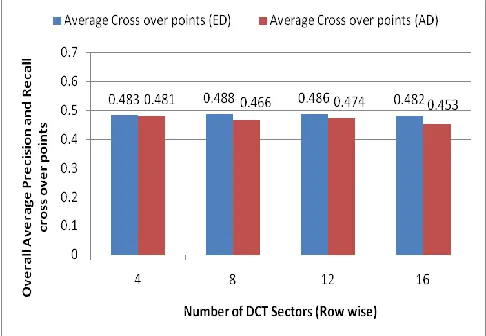
The Figure 8 – Figure 11 shows the Overall Average Precision and Recall cross over point performance of column wise DCT transformed image with augmentation in 4, 8, 12 and 16 sectors and sum of absolute Difference and Euclidian distance as similarity measures respectively. Figure12-15 Overall Average Precision and Recall cross over point performance of row wise DCT transformed image with augmentation in 4, 8, 12 and 16 sectors and sum of Absolute Difference and Euclidian distance as similarity measures respectively. The comparison chart of new parameters of performance measuring is compared in Figure 16 and Figure 17 for both column wise DCT and row wise DCT. The comparison bar chart of cross over points of overall average of precision and recall for 4, 8, 12 and 16 sectors of DCT sectorization w.r.t. two different similarity measures namely Euclidean distance and sum of Absolute difference is shown in the Figure18 and Figure19. It is observed that performance of all sectors are retrieval rate of 0.5 with sum of absolute difference as similarity measuring parameter for column wise DCT and 0.47 for row wise DCT.
Figure 8: Overall Average Precision and Recall performance of column wise DCT Transformation in 4 DCT sectors with Augmentation .Absolute Difference(AD) and Euclidian Distance (ED) as similarity measures.
Figure 9: Overall Average Precision and Recall performance of column wise DCT Transformation in 8 DCT sectors with Augmentation .Absolute Difference(AD) and Euclidian Distance (ED) as similarity measures.
Figure 10: Overall Average Precision and Recall performance of column wise DCT Transformation in 12 DCT sectors with Augmentation .Absolute Difference(AD) and Euclidian Distance (ED) as similarity measures.
[image:5.612.316.559.73.227.2] [image:5.612.314.559.290.446.2] [image:5.612.55.298.387.587.2] [image:5.612.315.558.501.663.2]Figure 12 Overall Average Precision and Recall performance of column wise DCT Transformation in 4 DCT sectors (Row wise) with Augmentation .Absolute Difference(AD) and Euclidian Distance (ED) as similarity measures
Figure 13: Overall Average Precision and Recall performance of column wise DCT Transformation in 8 DCT sectors (Row wise) with Augmentation .Absolute Difference (AD) and Euclidian Distance (ED) as similarity measures
with Augmentation .Absolute Difference (AD) and Euclidian Distance (ED) as similarity measures
Figure 15: Overall Average Precision and Recall performance of column wise DCT Transformation in 16 DCT sectors (Row wise) with Augmentation .Absolute Difference (AD) and Euclidian Distance (ED) as similarity measures
Average value of parameters
Sectors
LIRS
Length1
LSRR
Length2
4
0.12
5
0.60
631
8
0.13
5
0.59
591
12
0.10
7
0.58
580
16
0.13
3
0.61
642
Figure 16: Comparison chart of LIRS (with Length1 = Length of initial relevant string of images) and LSRR (with Length2= Length of string to retrieve all relevant images) of all DCT sectors in column wise DCT.
Average value of parameters
Sectors
LIRS
Length 1
LSRR
Length 2
4
0.11
4
0.61
610
8
0.12
5
0.62
620
12
0.10
9
0.65
651
16
0.14
3
0.63
629
[image:6.612.54.299.91.251.2] [image:6.612.315.559.102.286.2] [image:6.612.54.298.314.471.2] [image:6.612.313.564.361.459.2] [image:6.612.315.558.529.624.2] [image:6.612.55.296.534.686.2]Figure 18: Comparison of Overall Precision and Recall cross over points of Column wise transformation in DCT 4, 8, 12 and 16 sectors with Augmentation Absolute Difference (AD) and Euclidean Distance (ED) as similarity measure.
Figure 19: Comparison of Overall Precision and Recall cross over points of Row wise transformation in DCT 4, 8, 12 and 16 sectors with Augmentation Absolute Difference (AD) and Euclidean Distance (ED) as similarity measure.
5. CONCLUSION
The Innovative idea of sectorizing DCT transform plane into 4, 8, 12 and 16 sectors of the images to generate the feature vectors for content based image retrieval and a new performance measuring parameter for CBIR is proposed. The work is experimented over even-odd row/column DCT component planes of DCT transformed image. The overall precision and recall cross over points performance of both planes are checked with the consideration of augmentation of the feature vectors by adding two components which are the average value of zaroeth and last row/column respectively. Performances of both these approaches are compared with respect to both similarity measures. We found that the performance of DCT sectorization with augmentation for both planes give good result of retrieval on average 48% when using the Euclidian distance as similarity measure. The performance of DCT sectorization with augmentation for column
wise DCT give better result of retrieval on average 50% whereas 46% when using the sum of absolute difference as similarity measure.
6. REFERENCES
[ 1 ] Kato, T., “Database architecture for content based image retrieval in Image Storage and Retrieval Systems” (Jambardino A and Niblack W eds),Proc SPIE 2185, pp 112-123, 1992.
[ 2 ] Ritendra Datta,Dhiraj Joshi,Jia Li and James Z. Wang, “ Image retrieval:Idea,influences and trends of the new age”,ACM Computing survey,Vol 40,No.2,Article 5,April 2008.
[ 3 ] John Berry and David A. Stoney “The history and development of fingerprinting,” in Advances in Fingerprint Technology, Henry C. Lee and R. E. Gaensslen, Eds., pp. 1-40. CRC Press Florida, 2nd edition, 2001.
[ 4 ] Emma Newham, “The biometric report,” SJB Services, 1995.
[ 5 ] H. B. Kekre, Dhirendra Mishra, “Digital Image Search & Retrieval using FFT Sectors” published in proceedings of National/Asia pacific conference on Information communication and technology(NCICT 10) 5TH & 6TH March 2010.SVKM’S NMIMS MUMBAI
[ 6 ] H.B.Kekre, Dhirendra Mishra, “Content Based Image Retrieval using Weighted Hamming Distance Image hash Value” published in the proceedings of international conference on contours of computing technology pp. 305-309 (Thinkquest2010) 13th & 14th March 2010.
[ 7 ] H.B.Kekre, Dhirendra Mishra,“Digital Image Search & Retrieval using FFT Sectors of Color Images” published in International Journal of Computer Science and Engineering (IJCSE) Vol. 02,No.02,2010,pp.368-372 ISSN 0975-3397 available online at http://www.enggjournals.com/ijcse/doc/IJCSE10-02- 02-46.pdf
[ 8 ] H.B.Kekre, Dhirendra Mishra, “CBIR using upper six FFT Sectors of Color Images for feature vector generation” published in International Journal of Engineering and Technology(IJET) Vol. 02, No. 02, 2010, 49-54 ISSN 0975-4024 available online at http://www.enggjournals.com/ijet/doc/IJET10- 02-06.pdf
[ 9 ] H.B.Kekre, Dhirendra Mishra, “Four walsh transform sectors feature vectors for image retrieval from image databases”, published in international journal of computer science and information technologies (IJCSIT) Vol. 1 (2) 2010, 33-37 ISSN 0975-9646 available online at http://www.ijcsit.com/docs/vol1issue2/ijcsit201001 0201. pdf
[image:7.612.54.297.292.460.2]Engineering, science and technology(IJEST) Vol.2(5) 2010, 1370-1374 ISSN 0975-5462 available online at http://www.ijest.info/docs/IJEST10-02-05-62.pdf
[ 11 ] H.B.Kekre, Dhirendra Mishra, “ density distribution in walsh transfom sectors ass feature vectors for image retrieval”, published in international journal of compute applications (IJCA) Vol.4(6) 2010, 30-36 ISSN
0975-8887 available online at
http://www.ijcaonline.org/archives/volume4/number6/82 9-1072
[ 12 ] H.B.Kekre, Dhirendra Mishra, “Performance comparison of density distribution and sector mean in Walsh transform sectors as feature vectors for image retrieval”, published in international journal of Image Processing (IJIP) Vol.4(3) 2010, ISSN 1985-2304
available online at
http://www.cscjournals.org/csc/manuscript/Journals/IJIP/ Volume4/Issue3/IJIP-193.pdf
[ 13 ] H.B.Kekre, Dhirendra Mishra, “Density distribution and sector mean with zero-sal and highest-cal components in Walsh transform sectors as feature vectors for image retrieval”, published in international journal of Computer scienece and information security (IJCSIS) Vol.8(4) 2010, ISSN 1947-5500 available online http://sites.google.com/site/ijcsis/vol-8-no-4-jul-2010
[ 14 ] Arun Ross, Anil Jain, James Reisman, “A hybrid fingerprint matcher,” Int’l conference on Pattern Recognition (ICPR), Aug 2002.
[ 15 ] A. M. Bazen, G. T. B.Verwaaijen, S. H. Gerez, L. P. J. Veelenturf, and B. J. van der Zwaag, “A correlation-based fingerprint verification system,” Proceedings of the ProRISC2000 Workshop on Circuits, Systems and Signal Processing, Veldhoven, Netherlands, Nov 2000. [ 16 ] H.B.Kekre, Tanuja K. Sarode, Sudeep D. Thepade,
“Image Retrieval using Color-Texture Features from DCT on VQ Codevectors obtained by Kekre’s Fast Codebook Generation”, ICGST International Journal on Graphics, Vision and Image Processing (GVIP), Available online at http://www.icgst.com/gvip
[ 17 ] H.B.Kekre, Sudeep D. Thepade, “Using YUV Color Space to Hoist the Performance of Block Truncation Coding for Image Retrieval”, IEEE International Advanced Computing Conference 2009 (IACC’09), Thapar University, Patiala, INDIA, 6-7 March 2009.
[ 18 ] H.B.Kekre, Sudeep D. Thepade, “Image Retrieval using Augmented Block Truncation Coding Techniques”, ACM International Conference on Advances in Computing, Communication and Control (ICAC3-2009), pp.: 384-390, 23-24 Jan 2009, Fr. Conceicao Rodrigous College of Engg., Mumbai. Available online at ACM portal.
[ 19 ] H.B.Kekre, Tanuja K. Sarode, Sudeep D. Thepade, “DCT Applied to Column mean and Row Mean Vectors of Image for Fingerprint Identification”, International
ICCNS-2008, 27-28 Sept 2008, Vishwakarma Institute of Technology, Pune.
[ 20 ] H.B.Kekre, Sudeep Thepade, Archana Athawale, Anant Shah, Prathmesh Velekar, Suraj Shirke, “ Walsh transform over row mean column mean using image fragmentation and energy compaction for image retrieval”, International journal of computer science and engineering (IJCSE),Vol.2.No.1,S2010,47-54.
[ 21 ] H.B.Kekre, Vinayak Bharadi, “Walsh Coefficients of the Horizontal & Vertical Pixel Distribution of Signature Template”, In Proc. of Int. Conference ICIP-07, Bangalore University, Bangalore. 10-12 Aug 2007.
AUTHORS PROFILE
H. B. Kekre has received B.E. (Hons.) in Telecomm. Engg. from Jabalpur University in 1958, M.Tech (Industrial Electronics) from IIT Bombay in 1960, M.S.Engg. (Electrical Engg.) from University of Ottawa in 1965 and Ph.D.(System Identification) from IIT Bombay in 1970. He has worked Over 35 years as Faculty and H.O.D. Computer science and Engg. At IIT Bombay. From last 13 years working as a professor in Dept. of Computer Engg. at Thadomal Shahani Engg. College, Mumbai. He is currently senior Professor working with Mukesh Patel School of Technology Management and Engineering, SVKM’s NMIMS University vile parle west Mumbai. He has guided 17 PhD.s 150 M.E./M.Tech Projects and several B.E./B.Tech Projects. His areas of interest are Digital signal processing, Image Processing and computer networking. He has more than 350 papers in National/International Conferences/Journals to his credit. Recently ten students working under his guidance have received the best paper awards. Two research scholars working under his guidance have been awarded Ph. D. degree by NMIMS University. Currently he is guiding 10 PhD. Students. He is life member of ISTE and Fellow of IETE.