Estimation of Population Mean in Two Stage Design
using Double Sampling for Stratification and
Multiauxiliary Information
Monika Saini
Research Scholar Department of Statistics
M.D. University, Rohtak
Shashi Bahl
Prof. & Head Department of Statistics
M.D. University, Rohtak
ABSTRACT
For estimating the population mean of the heterogeneous population, when sampling frame in strata and the strata weight are not defined, we have proposed new difference and ratio estimators using double sampling for stratification and auxiliary information in two stage design. The expression for bias and variances of the proposed estimators have been obtained based on double sampling for stratification approach and comparison have been made with estimator under unstratified double sampling. In addition, we support these theoretical results by an empirical study
.
General Terms
Sampling Theory
Keywords
Double Sampling for Stratification; Two Stage Design; Auxiliary Information; Difference (D) and Ratio (R) estimators.
1.
INTRODUCTION
Information on variables correlated with the main variable under study is popularly known as auxiliary information which may be fruitfully utilized either at planning stage or at designing stage or at the estimation stage to arrive at improved estimator compared to those, not utilizing auxiliary information. If the required information is not available in advance for the entire population, it might be advantageous to collect certain items for large preliminary sample and then use this information at the estimation stage to improve the estimators. This technique is generally referred to as double sampling.
Stratification is one of the most widely used techniques in sample survey design serving the dual purpose of providing samples that are representative of major sub-groups of the population and improving the precision of estimators. Stratified sampling presupposes the knowledge of strata size as well as the availability of a frame for drawing a sample in each stratum. However application of this technique presupposes the knowledge of strata size and the availability of sampling frames within strata. But in many practical situations, when we want to estimate the population mean 𝒀
of a variate y and consider it desirable to stratify the population, consisting of N units on the basis of the value of auxiliary character x but the information of x is unknown, the sampling frame for various strata and the strata weight
𝑾𝒉= 𝑵𝒉 𝑵 (h=1,2,……L) are not known although the strata
may be fixed in advance. In such situation the method of double sampling for stratification (DSS) can be used. Many
Ige and Tripathi [1], Tripathi and Bahl [8], Singh and Vishwakarma [5] and Shabbir and Gupta [4] contributed well in the field of stratification.
In this paper we propose difference and ratio estimators in two stage design using DSS and multi-auxiliary information.
2. SUGGESTED PROCEDURE
Let a finite (survey) population U be partitioned into N fsu (first stage units) denoted by (𝑈1,.., 𝑈𝑖,.,𝑈𝑁 ) such that the
number of ssu (second stage units) in 𝑈𝑖 be 𝑀𝑖 . Suppose we
want to estimate the population mean 𝑌 of study variate y and consider it desirable to stratify the population consisting of N units on the basis of one of values of the auxiliary characters
𝑥𝑘′ 𝑠 (k= 1, 2,….,p) but the frequency distribution of 𝑥 𝑘
′ 𝑠 is
unknown. The sampling frame for various strata and the strata weight Wh = 𝑁ℎ 𝑁 , (h=1, 2 …L), are not known although
the strata may be fixed in advance. We use the technique of double sampling for stratification (DSS) in two stage design at fsu level; the sampling procedure consists of the following steps:
Step (1): We select a preliminary large sample of 𝑛′
fsus rather inexpensively from a population of N fsus with simple random sampling without replacement and observe the auxiliary character 𝑥1, 𝑥2, … … , 𝑥𝑝 and then classify sample
𝑛′ into L strata on the basis of the information obtained through 𝑛′ for one or more 𝑥𝑘′ 𝑠 . Let 𝑛ℎ′ denote the number of
units falling into stratum h (h=1,2,….,L) i.e. 𝑛1′,𝑛2′……..𝑛𝐿′
respectively, where 𝑛𝐿ℎ ℎ′=𝑛′.
Step (2): Randomly select 𝑛ℎi.e no. of fsu`s in the sample,
in stratum h out of 𝑛ℎ′ without replacement ,where
𝑛ℎ= 𝑣ℎ𝑛ℎ′ , 0< 𝑣ℎ< 1 ( h=1,2…..L )𝑣ℎ being predetermined
for each h are selected from strata independently and n= 𝑛ℎ ; n=(𝑛1,…..𝑛𝐿).
Step (3): Randomly select 𝑚ℎ𝑖 i.e no. of ssu`s to be selected
from each sampled first stage units out of 𝑀ℎ𝑖 in stratum h
without replacement (h=1,2,....,L) and character of main interest y is observed.
Using above sampling scheme we propose difference and ratio estimators for the estimation of population mean.
Utilizing the information collected on𝑥1, 𝑥2, … … , 𝑥𝑝, through
the preliminary large sample
n
' on 𝑥𝑘-variates at fsu. Wedefine multivariate difference and ratio estimators in two stage design using DSS at fsu level for the estimation of population mean and let us denote that estimator by 𝑇𝐷𝑆𝑆 for
difference and ratio estimators i.e.( 𝑇𝐷𝑆𝑆)𝐷 and ( 𝑇𝐷𝑆𝑆)𝑅 as
𝑇𝐷𝑆𝑆= 𝑎𝑘𝑡𝑘 .. .(3.1)
as 𝑡𝑘 = ( 𝑡𝑘)𝐷 = 𝑦 (3) −𝜆𝑘 ( 𝑥𝑘(2) − 𝑥𝑘(1) ) ...(3.2)
( 𝑡𝑘)𝑅 = (
𝑦 (3)
𝑥 𝑘 (2) ) 𝑥𝑘(1) ....(3.3) where 𝑎 = 𝑎1, 𝑎2, … . . , 𝑎𝑝 ,with 𝑎𝑝𝑘 𝑘 = 1 is a weighting
function and 𝜆𝑘′ s are suitably chosen constants. In proposed estimator we note that
𝑦 (3) = 𝑤𝐿ℎ ℎ′ 1 𝑛ℎ 𝑀ℎ𝑖
𝑛ℎ
𝑖 𝑦 ℎ𝑖
𝑥𝑘(2) = 𝑤𝐿ℎ ℎ′ 𝑥 𝑘ℎ
𝑥 𝑘(1) = 𝑤𝐿ℎ ℎ′ 𝑥 𝑘ℎ′
such that 𝑦 ℎ𝑖= 𝑚1
ℎ 𝑖 𝑦ℎ𝑖𝑗
𝑚ℎ 𝑖
𝑗
𝑥 𝑘ℎ= 𝑛1
ℎ 𝑥𝑘ℎ𝑖
𝑛ℎ
𝑖
𝑥 𝑘ℎ′ = 1
𝑛ℎ′ 𝑥𝑘ℎ𝑖 𝑛ℎ′ 𝑖
where 𝑦 (3) , 𝑥 𝑘(2) and 𝑥 𝑘(1) are unbiased estimator of
population mean 𝑌 and 𝑋 𝑘 . Note that 𝑤ℎ′ = 𝑛ℎ′
𝑛′ is an unbiased
estimator of strata weights 𝑊ℎ = 𝑁ℎ
𝑁 . Throughout we assume
that 𝑛′ is large enough so that Pr (𝑛ℎ′= 0) = 0 for all h. These estimators can shown to be unbiased by taking conditional expectation as
𝐸(𝑦 3 ) = 𝐸1𝐸2𝐸3(𝑦 (3)) = 𝑌
𝐸(𝑥 𝑘 2 ) = 𝐸1𝐸2(𝑥 𝑘 2 ) = 𝑋 𝑘
𝐸(𝑥 𝑘 1 ) = 𝐸1(𝑥 𝑘 1 ) = 𝑋 𝑘
i.e. 𝑥 𝑘(1) = 𝐸2 (𝑥 𝑘(2))
Theorem (3.1) : The multivariate difference estimator 𝑇𝐷𝑆𝑆 is
unbiased for 𝑌 and the exact expression for its variance is given by
𝑉(𝑇𝐷𝑆𝑆)𝐷 = ( 1 𝑛′−
1 𝑁 )𝑆𝑦
2 + 1 𝑛′ 𝑊ℎ ℎ(
1 𝑣ℎ− 1
)𝑎′𝐵ℎ𝑎
+1
𝑁 𝑊ℎ
𝑛ℎ
ℎ 𝑀𝑖 ℎ𝑖2 ( 1 𝑚ℎ 𝑖−
1 𝑀ℎ 𝑖
)𝑆ℎ𝑦𝑖2
with 𝐵ℎ= 𝑏ℎ𝑘𝑙 h=1, 2,…….,L ; k ,l=1,2,……,p
(𝑏ℎ𝑘𝑙) =( 𝑆2ℎ𝑦−𝜆𝑘𝑆ℎ𝑦𝑘− 𝜆𝑙𝑆ℎ𝑦𝑙− 𝜆𝑘𝜆𝑙𝑆ℎ𝑘𝑙)
Further for large samples, the approximate expression for the bias and mean square error of ( 𝑇𝐷𝑆𝑆)𝑅 is given by
𝐵(𝑇𝐷𝑆𝑆)𝑅 = 1 𝑛′
𝑎𝑘
𝑋 𝑘
𝑘 𝑊ℎ ℎ( 1
𝑣ℎ−1) (𝑅𝑘 𝑆ℎ𝑘
2 −𝑆 ℎ𝑦𝑘)
𝑀𝑆𝐸(𝑇𝐷𝑆𝑆)𝑅= 𝑉(𝑇𝐷𝑆𝑆)𝐷 𝜆𝑘 = 𝑅𝑘
𝜆𝑙= 𝑅𝑙 ( k, l =1,2,……,p)
Proof: Since 𝑇𝐷𝑆𝑆= 𝑎𝑘𝑡𝑘
( 𝑡𝑘)𝐷 = 𝑦 (3)−𝜆𝑘 ( 𝑥𝑘(2)− 𝑥𝑘(1) )
𝐸(𝑇𝐷𝑆𝑆)𝐷= 𝐸1𝐸2𝐸3(𝑇𝐷𝑆𝑆)𝐷
𝐸2𝐸3( 𝑡𝑘 )= 𝑦 ′
𝐸(𝑇𝐷𝑆𝑆)𝐷= 𝐸1𝐸2𝐸3(𝑇𝐷𝑆𝑆)𝐷= 𝑌
The multivariate difference estimator 𝑇𝐷𝑆𝑆 for 𝑌 is unbiased.
The exact expression for its variance is given as
V(TDSS)D= ak l kal Cov (tk,tl)
Cov(tktl) = V y 3 −λlCov(y 3 ,x l 2 )
+λkCov(y 3 ,x k 1 )−λkCov(y 3 ,x k 2 )
+ λl Cov(y (3),x l(1)) +λkλl[ Cov (x k(2),x l(2)
−Cov (x k(2),x l(1))− Cov (x k(1),x l(2))+ Cov(x k(1),x l(1))
𝑉(𝑇𝐷𝑆𝑆)𝐷 = (
1 𝑛′−
1 𝑁 )𝑆𝑦
2 + 1 𝑛′ 𝑊ℎ ℎ(
1 𝑣ℎ− 1
)𝑎′𝐵ℎ𝑎
+1
𝑁 𝑊ℎ
𝑛ℎ
ℎ 𝑀𝑖 ℎ𝑖2 ( 1 𝑚ℎ 𝑖−
1 𝑀ℎ 𝑖
)𝑆𝑖ℎ𝑦2 …( 3.4 )
with 𝐵ℎ = 𝑏ℎ𝑘𝑙 h=1, 2….,L ; k ,l=1,2,……,p
(𝑏ℎ𝑘𝑙) = (𝑆2ℎ𝑦−𝜆𝑘𝑆ℎ𝑦𝑘− 𝜆𝑙𝑆ℎ𝑦𝑙− 𝜆𝑘𝜆𝑙𝑆ℎ𝑘𝑙)
where 𝑆ℎ𝑘𝑙 =𝑁1
ℎ −1 𝑥ℎ𝑘𝑖− 𝑋 ℎ𝑘 𝑥ℎ𝑙𝑖 − 𝑋 ℎ𝑙
𝑁ℎ
𝑖
𝑆2 ℎ𝑦𝑖 = 𝑀1
ℎ 𝑖 −1 (𝑦ℎ𝑖𝑗
𝑀𝑖ℎ
𝑗 − 𝑌 𝑖ℎ)2
To obtain the bias and mean square error of multivariate ratio estimator (𝑇𝐷𝑆𝑆)𝑅 we use the delta notation
𝑒𝑜 = 𝑦 (3) −𝑌
𝑌 𝑒1 = 𝑥 𝑘 (2) −𝑋 𝑘
𝑋 𝑘 𝑒2 =
𝑥 𝑘 (1) −𝑋 𝑘
𝑋 𝑘
𝑦 (3) = 𝑌 [1+𝑒𝑜] 𝑥 𝑘(2) = 𝑋 𝑘[1+ 𝑒1] 𝑥 𝑘(1) = 𝑋 𝑘[1+ 𝑒2]
now equation (3.3) becomes
( 𝑇𝐷𝑆𝑆)𝑅 = 𝑎𝑘𝑌 [1+𝑒𝑜] [1+ 𝑒1]−1 [1+ 𝑒2]
𝐵(𝑇𝐷𝑆𝑆)𝑅 = 1 𝑛′
𝑎𝑘
𝑋 𝑘
𝑘 𝑊ℎ ℎ( 1 𝑣ℎ−
1) (𝑅𝑘𝑆ℎ𝑘2 −𝑆ℎ𝑦𝑘 )
𝑀(𝑇𝐷𝑆𝑆)𝑅 = ( 1 𝑛′−
1 𝑁 )𝑆𝑦
2 + 1 𝑛′ 𝑊ℎ ℎ(
1 𝑣ℎ− 1
)𝑎′𝐵ℎ𝑎
+1
𝑁 𝑊ℎ
𝑛ℎ
ℎ 𝑀𝑖 ℎ𝑖2 ( 1 𝑚ℎ 𝑖−
1 𝑀ℎ 𝑖
)𝑆𝑖ℎ𝑦2 .... (3.5)
with 𝐵ℎ = 𝑏ℎ𝑘𝑙 h=1, 2 …, L; k ,l =1,2,…….p
(bhkl) =( S2hy−RkShyk− RlShyl− RkRlShkl)
where Shkl = 1
Nh −1 xhki− Xhk xhli − Xhl
Nh
i
S2 hyi =
1
Mhi −1 (𝑦ℎ𝑖𝑗
𝑀𝑖ℎ
𝑗 − 𝑌 𝑖ℎ)2
Remark: From equation (3.4) and (3.5) is can easily be
proved that for large sample
M(TDSS)R=V(TDSS )D for λk = Rk
λl = Rl
4. OPTIMUM ESTIMATORS
Let βok = ch kh βokh / ch kh with ckh = Wh ( 1 vh −
1) S2 hk
be the weighted average of the strata population regression coefficients βokh = Shyk / S2hk of y on xk and
ρkl =
Wh h (v h1−1)ρhklShkShl
[ Wh h (v h1−1)Shk2 Wh h (v h1−1)Shl 2]1 2
where ρhkl = Shkl Shk Shl is the correlation coefficient
between xk and xl in stratum h.
For p=1, when information on only xk, is used, following Ige
and Tripathi [1] the optimum value of λ𝑘 is given by
λok =
Wh h(v1
h − 1)Shyk
Wh h(v1
h − 1)Shk
2 = βok
When the choices for each λk=βok are made for each k, the
resulting variance is given by
V(TDSS)λk=βok = (
1 n′−
1 N)Sy
2
+1
n′ Wh h( 1 vh− 1)Shy
2 (1 − ρ
yk 2 − ρ
yl 2 + ρ
ykρylρkl )
+1
N Wh
nh
h Mi hi2 ( 1 mhi −
1 Mhi )Syhi
2 .... (4.1)
Further, when optimum weight vector
ao = B−1g
g′B−1g g = (1,1, … ,1)
′
is used , we obtain
V(TDSS )λk=βok
a=ao
= (1
n′− 1 N)Sy
2
+ 1(g′B−1g)−1 W(1 − 1)S2
+1
n′ Wh
nh
h Mi hi2 ( 1 mhi−
1 Mhi )Syhi
2
In practice, when exact value ofλok=βok is not available, it may be estimated through the sample data
βok =
wh h′( v h1−1)shyk
wh′(1 v h−1)shk2 h
where shyk = 1
nh−1 (yih− y h
nh
i ) (xhki −x kh)
shk2 = s hkk
are unbiased estimator for Shyk and Shk2 respectively.
Using the estimated optimum values, we may define a multiple regression estimator for Y in DSS by
(TDSS)reg1 = y (3)− ak k βok (x k(2)−x k(1) )
for large samples, M(TDSS)reg would again be given by (4.1).
One may in fact obtain simultaneous optimum value of
Tk = akλk (k = 1,2, ..., p) as follows.
Let S∗= (S kl
∗ ) Q = (Q
1, Q2, … . . , Qp)′
where Skl∗ = W h h (
1
vh− 1)Shkl
Qk = Syk∗ k,l=1,2,…,p
then V(TDSS) = (n1′−
1 N)Sy
2 +1
n′ (Sy∗2−2T′Q + T′S∗T )
+1
N Wh
nh
h Mi hi2 ( 1 mhi−
1 Mhi )Syhi
2
which gives Topt = To = S∗−1Q
V(TDSS)opt = (n1′− 1 N)Sy
2 +1
n′ Sy∗2 1 − R2
+1
N Wh
nh
h Mi hi2 ( 1 mhi−
1 Mhi )Syhi
2 ….(4.2)
where R2 = Q′S∗−1Q Sy∗2
and R being the multiple is the correlation coefficient between y (3) and ( xk(2)− xk(1) ).
The optimum value of T may be estimated by
𝑇 = S ∗−1Q S ∗ = (S kl
∗ ) Q =(Q
1, Q2, … … . , Qp)′
where S kl∗ = w h
′
h ( 1
vh− 1)shkl
Qk= S yk∗
Using these estimated values, we may define a multiple regression estimator based on DSS for
Y
as(TDSS)reg = y (3)− Tk k∗ (x k(2)−x k(1) )
5. COMPARISION
In this section we compare the proposed multivariate difference and ratio estimators based on DSS with Prabha [2]
in Unstratified Double Sampling (USDS) where second sample is a simple random at size n from the first random sample 𝑛′instead of being selected in the form of stratified sub-samples.
The multivariate difference and ratio estimator for the difference and ratio estimator for the population mean in USDS for the population mean in USDS are defined by:
𝑇 = 𝑎𝑝𝑘 𝑘𝑑𝑘
where ( 𝑑𝑘)𝐷 = 𝑦 𝑤− 𝜆𝑘( 𝑥 𝑤− 𝑥 ′𝑤)
(𝑑k )𝑅 = 𝑦 𝑤
𝑥 𝑤 𝑥
′
𝑤 k=1,2,……,p
where the weights 𝑎𝑘 (k=1,2,….p) add ud to unity and 𝜆𝑘 are
suitably chosen constants with
𝑉(𝑇 )𝐷= (n1′−
1 N)Sy
2+ 1 n−
1 n′ a′Ba
+ 1
𝑛𝑁 𝑀𝑖 2 𝑁 𝑖 (
1 𝑚𝑖−
1 𝑀𝑖 )𝑆𝑖𝑦
2 …(5.1)
with B=(𝑏𝑘𝑙)
(𝑏𝑘𝑙) = (𝑆𝑦2− 𝜆𝑘𝑆𝑦𝑘− 𝜆𝑙𝑆𝑦𝑙+ 𝜆𝑘𝜆𝑙𝑆𝑘𝑙)
𝑀(𝑇 )𝑅= (
1 n′−
1 N)Sy
2+ 1 n−
1 n′ a′Ba
+ 1
𝑛𝑁 𝑀𝑖 2 𝑁 𝑖 (
1 𝑚𝑖−
1 𝑀𝑖 )𝑆𝑖𝑦
2 …(5.2)
with B= (𝑏𝑘𝑙)
(𝑏𝑘𝑙) = (𝑆𝑦2− 𝑅𝑘𝑆𝑦𝑘− 𝑅𝑙𝑆𝑦𝑙+ 𝑅𝑘𝑅𝑙𝑆𝑘𝑙)
𝑀(𝑇)𝑅= 𝑉(𝑇)𝐷
We note that both of ( 𝑇𝐷𝑆𝑆)𝐷 and (T )𝐷 are unbiased and
both have exact expression for their variances for all sample sizes while ( 𝑇𝐷𝑆𝑆)𝑅 and ( T )𝑅 are biased and the expression
for their MSE is approximated (for large samples). Further, the information on 𝑥1, 𝑥2, … , 𝑥𝑝 is basic for all the above
estimators, it is being used both for stratification as well as for constructing estimators in case of DSS while only for defining estimators in case of USDS.
Using
𝑆𝑘𝑙= 𝑊ℎ ℎ𝑆ℎ𝑘𝑙+ 𝑊ℎ ℎ(𝑥 𝑘ℎ− 𝑋 𝑘) (𝑥 𝑙ℎ− 𝑋 𝑙)
𝑆𝑦𝑘= 𝑊ℎ ℎ𝑆ℎ𝑦𝑘+ 𝑊ℎ ℎ(𝑌 ℎ− 𝑌 ) (𝑥 𝑘ℎ− 𝑋 𝑘)
we get 𝑏𝑘𝑙= (𝑆𝑦2− 𝜆𝑘𝑆𝑦𝑘− 𝜆𝑙𝑆𝑦𝑙+ 𝜆𝑘𝜆𝑙𝑆𝑘𝑙)
= 𝑊ℎ ℎ(𝑆ℎ𝑦2 − 𝜆𝑘𝑆ℎ𝑦𝑘− 𝜆𝑙𝑆ℎ𝑦𝑙+ 𝜆𝑘𝜆𝑙𝑆ℎ𝑘𝑙)
+ 𝑊ℎ ℎ(𝑌 ℎ− 𝑌 )2− 𝜆𝑘(𝑌 ℎ− 𝑌 ) (𝑥 𝑘ℎ− 𝑋 𝑘)
− 𝜆𝑙(𝑌 ℎ− 𝑌 ) (𝑥 𝑙ℎ− 𝑋 𝑙) +𝜆𝑘𝜆𝑙(𝑥 𝑘ℎ− 𝑋 𝑘)(𝑥 𝑙ℎ− 𝑋 𝑙)
For comparisons assuming
𝑛ℎ
𝑛ℎ′ = 𝑛 𝑛′= 𝑣ℎ
𝑉 𝑇𝐷𝑆𝑆 =(𝑛1′−
1 𝑁)𝑆𝑦
2+
( 1
𝑛− 1
𝑛′) 𝑎𝑘𝑎𝑙 𝑊ℎ ℎ(𝑆ℎ𝑦2 − 𝜆𝑘𝑆ℎ𝑦𝑘− 𝜆𝑙𝑆ℎ𝑦𝑙+ 𝜆𝑘𝜆𝑙𝑆ℎ𝑘𝑙)
+1
𝑛′ 𝑊ℎ
𝑛ℎ
ℎ 𝑀𝑖 ℎ𝑖2 (𝑚1
ℎ 𝑖−
1 𝑀ℎ 𝑖 )𝑆ℎ𝑦𝑖
2
Then 𝑉(𝑇)𝐷− 𝑉(𝑇𝐷𝑆𝑆)𝐷= ( 1 𝑛−
1
𝑛′) 𝑎𝑘𝑎𝑙 𝑊ℎ ℎ𝑑ℎ𝑘𝑙
(1)
where 𝑑ℎ𝑘𝑙(1)= (𝑌 ℎ− 𝑌 )2− 𝜆𝑘(𝑌 ℎ− 𝑌 ) (𝑥 𝑘ℎ− 𝑋 𝑘)
− 𝜆𝑙(𝑌 ℎ− 𝑌 ) (𝑥 𝑙ℎ− 𝑋 𝑙) +𝜆𝑘𝜆𝑙(𝑥 𝑘ℎ− 𝑋 𝑘)(𝑥 𝑙ℎ− 𝑋 𝑙)
= ( 𝑌 ℎ− 𝑌 − 𝜆𝑘(𝑥 𝑘ℎ− 𝑋 𝑘)) ( 𝑌 ℎ− 𝑌 − 𝜆𝑙(𝑥 𝑙ℎ− 𝑋 𝑙))
= ( 1
𝑛− 1
𝑛′) 𝑊ℎ ℎ𝑎′𝐷ℎ
(1)
𝑎
𝐷ℎ(1)= 𝑑ℎ𝑘𝑙(1)
𝑀(𝑇)𝑅− 𝑀(𝑇𝐷𝑆𝑆)𝑅= (
1 𝑛−
1
𝑛′) 𝑎𝑘𝑎𝑙 𝑊ℎ ℎ𝑑ℎ𝑘𝑙
(2)
𝐷ℎ(2)= 𝑑ℎ𝑘𝑙(2)
𝑑ℎ𝑘𝑙(2) = [(𝑌 ℎ− 𝑅𝑘𝑋 𝑘ℎ] [(𝑌 ℎ− 𝑅𝑙𝑋 𝑙ℎ] 𝑘, 𝑙 = 1,2, … . . , 𝑝
It is to be noted that 𝐷ℎ(1) and 𝐷ℎ(2) are positive definite matrices which proves that under proportional allocation of the second sample, the multivariate difference and ratio estimators in DSS are always better than corresponding estimators in UDSS.
6. EMPIRICAL STUDY
To show the usefulness ofthe proposed estimators based on DSS compared to estimators based on UDSS suggested by Prabha (1992) in two stage design. It can be checked by comparing their variances and percent relative efficiency, numerically, an empirical study has been carried out.
Population: For this we consider the 2001 census data which
is relates to the total number of agricultural labourers, total area, total population, and total no. of cultivators of 444 villages of Bhiwani district of Haryana. We take number of agricultural labourers in villages as y ,the total area of villages as𝑥1 , the total population of villages as 𝑥2 ,and the total no. of
cultivators as 𝑥3.The whole population of Bhiwani district
(444 villages) is divided into villages at fsu level and household at ssu level.
The whole population of 444 village’s fsus is stratified into three strata according to area. So the strata become as under:
Strata Area in Hectare
I 1-800 (227 villages) II 800- 1660 (135 villages) III 1660-2400 & above ( 82 villages)
relative efficiency of each of the estimator given in this paper is calculated. The result are presented in the form of Table II given below
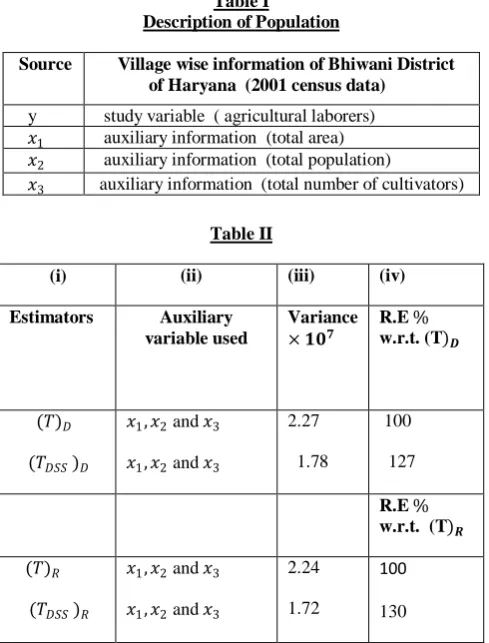
Table I
Description of Population
Source Village wise information of Bhiwani District
of Haryana (2001 census data)
y study variable ( agricultural laborers) 𝑥1 auxiliary information (total area)
𝑥2 auxiliary information (total population)
𝑥3 auxiliary information (total number of cultivators)
Table II
(i) (ii) (iii) (iv)
Estimators Auxiliary
variable used
Variance
× 𝟏𝟎𝟕 R.E % w.r.t. (T)
𝑫
(𝑇)𝐷
(𝑇𝐷𝑆𝑆 )𝐷
𝑥1, 𝑥2 and 𝑥3
𝑥1, 𝑥2 and 𝑥3
2.27 1.78
100 127
R.E %
w.r.t. (T)𝑹
(𝑇)𝑅
(𝑇𝐷𝑆𝑆 )𝑅
𝑥1, 𝑥2 and 𝑥3
𝑥1, 𝑥2 and 𝑥3
2.24 1.72
100
130
7. CONCLUSION
From table II, column III, we interpret that the estimators based on DSS give less variance as compare to USDS and in column IV estimators based on DSS have more relative efficiency as compare to USDS.
From the perusal of above table we conclude that estimators based on DSS at fsu level in two stage design as compare to
the estimators based on USDS. Thus the estimator ( 𝑇𝐷𝑆𝑆)𝐷
and ( 𝑇𝐷𝑆𝑆)𝑅 are recommended for used in practice for the
estimation of population mean
8. REFERENCES
[1] Ige, A.F. and Tripathi, T.P. 1987. On double sampling for stratification and use of auxiliary information. Jour. Ind. Soc. Ag. Stat. 39, 191-201.
[2] Prabha, S. 1992. On Some Estimation Problems in Sampling Using Multiauxiliary Information. Ph.D Thesis, M.D. University, Rohtak
[3] Rao, J.N.K. 1973. On double sampling for stratification and analytical surveys. Biometrika 60, 125-133.
[4] Shabbir, J. and Gupta S. 2011. On Estimating Finite Population Mean in Simple and Stratified Random Sampling. Commun. in Stat. 40, 199-212.
[5] Singh, H.P. and Vishwakarma, G.K. 2010. A general procedure for estimating the population mean in Stratified sampling using auxiliary information, Metron, vol LXVIII, no.1, 47-65.
[6] Sukhatme, P. V., Sukhatme, B.V. Sukhatme, S. and Ashok, C. 1984.Sampling Theory of Surveys with Applications, Iowa State University Press, Ames, Iowa.
[7] Tripathi, T.P. 1976. On double sampling for multi- -variate ratio and difference methods of estimation. Jour. Ind. Soc. Agr. Stat. 38, 33-34.
[8] Tripathi, T. P. and Bahl, S. 1991. Estimation of mean using double Sampling for Stratification and Multi auxiliary Information, Common. Statist. Theory Meth.. 20, 8, 2589-2602.