BIROn - Birkbeck Institutional Research Online
Berggren, Nick and Eimer, Martin (2016) Does contralateral delay activity
reflect working memory storage or the current focus of spatial attention within
visual working memory? Journal of Cognitive Neuroscience 28 (12), pp.
2003-2020. ISSN 0898-929X.
Downloaded from:
Usage Guidelines:
Please refer to usage guidelines at or alternatively
1
Running Head: Visual Working Memory and the CDA
Does contralateral delay activity reflect working memory storage or the current focus of spatial attention within visual working memory?
Nick Berggren and Martin Eimer
Department of Psychological Sciences, Birkbeck College, University of London, Malet Street, London WC1E 7HX, UK
Phone: 0044 20 76316522 Fax: 0044 20 76316312
2
ABSTRACT
During the retention of visual information in working memory, event-related brain potentials show a sustained negativity over posterior visual regions contralateral to the side where memorised stimuli were presented. This contralateral delay activity (CDA) is generally believed to be a neural marker of working memory storage. In two experiments, we contrasted this storage account of the CDA with the alternative hypothesis that the CDA reflects the current focus of spatial attention on a subset of memorized items set up during the most recent encoding episode. We employed a sequential loading procedure where participants memorised four task-relevant items that were presented in two successive memory displays (M1 and M2). In both experiments, CDA components were initially elicited contralateral to task-relevant items in M1. Critically, the CDA switched polarity when M2 displays appeared on the opposite side. In line with the attentional activation account, these reversed CDA components exclusively reflected the number of items that were encoded from M2 displays, irrespective of how many M1 items were already held in working memory. On trials where M1 and M2 displays were presented on the same side, and on trials where M2 displays appeared non-laterally, CDA components elicited in the interval after M2 remained sensitive to a residual trace of M1 items, indicating that some activation of previously stored items was maintained across encoding episodes. These results challenge the hypothesis that CDA amplitudes directly reflect the total number of stored objects, and suggest that the CDA is primarily sensitive to the activation of a subset of working memory representations within the current focus of spatial attention.
3
INTRODUCTION
Working memory is defined as the active short-term maintenance of information that is not currently perceptually available. In standard working memory paradigms, where items have to be maintained during a delay period in order to be matched to a subsequent test display, sustained neural delay period activity is often seen within dorsolateral prefrontal cortex, for both humans (e.g., Sakai, Rowe, & Passingham, 2002) and primates (e.g., Fuster & Alexander, 1971), suggesting that prefrontal cortex may play a central role in the temporary maintenance of information in working memory (e.g., Goldman-Rakic, 1990). However, more recent work has demonstrated sustained delay activity during working memory maintenance in areas outside prefrontal cortex, and specifically within visual-perceptual areas (e.g., Emrich, Riggall, LaRocque, & Postle, 2013; Ranganath, Cohen, Dam, & D’Esposito, 2004). This has led to an alternative “sensory recruitment” account of working memory (e.g., Awh & Jonides, 2001; Postle, 2005, 2006; D’Esposito, 2007; Harrison & Tong, 2009; Sreenivasan, Curtis, & D’Esposito, 2014). According to this account, the storage functions of working memory are primarily implemented by modality-specific sensory brain areas that are also involved in the perceptual analysis of incoming information, while the sustained activation of prefrontal areas during working memory tasks reflects higher-level control aspects of working memory tasks, such as the maintenance of specific task goals or the inhibition of currently task-irrelevant information.
4
currently stored in visual working memory. In line with this storage account of the CDA, it has been shown that CDA amplitudes increase when memory load is increased, and are sensitive to individual differences in working memory capacity (e.g., Vogel & Machizawa, 2004).
Although the view that the CDA reflects the storage of a set of memorized visual items in tasks where these items are relevant for a subsequent memory matching task is widely accepted, alternative accounts of the CDA have not yet been tested systematically. For example, the fact that CDA amplitudes are sensitive to manipulations of working memory load does not necessarily provide conclusive evidence for this storage hypothesis, given that sustained delay period activations in higher-level prefrontal regions that are no longer believed to be directly associated with working memory storage are also sensitive to memory load (Druzgal & D’Esposito, 2003; Rypma, Berger, & D’Esposito, 2002). In addition, recent fMRI and EEG experiments have suggested that the storage of visual items in working memory is not always reflected by neural activation measures, such as the CDA component. Lewis-Peacock, Drysdale, Oberauer, and Postle (2012) employed multivariate pattern analysis (MVPA) to decode the current content of working memory from the pattern of BOLD signals. Participants had to retain two stimuli from different categories (e.g., line segments and words). After an initial delay period, a retro-cue indicated which of these two stimuli had to be compared to an upcoming test stimulus. Following this first memory test, a second retro-cue signalled whether the same cued item or the other initially uncued item would be relevant for a second memory test. MVPA results showed that both items were initially activated in working memory, and that activity for the uncued item dropped to baseline after the first retro-cue. However, and critically, this pattern then reversed on trials where the uncued item became relevant after the second retro-cue, with a strong activation for this item and a drop to baseline for the item that was initially activated (see also LaRocque, Lewis-Peacock, Drysdale, Oberauer, & Postle, 2013, for analogous observations based on MVPA analyses of oscillatory EEG signals). These observations suggest that items that are stored in working memory can differ in their activation levels, with only a subset of focally attended memory items associated with an increase in neural activity (see LaRocque, Lewis-Peacock, & Postle, 2014, for further discussion; and Cowan, 1995; Oberauer, 2013, for related suggestions). If this is correct, activity-based neural markers of working memory such as the CDA component may not provide an exhaustive measure of memory storage.
5
been found in ERP studies where participants have to retain visual objects in working memory, very similar sustained contralateral posterior components have also been observed in multiple object tracking (MOT) tasks where observers have to continuously monitor the spatial position of moving targets (Drew & Vogel, 2008; Drew, Horowitz, Wolfe, & Vogel, 2011). Notably, the amplitude of these CDA-like components in MOT tasks is larger than in pure working memory tasks where the identity of static objects has to be maintained. Based on such observations, Drew et al. (2011) suggested that these components do not exclusively reflect working memory storage, but also the allocation of focal attention to new target locations. When considered together, the hypothesis that CDA is not exclusively associated with storage but also with spatial attention, and the proposal that spatial attention results in a transient increase in the activation level of a subset of items that are currently held in working memory (e.g., Lewis-Peacock et al., 2012; LaRocque et al., 2014), suggest an alternative to the received storage interpretation of the CDA. Instead of reflecting the sustained maintenance of all visual items that are currently stored, this component may be associated with a relative transient activation of a subset of these items that were entered into working memory during the most recent encoding episode. Furthermore, this activation may be the result of the allocation of spatial attention to these items during their encoding. The combination of these two assumptions leads to an alternative attentional activation interpretation of the CDA. According to this account, the CDA represents a lingering trace of internal spatial attention that was allocated to a set of perceptual visual representations during their encoding into working memory. This attentional activation pattern is maintained until a new set of memory items is presented and a new attentional selection episode commences.
6
memory displays, CDA components elicited during the first and second delay period should not differ in size. The results of two previous sequential loading studies by Vogel and colleagues (Ikkai, McCollough, & Vogel, 2010; Vogel, McCollough, & Machizawa, 2005) supported the storage account of the CDA. A cue indicating which side was task-relevant for the upcoming trial was followed by two successively presented memory displays that contained coloured stimuli on both sides. Participants had to encode two coloured items on the cued side from each display, and then to compare them to item pairs in two sequentially presented test displays. CDA amplitudes were larger during the interval after the second memory display than during the first delay period, in line with the hypothesis that the CDA reflects the number of visual items that are currently stored in working memory. However, while these findings are not in line with the predictions of the attentional activation account, they are not sufficient to completely rule out this alternative hypothesis. In these two previous studies, participants always encoded items on the same side of the two successive memory displays. It may therefore not have been necessary to activate a new spatially separate focus of attention during the encoding of the second memory display, and the CDA amplitude increase during the second delay period may therefore reflect the addition of new items within an already established focus of spatial attention.
task-7
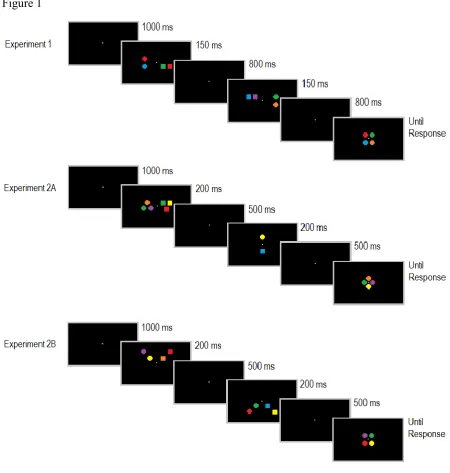
relevant item and M2 three of these items. In ‘3 to 1’ trials, this order was reversed. In all memory displays, task-relevant items were accompanied by the same number of irrelevant items on the opposite side. Trials for each of these three different load conditions were presented in random order in each block. M1 and M2 displays were followed by the same centrally presented test displays in all types of trials (see Figure 1 for illustration). This was done to ensure that the two memorized displays would have to be compared in the same way to physically identical test displays on all trials, regardless of the number of items contained in the task-relevant M1 and M2 displays, and regardless of whether these displays appeared on the same side or on different sides. This task design differs somewhat from the standard change detection procedures used in previous CDA studies (e.g., Vogel & Machizawa, 2004), where a single memory display was followed by a test display on the same side. In the present task, participants had to integrate the information from two successively presented memory displays, in order to compare it to a test display that appeared at a different location (see the General Discussion for further considerations).
8
number of items that had to be encoded from these displays, regardless of how many items had to be memorized from the previous M1 displays. For example, there should be no CDA amplitude increase between the first and second delay period on ‘2 to 2’ same-side trials, because the same number of memory items was present in M1 and M2 displays.
The alternative storage account of the CDA predicts that CDA amplitudes reflect the total number of items from M1 and M2 displays that are successfully stored in working memory during the two retention periods. For same-side trials, the storage account predicts that, in line with previous observations (Vogel et al., 2005; Ikkai et al., 2010), CDA amplitudes should generally be larger during the second relative to the first delay period, because more items are retained in working memory after M2 was presented. On different-side trials, the CDA will reflect the combined contribution of successfully retained memory items from M1 and M2. Because CDA components of opposite polarity are triggered when M1 and M2 items on different sides are simultaneously maintained, the absolute CDA amplitude measured in the delay period after M2 will reflect the difference between the number of M1 and M2 items that are stored during this period. For example, if participants retained the same number of M1 and M2 items on ‘2 to 2’ different-side trials, no CDA should be present at all after M2 has been presented, because two CDA components of equal size and opposite polarity will cancel each other out. On ‘3 to 1’ trials, the CDA obtained in the post-M1 period should be attenuated but still be reliably present following M2 if participants retain more M1 items on these trials. On ‘1 to 3’ different-side trials, the CDA measured after M1 should reverse polarity during the second delay period, as more M2 items are now memorized during this period. To compare these predictions of the storage account with the actual pattern of CDA components measured on different types of trials, it is important to determine how many M1 and M2 items were in fact retained on these trials. We therefore computed separate measures of working memory capacity for items presented in the first and second memory displays, for the three different load conditions, and for same-side and different-side trials. According to the storage account, the CDA elicited during the second delay period should reflect the sum of the items that are successfully remembered from M1 and M2 displays on same-side trials, and the difference between successfully retained M1 and M2 items on different-side trials.
9 Method
Participants
Fourteen participants were recruited for Experiment 1. Two participants were excluded due to excessive eye-movements within trials, or showing average negative HEOG deflections on the remaining trials exceeding ±2 µV, indicative of eye movements during maintenance (calculated by subtracting HEOGs recorded ipsilaterally to the cued side of memory display items from contralateral HEOG waveforms, see Grubert & Eimer, 2015; Kang & Woodman, 2014). The remaining 12 participants (M age = 31 years, SD = 6, 6 male, 2 left-handed) all had normal or corrected-to-normal vision and were naïve to the experimental hypotheses.
Stimuli and Procedure
E-Prime 2.0 (Psychology Software Tools, Inc.) was used to create and execute the experiment. Stimuli were presented on a 24-inch BenQ monitor (60Hz; 1920 x 1080 screen resolution) at a viewing distance of approximately 90 cm, controlled on a SilverStone computer PC. Participants’ manual responses were registered via keyboard button presses. Trial displays were presented on a black background, with a grey fixation dot (0.19° x 0.19° of visual angle) appearing constantly throughout each block. Two sets of memory displays were presented sequentially on each trial. Each memory display contained item(s) in the left and right visual field that appeared at an eccentricity of 0.95° from fixation (measured relative to the centre of an imaginary square made up of all four memory items on one side). The size of each of these items was 0.19° x 0.19°, and the size of the area that was occupied by the combination of all four items on one side was 0.83° x 0.83°. Following the sequential presentation of these bilateral memory displays, a test display containing a full square of four items (0.83° x 0.83°, centred at fixation) appeared. All items were either circles or squares, and were presented in one of six possible colours: red (CIE coordinates: .605/.322), orange (.543/.409), yellow (.405/.470), green (.296/.604), blue (.169/.152), or magenta (.270/.134). All colours were equiluminant (14 cd/m2).
10
800 ms maintenance period with a blank screen, the second bilateral memory display (M2; 150 ms duration), another blank maintenance period of 800 ms, and the central test display that remained present until a response was registered. Participants’ task was to memorize the coloured items on one side of the M1 and M2 displays, to combine these two sets of task-relevant colours and to compare them to the four items in the test display, in order to decide whether this display fully matched the combined colour sets or not. The items on the left and right side of the two memory displays always differed in their shape (circles versus squares), and the shape of these items determined whether they had to be memorized. Half of all participants were instructed to memorize the colours of the squares, and to ignore the circles in the memory displays. For the other six participants, circles were task-relevant and squares had to be ignored. The side on which circles and squares were presented was independently determined for each memory display. As a result, to-be-memorized items appeared on the same side in the M1 and M2 displays on 50% of all trials (left-left or right-right; same-side trials), and on opposite sides on the other 50% (left-right or right-left; different-side trials).
There were three sequential load conditions that were presented in random order in all blocks. For all three load conditions, participants had to memorize a total of four items that were fully specified once M2 was presented. In ‘2 to 2’ trials, two of these items were presented in M1 and two in M2. In ‘3 to 1’ trials, M1 displays contained three task-relevant items and M2 displays only one. In ‘1 to 3’ trials, there was only one task-relevant item in M1, and the remaining three items were presented in M2. The same number of items appeared on both sides of each memory display. For example, on ‘1 to 3’ trials, the M1 displays contained one circle and one square on opposite sides, and the M2 displays included three squares and three circles. The combination of the four squares/circles across M1 and M2 always yielded sets of four items arranged in an imaginary square, matching the spatial arrangement of the test display. Thus, the location(s) that were left unoccupied in the M1 displays were filled in the M2 displays (see Figure 1 for illustration). For the ‘2 to 2’ condition, the two items on either side of the memory displays were always horizontally or vertically aligned (i.e., they never appeared diagonally of each other). All six colours were equally likely to appear in the memory displays, with the constraint that the combination of the sets of squares and circles across M1 and M2 never contained two items with the same colour.
11
On half of all trials, the colours and spatial location of the four items in the test displays matched the combined set of task-relevant coloured shapes across the M1 and M2 displays. On the other half, one of the four items in the test displays appeared in a different non-matching colour. Participants indicated whether or not the test display contained the same items that had been memorised by pressing the ‘1’ and ‘2’ keys on the numeric keypad with the right index and middle fingers for matches and mismatches, respectively. Performance accuracy was strongly emphasised. Participants completed two practice blocks of 12 trials, prior to 16 experimental blocks of 48 trials. There were 24 same-side trials and 24 different-side trials in each block, with eight randomly intermixed same-side and eight different-side trials for each of the three load conditions in every block. The test display matched the memorized stimulus set on half of these trials, and contained one mismatching item on the other half.
EEG Recording and Analysis
EEG was DC-recorded from 27 scalp electrodes, mounted on an elastic cap at sites Fpz, F7, F8, F3, F4, Fz, FC5, FC6, T7, T8, C3, C4, Cz, CP5, CP6, P9, P10, P7, P8, P3, P4, Pz, PO7, PO8, PO9, PO10, and Oz. A 500-Hz sampling rate with a 40 Hz low-pass filter was used, with no other offline filters applied. Channels were referenced online to a left-earlobe electrode, and re-referenced offline to an average of both earlobes. Trials with eye-movements (exceeding ±30 µV in the HEOG channels), eye blinks (exceeding ±60 µV at Fpz) and movement-related artifacts (exceeding ±80 µV at all other channels) were rejected. The remaining trials were segmented into 2000 ms epochs (from 100 ms before to 1900 ms after M1 display onset). Averaged ERP waveforms were computed for trials where M1 and M2 displays appeared on the same side left or right-right) and on different sides (left-right or (left-right-left), separately for each of the three load conditions. CDA amplitudes in response to M1 displays were quantified based on ERP mean amplitudes obtained between 300 and 950 ms after M1 onset at lateral posterior electrode sites PO7/PO8 contralateral and ipsilateral to the task-relevant memory display items. For the CDA to M2 displays, a corresponding measurement window was employed (300-950 ms relative to M2 onset).
12
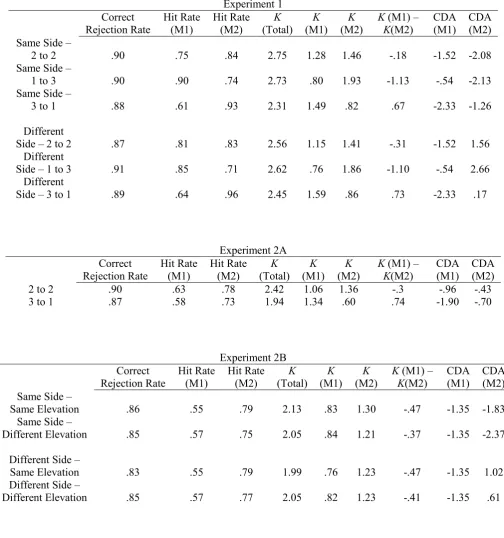
To assess participants’ overall working memory capacity in the memory matching task, K-values were calculated using the formula K = (hit rate + correct rejection rate -1) x N, as described by Cowan (2001), with N=4, representing memory set size. Separate K-values were computed for each Load Condition and for trials where M1 and M2 memory displays appeared on the same side or on different sides. To estimate working memory capacity separately for items presented in M1 and M2 displays, hit rates were computed separately for those change trials where the changed item in the central test display replaced an item that was shown in the first or in the second memory display. This was done separately for each participant for same-side and different-side trials, and for each of the three Load Conditions. Separate K-values were then computed for each participant on the basis of these hit rates and the overall correct rejection rates for a particular Load Condition. For example, to estimate the number of M1 items that were successfully retained in ‘2 to 2’ different-side trials, the formula K [M1] = (hit rate [M1; 2 to 2; Different Side] + correct rejection rate [2 to 2; Different Side] -1) x 2 was employed with N=2 representing the number of items presented in M1. For the corresponding calculation for K-values for M2 items, the respective hit rate for trials where the change occurred for an item in the second display. For ‘3 to 1’ and ‘1 to 3’ trials, memory set size (N) was based on the number of items (one or three) that appeared in M1 and M2. The top panels in Table 1 show correct rejection rates, hits for M1 and M2, total
K-values, separate K-values for M1 and M2, and the difference between these two K values, for same-side and different-side trials in each Load Condition, averaged across all participants in Experiment 1.
Results
Behavioural Performance
To obtain an overall estimate of participants’ working memory capacity, K-values were computed for each Load Condition, and for trials where M1 and M2 memory displays appeared on the same side or on different sides. The resulting average K-values for the three Load Conditions are shown in Table 1 (K[total]. A 3x2 repeated-measures ANOVA with the factors Load Condition (‘1 to 3’, ‘2 to 2’, ‘3 to 1’) and Side (Same, Different) for these K -values showed a significant main effect of Load Condition (F(2,22) = 5.39, p < .02, ηp2 =
13
to 2’ conditions (t < 1), but was lower in the ‘3 to 1’ condition (t’s > 2.72, p’s = .02). There was no main effect of Side (F < 1), and no interaction between Load Condition and Side (F(2,22) = 2.22, p > .10, ηp2 = .17).
Next, we estimated working memory capacity separately for items in the first and second memory display, for same-side and different side trials in each Load Condition. These estimates were based on the percentage of correctly reported changes of an item in the test display that was first presented either in M1 or M2 for each Load Condition, and the correct rejection rate in this Load Condition (see Methods section for details). Table 1 (top panels) shows mean correct rejection and hit rates for each Load Condition, together with the estimated memory capacity for M1 and M2 items, and the difference in K-values for items in M1 versus M2 displays. In this column, a negative value indicates that more M2 items were successfully retained. As can be seen from this Table, there was an overall tendency for better retention of M2 items. When M1 and M2 displays both contained two items (‘2 to 2’ condition), participants retained on average 1.28 M1 items and 1.46 M2 items on same-side trials, and 1.15 versus 1.41 M1/M2 items on different-side trials. These K-values were analysed in a 2x2x3 ANOVA with the factors Display (M1, M2), Side (Same, Different), and Load Condition. There was a main effect of Display (F(1,11) = 12.83, p < .005, ηp2 = .54),
confirming that K-values are generally higher for memory items in M2 displays (M = 1.39 vs. 1.18). A main effect of Load Condition (F(2,22) = 5.54, p < .02, ηp2 = .34) confirmed the
result of the overall analysis that K-values on ‘3 to 1’ trials were generally lower than on ‘2 to 2’ and ‘1 to 3’ trials (see Table 1).There was no main effect of Side (F < 1). A significant Display x Load Condition interaction (F(2,22) = 41.01, p < .001, ηp2 = .79) was due to the
unsurprising fact that K-values increased as a function of the number of items that were presented in a particular M1 or M2 display. There were no interactions between Display and Side (F < 1), Side and Load (F(2,22) = 2.28, Ip = .13), and no three-way interaction between these factors (F < 1). Direct comparisons of the number of items successfully retained from M1 and M2 displays with paired t-tests were therefore based on K-values that were averaged across same-side and different-side trials. In the ‘2 to 2’ condition, participants’ retention rates were reliably higher for M2 relative to M1 items; M = 1.22 vs. 1.43; t(11) = 2.27, p < .05). On ‘1 to 3’ trials, more M2 items were successfully retained (M = 1.89 vs. 0.78; t(11) = 8.29, p < .001). On ‘3 to 1’ trials, participants retained a larger number of M1 items (M = 1.54 vs. 0.84; t(11) = 4.64, p = .001).
14
---
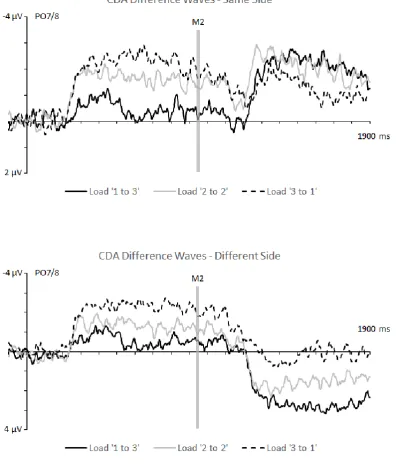
CDA components to M1 displays
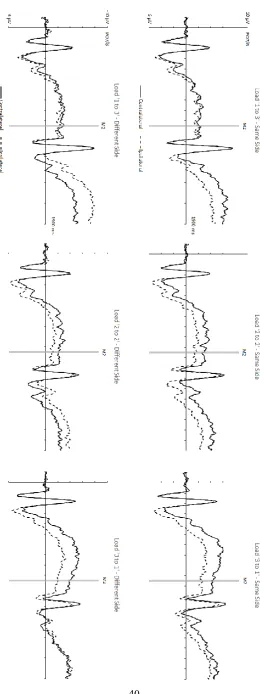
Figure 2 shows CDA components elicited at PO7/8 in response to M1 and M2 displays in the three different load conditions, separately for same-side and different-side trials. The corresponding CDA difference waveforms obtained by subtracting ipsilateral from contralateral ERPs are shown in Figure 3. As expected, CDA components were initially elicited contralateral to the side of the task-relevant memory items in M1 displays. The amplitude of these components reflected the number of M1 items that had to be encoded into working memory in the three different load conditions, with CDA components largest in ‘3 to 1’ trials, and smallest in ‘1 to 3’ trials. Because the side of the task-relevant items in M2 was unpredictable at the time when CDA components to M1 displays were elicited, analyses of these components were collapsed across same-side and different-side trials. Mean CDA amplitudes measured during the 300-950 ms interval after M1 onset were entered into a 3x2 repeated-measures ANOVA with the factors M1 Load (1,2,3) and Laterality (ipsilateral, contralateral). A main effect of M1 Load (F(2,22) = 29.06, p < .001, ηp2 = .73) was due to the
fact that posterior ERPs were generally more negative when more items had to be encoded (see Figure 2). More importantly, there was a main effect of Laterality (F(1,11) = 37.48, p < .001, ηp2 = .77), reflecting the presence of CDA components, which interacted with M1 Load
(F(2,22) = 46.48, p < .001, ηp2 = .82). Follow-up analyses of CDA difference amplitudes
obtained by subtracting ipsilateral from contralateral waveforms (as shown in Figure 3) confirmed that CDA amplitudes differed reliably between all three M1 Load conditions (all
t’s > 4.59, p’s ≤ .001). CDA components were smallest for an M1 Load of 1 (M diff = -.54 µV), intermediate at Load 2 (M diff = -1.52 µV) and largest for Load 3 (M diff = -2.33 µV), confirming the general increase of CDA amplitudes with increasing working memory load. Additional analyses conducted for each M1 Load condition confirmed that CDA components were reliably present in all three conditions (all t’s > 2.59, p’s < .03).
--- Insert Figure 2 about here ---
15
As can be seen in Figures 2 and 3, CDA components in response to M2 displays differed systematically between same-side and different side trials. For same-side trials, these components showed the same polarity as the CDAs that were triggered by M1 displays. CDA amplitudes during the second delay period were smaller on ‘3 to 1’ relative to ‘2 to 2’ and ‘1 to 3’ same-side trials. Relative to the CDA elicited in the first delay period, CDA amplitudes increased on ‘2 to 2’ and ‘1 and 3’ trials, but decreased on ‘3 to 1’ trials. When M1 and M2 were presented on different sides, CDA components during the second delay period reversed polarity for ‘2 to 2’ and ‘1 to 3’ trials, and appeared to be absent on ‘3 to 1’ trials.
To confirm these informal observations, ANOVAs of ERP mean amplitudes in the 300-950 ms interval after M2 onset were conducted separately for same-side and different-side trials, with the factors M2 Load (1, 2, or 3, corresponding to the ‘3 to 1’, ‘2 to 2’, and ‘1 to 3’ conditions, respectively) and Laterality. For same-side trials, a main effect of M2 Load (F(2,22) = 4.77, p < .02, ηp2 = .30) reflected an increased bilateral negativity of ERP
waveforms when the number of to-be-encoded items is increased. More importantly, there was a main effect of Laterality (F(1,11) = 38.38, p < .001, ηp2 = .78) that interacted with M2
Load (F(2,22) = 7.35, p < .01, ηp2 = .40). Reliable CDA components in response to M2
displays were present in all three load conditions (all t’s > 4.26, all p’s ≤ .001). However, the CDA was reliably smaller when M2 load was 1 (i.e., on ‘3 to 1’ trials; M diff = -1.26 µV) than when M2 load was 2 or 3 (i.e., on ‘2 to 2’ and ‘1 to 3’ trials; M diff = -2.08 and -2.13 µV; both t’s > 3.43, both p’s < .01). There was no CDA difference between M2 Loads of 2 versus 3 (t < 1).
--- Insert Figure 3 about here ---
On different-side trials, there were again main effects of M2 Load (F(2,22) = 36.51, p
< .001, ηp2 = .77) and Laterality (F(1,11) = 95.02, p < .001, ηp2 = .90), and a significant
interaction between these two factors (F(2,22) = 90.31, p < .001, ηp2 = .89). A comparison of
contralateral and ipsilateral ERPs for each M2 Load condition revealed the presence of reliable CDA components on ‘1 to 3’ and ‘2 to 2’ trials; M diff = 2.66 and 1.56 µV; both
16
of contralateral/ipsilateral difference amplitudes revealed that CDA amplitudes differed reliably between all three types of different-side trials (all t’s > 6.00, all p’s < .001).
Comparison of CDA amplitudes following M1 and M2 displays
According to the storage account, CDA amplitudes measured during the second delay period should generally be larger than CDAs during the first delay period, because more items are retained in working memory after M2 has been presented. The alternative attentional activation account assumes that CDA components only reflect the most recent encoding episode, and therefore predicts no overall increase of CDA amplitudes during the second as compared to the first delay period. This was tested on the basis of CDA difference waveforms that were computed by subtracting ipsilateral from contralateral ERP mean amplitudes. Mean amplitudes for the CDAs during the first and second delay period were then computed during the two 350-900 ms intervals after M1 and M2 onset, respectively, separately for all three load conditions and for same-side and different-side trials. CDA mean amplitudes for the first delay period after M1 onset were collapsed across same-side and different-side trials (see also Table 1, right columns). To allow a direct comparison of CDA components elicited during the two delay periods on different-side trials in spite of the fact that these components reversed polarity during the second delay period, the sign of CDA difference amplitudes during this period was inverted for these trials. In the subsequent analyses, the factor Load was specified independently for M1 and M2 displays, reflecting the number of items that had to be encoded from these displays. For example, for Load condition 1, CDA amplitudes for the first delay period were measured on ‘1 to 3’ trials, whereas CDAs for the second delay period came from ‘3 to 1’ trials. Two ANOVAs of CDA difference amplitudes were then run for same-side and different-side trials, with the factors Display (M1, M2) and Load (1,2,3). For same-side trials, a main effects of Load (F(2,22) = 30.28, p < .001, ηp2 = .73), reflected the expected load-dependent increase of CDA amplitudes. More
importantly, there was a main effect of Display (F(1,11) = 5.12, p < .05, ηp2 = .32), due to the
fact that CDA components were larger during the second delay period (see Figure 3, bottom panel). A significant Load x Display interaction (F(2,22) = 6.44, p < .01, ηp2 = .37) was due
to the fact that this CDA increase was reliably present for M1/M2 Loads of 1 and 2 (both t’s > 2.46, p’s < .05), but not for Load 3 (t < 1). On different-side trials, there was again a main effect of Load (F(2,22) = 90.07, p < .001, ηp2 = .89), but no main effect of Display (F < 1),
17
.41) for different-side trials, but comparisons of CDA amplitudes elicited during the first versus second delay period conducted separately for each M1/M2 load condition found no reliable differences (all t’s < 1.74, all p’s > .10).
Discussion of Experiment 1
The goal of Experiment 1 was to test the storage account of the CDA against an alternative attentional activation account which claims that the CDA reflects the focus of attention that was established during the most recent encoding episode. For a sequential loading task, this account predicts that CDA amplitudes reflect the number of items that were encoded from the immediately preceding memory display, regardless of whether other items were already held in working memory when this display was presented. If this was correct, CDA amplitudes elicited in response to M1 and M2 displays should exclusively reflect the number of task-relevant items in these displays. When M1/M2 memory load is held constant, the corresponding CDA components measured during the first and second delay period should therefore not be different in size. This was indeed found for different-side trials, where CDAs of opposite polarity were elicited in these two delay periods. Importantly, the size of the CDA components triggered in response to M1 displays did not differ from the size of the (opposite-polarity) CDAs to M2 displays, as predicted by the attentional activation account. In contrast, CDAs on same-side trials were significantly larger during the second delay period, which is not entirely consistent with the hypothesis that these components exclusively reflect the attentional activation of items encountered during the most recent selection episode.
18
successfully retained. This CDA should therefore have the same polarity as the CDA measured during the first delay period when more M1 items are retained, but should switch polarity when more items from M2 displays are memorized. The observation that CDA components reversed polarity on ‘1 to 3’ and ‘2 to 2’ different-side trials is therefore not necessarily inconsistent with the storage account. As can be seen in Table 1, participants’ average working memory capacity on ‘1 to 3’ trials was .76 for M1 and 1.86 for M2. This implies that a reverse-polarity CDA should be elicited during the second delay period on these trials, which was indeed the case. However, the size of this CDA was considerably larger than predicted by the storage account. The difference between the number of M1 and M2 items successfully retained (-1.1) would suggest a reverse-polarity CDA of similar amplitude to the CDA elicited by M1 displays that contain a single item. In fact, the reverse CDA on ‘1 to 3’ different-side trials was equal in size to the CDA elicited by M1 displays with three items. On ‘2 to 2’ different-side trials, participants successfully memorized on average 1.15 M1 items and 1.41 M2 items (see Table 1). Given this relatively small difference (-.31), the storage account would predict a very small reverse-polarity CDA or no significant CDA at all during the second delay period. Instead, the reverse CDA on these trials was substantial, and equal in absolute size to the CDA following M1 displays with two items. Finally, on ‘3 to 1’ different-side trials, average retention rates were 1.59 and .86 for M1 and M2 items, respectively. According to the storage account, this should have resulted in a small CDA during the second delay period with the same polarity as the CDA in response to M1 displays. However, no reliable post-M2 CDA was present at all on these trials.
Overall, the quantitative pattern of CDA amplitudes obtained on different-side trials did not provide a good fit with the predictions of the storage hypothesis, but was consistent with the attentional activation account. In contrast, the results found for same-side trials were more in line with the storage hypothesis. This pattern of results may suggest that instead of exclusively reflecting memory storage or the most recent attentional activation process, both of these factors affect the CDA component. This will be further considered in the General Discussion. Experiment 2 was conducted to obtain further evidence for a link between the CDA and storage-related working memory processes.
19
20
In Experiment 2B, M1 and M2 displays appeared with equal probability and unpredictably in each of the four quadrants of the visual field. The side (left versus right) and elevation (upper versus lower visual field) of the task-relevant items within each memory display was varied orthogonally, and only a single load condition (‘2 to 2’) was tested. Same side – same elevation and different side – same elevation trials were equivalent to the same-side and different-same-side trials of Experiment 1. The CDA results observed on these trials should therefore confirm the findings from Experiment 1. There should be a CDA polarity reversal for different side – same elevation trials, and an increase of CDA amplitudes for the second relative to the first delay period on same side – same elevation trials. The critical question concerned the CDA results on same side – different elevation trials, where M1 and M2 displays were presented in opposite quadrants of the same hemifield, and their spatial separation was identical to different side - same elevation trials. If the increase of CDA amplitudes in response to M2 displays observed previously when task-relevant M1 and M2 displays appeared on the same side was due to the addition of additional memory items to an already existing attentional focus, no such increase should be found for same side – different elevation trials in Experiment 2B, where these items appeared in different visual field quadrants and a new attentional focus should therefore be activated during the encoding of M2 displays. Alternatively, if the CDA at least partially reflects the number of M1 and M2 items that are currently stored, an increase in CDA amplitudes during the second delay period should be observed both for same side – same elevation and same side – different elevation trials.
Method
Participants
21 Stimuli and Procedure
As in Experiment 1, the items that had to be memorized in the M1 and M2 displays were defined by their shape (circles or squares, counterbalanced across participants), and participants’ task was to report whether the test display items matched the relevant items in the M1 and M2 displays or whether one test display item had a different colour. In Experiment 2A, two load conditions (‘2 to 2’ and ‘3 to 1’) were included. The items in the M1 displays were again presented on the left and right side (at an eccentricity of 0.95° from central fixation). M2 display items appeared on the vertical meridian at an eccentricity of 0.95° above and below fixation. The two sets of memory items in M1 and M2 displays were now spatially arranged in a diamond-shaped fashion (as opposed to the square-shape arrangement used in Experiment 1, see Figure 1). In the ‘2 to 2’ load condition, M1 displays always contained the left and right item of the imaginary diamond, and the remaining upper and lower items were presented in M2 displays. In the ‘3 to 1’ load condition, M1 displays included three items on either side, excluding either the upper or lower item of the imaginary diamond (randomised across displays). In M2 displays, one item was presented above and the other below fixation. Test displays contained the four items arranged in a diamond shape at fixation.
22
quadrant in opposite hemifields) was identical (0.95°). Because the distance between task-relevant M1 and M2 items on different side – different elevation trials was larger (1.35°), this M1/M2 location condition was excluded from the CDA analyses. It was included in the design of Experiment 2B to ensure that the locations of task-relevant M1 and M2 display items remained unpredictable throughout.
In Experiments 2A and 2B, M1 and M2 displays appeared for 200 ms each, and the maintenance interval following M1 and M2 displays was reduced from 800 ms to 500 ms. Participants completed two practice blocks of 12 trials prior to the experimental blocks. Experiment 2A included eight experimental blocks of 32 trials. Each block contained two trials for each combination of load (‘3 to 1’ or ‘2 to 2’), location of relevant M1/M2 items (left/upper, left/lower, right/upper, right/lower), and test display type (match or mismatch). In Experiment 2B, participants completed eight experimental blocks of 64 trials. Each of the 16 possible combinations of the task-relevant memory item locations in M1 and M2 displays (one of four possible quadrants) was presented on four trials per block (two trials where the test stimulus matched the relevant items in M1 and M2 and two trials where there was a colour mismatch).
EEG Recording and Data Analysis
EEG recording, artefact rejection, and analysis procedures were analogous to Experiment 1. Trials were segmented into epochs from 100 ms prior to 1400 ms after M1 display onset. CDA amplitudes in response to M1 displays were quantified based on ERP mean amplitudes obtained during the 300-700 ms interval after M1 display onset at posterior electrode sites PO7/PO8. CDA amplitudes following M2 displays were quantified based on mean amplitudes obtained between 1000 and 1400 ms after M1 onset (corresponding to 300-700 ms after M2 onset). The analyses of memory performance and the calculation of separate working memory capacity estimates for M1 and M2 items used the same procedures as in Experiment 1.
Results
23 Behavioural Performance
Table 1 (middle panel) shows averaged correct rejection rates and hit rates for trials where the change occurred for an item presented in M1 or M2, together with K-values for M1 and M2 and total K-values, separately for ‘2 to 2’ and ‘3 to 1’ trials. In the ‘2 to 2’ condition, there was again a recency effect, with retention rates slightly higher for M2 items. In the ‘3 to 1’ condition, more M1 items were retained, as expected. K-values for M1 and M2 items were analysed in a 2x2 ANOVA with factors Display (M1, M2) and Load Condition. There was a main effect of Load Condition (F(1,13) = 18.02, p = .001, ηp2 = .58), as K-values were
generally higher in ‘2 to 2’ trials (M = 1.21 vs. 0.97). There was no significant main effect of Display (F(1,13) = 3.71, p = .076, ηp2 = .22), but a significant interaction between Display
and Load Condition was obtained (F(1,13) = 98.58, Ip < .001, ηp2 = .88). Follow-up paired
t-tests conducted separately for each Load Condition confirmed that K-values were reliably higher for M2 relative to M1 items in the ‘2 to 2’ condition (t(13) = 2.79, p < .02). In the ‘3 to 1’ condition, participants retained more M1 items (t(13) = 5.16, p < .001).
--- Insert Figure 4 about here ---
CDA components
Figure 4 shows CDA components elicited at PO7/8 in response to M1 and M2 displays in the ‘2 to 2’ and ‘3 to 1’ conditions, together with the corresponding CDA difference waveforms obtained by subtracting ipsilateral from contralateral ERPs. Following M1 displays, CDA components emerged contralateral to the side of the task-relevant memory items, and were larger when three versus two M1 items had to be memorized. After the non-lateralised M2 displays, CDA amplitudes were strongly attenuated, and the effect of M1 load was no longer present. For CDA mean amplitudes obtained in the 300-700 ms interval after M1 display onset, a main effect of Laterality (F(1,13) = 37.34, p < .001, ηp2 = .74) was
accompanied by a significant Load Condition x Laterality interaction (F(1,13) = 21.84, p < .001, ηp2 = .63), confirming that CDA components were larger in the ‘3 to 1’ condition
24
during this time window. However, there was no Load Condition x Laterality interaction (F(1,13) = 1.33, p > .25), reflecting the absence of a CDA difference between the two load conditions. To formally show that CDA amplitudes were reduced following M2 displays relative to the CDA measured directly in response to M1 displays, mean amplitudes obtained in the 300-700 ms intervals after M1 and M2 onset were analysed together, with Display (M1, M2) as additional factor (see also Table 1, right columns). A main effect of Laterality (F(1,13) = 34.00, p < .001, ηp2 = .72) was accompanied by an interaction between Laterality
and Display (F(1,13) = 16.74, p = .001, ηp2 = .56), confirming that CDA components
following M2 were reduced in size relative to CDAs triggered immediately after M1 (M diff = -.57 μV versus -1.43 μV; see Figure 4, lower panel). There was also a three-way interaction between Laterality, Display, and Load Condition (F(1,13) = 14.88, p < .005, ηp2 = .53),
reflecting the fact that load-dependent CDA modulations were present after M1, but were eliminated following M2 onset.
Experiment 2B
Behavioural Performance
Table 1 (bottom panel) shows averaged correct rejection rates and hit rates, together with K-values for M1 and M2 and total K-values, separately for the four trial conditions included in Experiment 2B. Overall, retention was better for M2 items relative to M1 items in all trial conditions. The K-values for M1 and M2 items were analysed in a 2x2x2 ANOVA with the factors Display (M1, M2), Side (Same, Different), and Elevation (Same, Different). There was a main effect of Display (F(1,13) = 14.79, p < .005, ηp2 = .53), confirming that K
-values for M2 items were higher than the corresponding K-values for M items (as shown in Table 1). There were no significant main effects of Side or Elevation, and no significant interactions between any of the three factors (all F(1,13) < 1.69, all p > .21),
CDA components
25
trials, and on different side – same elevation trials, together with the corresponding CDA difference waveforms obtained by subtracting ipsilateral from contralateral ERPs. As expected, CDA components emerged contralateral to the task-relevant item pair in M1 displays, resulting in a main effect of Laterality on ERP mean amplitudes during the 300-700 ms interval after M1 display onset (F(1,13) = 30.07, p < .001, ηp2 = .70) Because the
subsequent location of the task-relevant M2 items was unpredictable, these CDA components did not differ across the three types of trials shown in Figure 5. Critically, CDA components elicited in response to M2 displays differed between these trial conditions. As can be seen in Figure 5, there was a CDA polarity reversal on different side – same elevation trials, confirming the observations of Experiment 1. On same-side trials, CDA components measured in the interval following M2 displays were larger than CDAs in response to M1 displays, and this was the case not only for trials where the task-relevant M1 and M2 items were presented at adjacent locations in the same quadrant, but also when they appeared in different quadrants of the same hemifield.
--- Insert Figure 5 about here ---
To statistically confirm the presence of a CDA polarity reversal in response to M2 displays on different side – same elevation trials but not on same side - same elevation trials, we conducted a repeated-measures ANOVA of ERP mean amplitudes in the 300-700 ms interval after M2 display onset with the factors Location Condition (same side – same elevation, different side – same elevation) and Laterality. As predicted, there was a significant interaction between Laterality and Location Condition (F(1,13) = 27.08, p < .001, ηp2 = .68).
Follow-up analyses confirmed that there was a reliable CDA in response to M2 displays on same side – same elevation trials (M diff = -1.83 μV; t(13) = 5.43, p < .001) On different side – same elevation trials, a CDA was also reliably present (M diff = 1.02 μV, t(13) = 4.23, p = .001), albeit with the reverse polarity than the CDA observed in response to M1 displays.1
1 An analogous CDA polarity reversal was also observed on different side – different
26
Because Experiment 2B only included the ‘2 to 2’ load condition where participants had to encode two items from each memory display, CDA components to M1 and M2 displays were directly compared to determine whether the addition of two additional memory items led to an increase of CDA amplitudes on same-side trials but not on different side-trials, as in Experiment 1. CDA mean amplitudes in response to M1 displays were averaged across the three trial conditions shown in Figure 5, and contrasted with CDA mean amplitudes on same-side and different-side trials (see also Table 1, right columns). As in Experiment 1, CDA components on same-side trials increased in size in the interval following M2 displays relative to the post-M1 interval (M diff = -1.35 versus -2.10 μV; t(13) = 4.23, p = .001). While Figure 5 (bottom panel) suggests that this CDA amplitude increase might even be larger for same side – different elevation trials than for same side – same elevation trials, the CDA amplitude difference between these two types of trials did not reach significance (t(13) = 1.89, p = .08). In contrast to same-side trials, there was no systematic difference in the size of CDA components to M1 and M2 displays on different side – same elevation trials after inverting M2 difference amplitudes to control for the CDA polarity reversal (M diff = -1.35 versus -1.02 μV; t(13) = 1.60, p > .10).
Discussion of Experiment 2
27
attentional activation processes during the most recent selection episode. As the attentional selection of M2 items on the vertical midline was likely to have required a new attentional focus, no lateralised activity should have been present at all during the second delay period, which was clearly not the case.
Further evidence for this conclusion was found in Experiment 2B. In line with Experiment 1, CDA amplitudes were larger during the second as compared to the first delay period on same side – same elevation trials. Importantly, the same CDA amplitude increase in response to M2 memory displays was also observed on same side – different elevation trials where M1 and M2 displays appeared in opposite quadrants of the same hemifield (see Figure 5). If an increased CDA during the second delay period on same-side trials exclusively reflected the encoding of additional items within an already established focus of spatial attention, no such increase should have been present on same side – different elevation trials in Experiment 2B, because it is likely that a new attentional focus had to be activated for M2 displays when they were presented in a different quadrant. The fact that CDA amplitudes were larger during the second delay period on these trials therefore suggests that some memory traces of M1 items were actively maintained even after the encoding of M2 items at a different location.
The CDA results for different-side trials in Experiment 2B confirmed the observations for the ‘2 to 2’ different-side trials in Experiment 1. Again, the CDA switched polarity between the first and second two delay period. According to the storage account, the size and polarity of the CDA measured in the second delay period on different-side trials should reflect the difference between the number of M1 and M2 items that are successfully stored. As in Experiment 1, participants retained more items from M2 than M1 displays. However, this difference was again relatively small (e.g., 0.76 versus 1.23 items on different side – same elevation trials; see Table 1). If the CDA exclusively reflected storage, a very small reverse-polarity CDA should have been elicited during the second delay period on different side – same elevation trials. In fact, this CDA was substantial, and its absolute size did not differ from the CDA measured in the first delay period (see Figure 5), which is not in line with the predictions of the storage account.
28
During the maintenance of laterally presented sensory stimuli in working memory, CDA components are elicited over contralateral posterior brain areas, and these components are generally assumed to reflect the maintenance of all items that are currently stored in working memory. The goal of the current study was to contrast this storage account of the CDA with an alternative attentional account which assumes that the CDA reflects a focus of spatial attention on items that were encoded during the most recent selection episode. The results obtained in Experiments 1 and 2 have provided evidence for both accounts. The most compelling support for the attentional engagement hypothesis was found on trials where two memory displays (M1 and M2) were sequentially presented on different sides. In Experiment 1, CDA components were initially elicited contralateral to the task-relevant items in the M1 displays, and increased in size with the number of items that had to be encoded. Critically, following M2 displays on the opposite side, the CDA switched polarity, and now emerged over the hemisphere contralateral to the task-relevant items in M2. The amplitudes of these reversed CDA components reflected the number of items that were encoded from the M2 display, and did not differ from the CDAs triggered in response to M1 displays that contained the same number of task-relevant items. These observations, which were confirmed in Experiment 2B, are problematic for the hypothesis that the CDA exclusively reflects the total number of items that are currently retained in working memory. This hypothesis predicts that the CDA elicited during the second delay period on different-side trials will reflect the difference in the number of items from M1 and M2 displays that were successfully stored. Even though participants generally retained slightly more M2 items across experiments (see Table 1), the size of this recency effect was small, and therefore cannot fully account for the pattern of reverse-polarity CDA components on opposite-side trials.
29
primarily reflect the storage of tactile events in working memory, but the attentional focus on the most recently encoded items (see Katus & Eimer, 2015, for further discussion).
In contrast to the observations for different-side trials, the CDA results obtained on same-side trials were not fully in line with the predictions of the attentional activation account, and suggest that memory traces originating from an earlier encoding episode also contribute to the CDA. In Experiment 1, CDA amplitudes elicited on same-side trials to memory displays with one or two task-relevant items were larger during the second delay period, even though the same number of items had to be encoded from these M1 and M2 displays (confirming previous observations by Vogel et al., 2005, and Ikkai et al., 2010). This suggests that the active retention of M1 items affected CDA amplitudes measured during the second delay period. In Experiment 2B, the same CDA amplitude increase following M2 presentation was found on same side – same elevation trials, and, importantly, also on same side – different elevation trials where M1 and M2 displays appeared in different quadrants. This latter finding rules out an interpretation of this amplitude increase in terms of the encoding of new items within a previously established focus of attention at a particular location of the visual field. It suggests that the CDA remains sensitive to stored memory traces from an earlier encoding episode even after attention has been allocated to a new memory display in a different quadrant within the same hemifield. More direct evidence for a residual persistence of M1 memory traces was found in Experiment 2A, where M2 displays appeared on the vertical meridian. Here, reliable CDA components remained present (albeit in an attenuated fashion) during the interval after M2 was presented. Because memory items on the vertical midline will not elicit lateralised CDA activity during their retention, the residual CDA observed in the second delay period in Experiment 2A is likely to reflect a residual trace of the M1 items that were maintained during this period. However, the fact that the residual CDA components measured during this second delay period in Experiment 2A were not modulated by M1 load indicates that the CDA was no longer sensitive to the number of successfully stored lateral memory items.
30
a single test display was presented on each trial, always at fixation. It might be argued that presenting only a single test display increased the need to integrate the items from the two memory displays relative to studies where test displays appeared sequentially (e.g., Ikkai et al., 2010). For example, it is possible that the encoding and retention of M1 and M2 memory items on different-side trials may have required not only shifts of spatial attention, but perhaps also a mental shift of the represented location of M1 items towards the opposite side. In addition, the fact that test display items always appeared at fixation may have led participants to mentally shift memorized items towards the centre, in preparation for the memory matching process. Such preparatory mental shifts may have affected performance, and could also have systematically altered CDA components, in particular during the second delay period. However, previous behavioural and ERP studies have shown that task performance and CDA components in change detection tasks remain remarkably unaffected by spatial transformations between memory and test displays. Woodman, Vogel, and Luck (2012) compared blocks where memory and test displays were presented on the same side and blocks where they appeared on opposite sides, and found that task performance was essentially unaffected by horizontal translations between memory and test displays. This was also the case when the relative position of individual objects was changed between memory and test displays, and when test objects appeared on the opposite side and in different positions relative to memory arrays. In a recent CDA study from our lab (Grubert & Eimer, 2015), bilateral memory displays were followed after a delay period by bilateral test displays. In different blocks, participants had to compare memory and test items on the same side or on opposite sides. CDA components of similar size were elicited contralateral to the task-relevant memory items in both types of blocks. Importantly, there was no CDA polarity reversal in blocks where these displays had to be matched to test displays on the other side, indicating that participants did not shift memorized object locations towards the side of the upcoming comparison stimuli. These previous studies demonstrate that memory matching processes operate effectively across horizontal translations between memory and test displays, and do not depend on preparatory mental shifts of the represented locations of working memory items.
31
focus of spatial attention that was established during the encoding of M2 displays, in spite of the fact that M1 items were successfully retained during this period. The critical question for the alternative storage account is whether memory traces from previous encoding episodes can still be detected with CDA measures after additional new items have been loaded into working memory. The increase of CDA amplitudes during the second delay period on same-side trials and the presence of small but reliable CDA components after the presentation of a second memory display on the vertical midline (Experiment 2A) suggest that this is the case. Although the CDA appears to primarily reflect the current focus of spatial attention within working memory, the residual activation of stored representations outside this attentional focus can still have a small but reliable impact on CDA amplitudes.
32
primarily stored in a different format by mechanisms that do not give rise to CDA components. For example, items might be retained in the absence of focal attention via temporary changes of synaptic weights between neurons that represent these items (e.g., Mongillo, Barak, & Tsodyks, 2008). Because such changes are not associated with changes in neural activation levels, they would not be picked up by activation-based EEG or fMRI correlates of working memory maintenance (see also Lewis-Peacock et al., 2012, for similar suggestions). If the maintenance of items from earlier encoding episodes in sequential loading tasks was mainly based on such synaptic changes, this could explain why CDA components were primarily driven by the most recently encoded items, and therefore cannot be regarded as an exhaustive measure of short-term memory retention processes, in contrast to the assumptions of a pure storage account.
It should be noted that the two assumptions that are combined in the attentional activation account – the hypothesis that working memory representations can differ in their activation, and the assumption that these differences reflect differences in the degree to which focal attention is allocated to these representations – are logically independent. Even though direct links between attention and activation states in working memory are postulated in current models (e.g., Oberauer, 2013), it remains possible that mechanisms other than focal spatial attention can contribute to the regulation of activity levels in working memory. However, even if the links between spatial attention and the activation of representations in visual working memory are less direct than is assumed here, the fact that the CDA primarily reflects the most recently encoded (and thus presumably most strongly activated) items is not in line with the assumptions of a pure storage account of the CDA.
If the CDA primarily reflects the attention-dependent activation of a subset of working memory representations rather than generic memory storage as such, this may have implications for the interpretation of results from studies that used this component to investigate working memory capacity in individuals with, for instance, trait anxiety (e.g., Qi et al., 2014), schizophrenia (e.g., Leonard et al., 2013), or during cognitive development (e.g,, Sander, Werkle-Bergner, & Lindenberger, 2011; Spronk, Vogel, & Jonkman, 2012, 2013). A reduction of CDA amplitudes for particular groups does not necessarily imply that storage functions of working memory are generally impaired, but may be linked to a more specific deficit in the allocation of focal attention to particular working memory representations during the encoding and retention of task-relevant visual input.
33
This work was supported by grant ES/L016400/1 from the Economic and Social Research Council (ESRC), UK.
REFERENCES
Awh, E., & Jonides, J. (2001). Overlapping mechanisms of attention and spatial working memory. Trends in Cognitive Sciences, 5, 119-126.
Awh, E., Vogel, E.H., & Oh, S.-H. (2006). Interactions between attention and working memory. Neuroscience, 139, 201-208.
Chun, M.M., Golomb, J.D., & Turk-Browne, N.B. (2011). A taxonomy of external and internal attention. Annual Review of Psychology, 62, 73-101.
Cowan, N. (1995). Attention and memory: An integrated framework. New York, NY: Oxford University Press.
Cowan, N. (2001). The magical number 4 in short-term memory: A reconsideration of mental storage capacity. Behavioral and Brain Sciences, 24, 87-114.
D’Esposito, M. (2007). From cognitive to neural models of working memory. Philosophical Transactions of the Royal Society of London. Series B, Biological Sciences, 362, 761-772.
Drew, T., Horowitz, T.S., Wolfe, J.M., & Vogel, E.K. (2011). Delineating the neural
signatures of tracking spatial position and working memory during attentive tracking.
Journal of Neuroscience, 31, 659-668.
Drew, T., & Vogel, E.K. (2008). Neural measures of individual differences in selecting and tracking multiple moving objects. Journal of Neuroscience, 28, 4183-4191.
Druzgal, T.J., & D’Esposito, M. (2003). Dissecting contributions of prefrontal cortex and fusiform face area to face working memory. Journal of Cognitive Neuroscience, 15, 771-784.
Emrich, S.M., Riggall, A.C., LaRocque, J.J., & Postle, B.R. (2013). Distributed patterns of activity in sensory cortex reflect the precision of multiple items maintained in visual short-term memory. Journal of Neuroscience, 33, 6516-6523.
Fuster, J.M., & Alexander, G.E. (1971). Neuron activity related to short-term memory.
Science, 173, 652-654.
Goldman-Rakic, P.S. (1990). Cellular and circuit basis of working memory in prefrontal cortex of nonhuman primates. Progress in Brain Research, 85, 325-335.