3604
APPLICATION OF CLONAL SELECTION IMMUNE SYSTEM
METHOD FOR OPTIMIZATION OF DISTRIBUTION
NETWORK
1RAMADONI SYAHPUTRA, 2SLAMET SURIPTO, 3SOEDIBYO, 4INDAH SOESANTI
1,2Department of Electrical Engineering, Faculty of Engineering,
Universitas Muhammadiyah Yogyakarta Jl. Ringroad Barat Tamantirto, Kasihan, Yogyakarta
INDONESIA 55183
3Department of Electrical Engineering, Faculty of Electrical Technology,
Institut Teknologi Sepuluh Nopember Kampus ITS Keputih, Sukolilo, Surabaya
INDONESIA 60111
4Department of Electrical Engineering and Information Technology, Faculty of Engineering,
Universitas Gadjah Mada
Jl. Grafika 2, Kampus UGM, Yogyakarta INDONESIA 55281
e-mail: [email protected]; [email protected]; [email protected]
ABSTRACT
This paper proposes an application of clonal selection immune system method for optimization of distribution network. The distribution network with high-performance is a network that has a low power loss, better voltage profile, and loading balance among feeders. The task for improving the performance of the distribution network is optimization of network configuration. The optimization has become a necessary study with the presence of DG in entire networks. In this work, optimization of network configuration is based on an AIS algorithm. The methodology has been tested in a model of 33 bus IEEE radial distribution networks with and without DG integration. The results have been showed that the optimal configuration of the distribution network is able to reduce power loss and to improve the voltage profile of the distribution network significantly.
Keywords: Artificial Intelligence; Artificial Immune System; Distribution Network; Distributed Generator.
1. INTRODUCTION
The effort to reduce the active power losses of distribution system has become an important issue in the last decade [1]–[3]. For all of the components of the electric power system, the distribution system is a component that has the greatest power losses [4]-[8]. For example, based on an energy audit by 2008, the total energy loss of electric utility in Indonesia was 16.84% [9]. By the total loss of the electrical energy, distribution system losses have recorded the biggest loss that is 14.47%, while the loss of the transmission system is only 2.37%. Therefore, in this study are discussed the efforts to
reduce the power losses of electrical energy in the distribution system. The motivation of this research is the existence of high power losses in the distribution network, as described above.
3605 from time to time [15]-[17]. While minimizing losses by increasing the voltage level requires a high cost because all equipment is connected with this system must be able to work on a new voltage, while the result is not necessarily satisfactory [18]-[21]. Therefore, in this study focused on how the reconfiguration of power distribution network with the integration of distributed energy resources to obtain the optimal configuration of power distribution network.
In order to obtain an optimal network configuration, the previous researchers have used several methods that are classified as conventional reconfiguration methods and reconfiguration method based on artificial intelligence [22]-[28]. Conventional reconfiguration method is a method that uses a heuristic approach and classic optimization techniques [3], while the artificial intelligence based methods are simulated annealing, tabu search, artificial neural network, plant growth simulation algorithm, genetic algorithms, ant colony optimization algorithm, harmony search algorithm, particle swarm optimization algorithm, an algorithm based on fuzzy logic multi-objective, and artificial immune system algorithm [29]-[35]. The objective of this research is to optimize the configuration of distribution network using clonal selection of artificial immune system algorithm. The algorithm of artificial immune system (AIS) is a new computational algorithms inspired from the vertebrate immune system. The algorithm is able to provide the optimal solution at the end of optimization and suboptimal solutions are awake during the optimization process [3]. Methods of algorithm-based artificial immune system has the advantage of achieving the convergence of relatively rapid and computational load is low, so in this study used the clonal selection type of artificial immune system algorithm for multi-objective optimization. This study deals only with reducing network losses using configuration optimization methods. The objective functions considered are power losses and voltage profiles.
2. CLONAL SELECTION IMMUNE SYSTEM METHOD
2.1 Theory of Clonal Selection Immune System
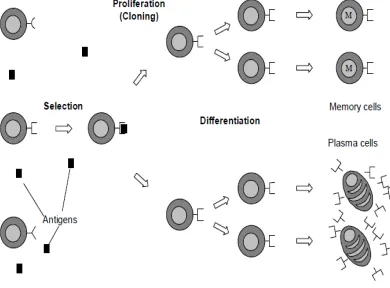
Artificial immune system theory is used to explain the basic response of the immune system by being adaptive to antigen stimulation, as described in Figure 1. This theory states that the only cells able to recognize antigens that will proliferate, while other cells are ignored. Clonal selection
operates on B cells and T cells in cell B, when the antibody binds to the antigen then activated and differentiated into plasma cells or memory cells. Prior to this process, B cell clones are produced and undergo somatic hyper-mutation. The result obtained diversity in the population of B cells to plasma cells produce antibodies antigen-specific works against antigens. Memory cells remain with host antigens and promote secondary response quickly.
The main features of the clonal selection of artificial immune system theory are:
a. new cells are duplicates of those parents
(clone) which is charged with the rapid mutation mechanism height (somatic hyper-mutation),
b. elimination of the new different lymphocyte
making it the self-reactive receptors,
c. proliferation and differentiation takes place through contact adult cells with antigen, and d. the persistence of illegal clones, resistant to
[image:2.612.321.516.398.542.2]early elimination by self-antigen, as the basis of the auto-immune disease.
Figure 1. The General Principle Of Artificial Immune System
The analogy with natural selection fit the reality that is the strongest candidate into most cells recognizes antigens, or in other words, into cells most triggered. To workings of this algorithm, population or repertoire of receptors should be diverse enough to recognize any form of foreign cells. A mammalian immune system contains a
heterogeneous repertoire of about 1012 lymphocytes
in humans, and the rest of B cells (stimulated) can
display about 105-107 identical like-antibody
3606 In [11], they have proposed the clonal selection algorithm named ClonalG for learning and optimization. They discussed the main features of the theory of clonal selection and develop algorithms include the maintenance of a set of specific memory, selection and cloning antibodies are most stimulated, death antibody non-excitatory, maturation affinity and selection of re clones are balanced against affinity antigen, and the generation and maintenance of a set of antibodies.
The main steps of clonal selection of artificial immune system method are described in the following algorithm.
Input: Ab, gen, n, d, L, β;
Output: Ab, f
1. for t = 1 to gen,
1.1 f := decode (Ab); vector f
contains all affinity antibodies that bind to the antigen
1.2 Abn := select (Ab, f, n);
1.3 C := clone (Abn, β, f);
1.4 C* := hypermut (C, f);
1.5 f := decode (C*);
1.6 Abn := select (C*, f, n);
1.7 Ab := insert (Ab, Abn);
1.8 Abd := generate ( d, L );
randomly generate antibody d along L
1.9 Ab := replace (Ab, Abd, f);
end;
2. f := decode (Ab); Decode
functions are supposed to encode Ab and evaluation for values decode.
Affinity between antibody and antigen can be defined using different techniques such as matching rules and a measure of distance. One common technique used is the Euclidean distance, which is suitable when using a real-valued vector representation. To explain how ClonalG work using Euclidean distance, suppose Ag = {Ag1, Ag2, ..., AgN}, and Ab = {Ab1, Ab2, ..., AbN} show the antigen and antibody sets respectively, N is the support of the order. Then, the degree of match between Ag and Ab d can be calculated based on the Euclidean distance:
N i i iAb
Ag
d
1 2(1)
Furthermore, d compared with the threshold λ, and a matching error E is obtained using the equation:
E = d – λ (2)
If E > 0, it is considered that the two vectors do not match, so that these antigens are not recognized by the antibody. If E <= 0, concluded that Ag Ab match, then the antigen recognized by the antibody. General range for calculation of affinity is varying between 0 and 1.
For affinity maturation, ClonalG algorithm assumes that the n highest affinity antibody is sorted rise, and the number of clones that are raised for all n selected antibodies are given by:
n i i N round Nc 1
(3)with N is the total number of clones for each antigen, β are the cloned factor determining the scale factor for the number of clones for antibodies
elected and β common value is (0,1], N is the
total amount of antibodies and round() is operators who rotate argument to the nearest integer. Every part of this amount corresponds to the size of clones of each antibody chosen, for example, for N = 100 and β = 1, antibodies highest affinity (i = 1) will produce 100 clones, while the antibody affinity the second highest yield of 50 clones, and thus further [11].
2.2 Clonal Selection Immune System for Reconfiguring the Distribution Network
Artificial Immune System is a computational intelligence approach that is inspired by the vertebrate immune system and has become a popular method in solving various problems in optimization. In the artificial immune system algorithm, one important variable used is the population (x), and the mutation of the population is implemented in the following equation:
Xi+mj = Xy + N (0, β) (Xjmax – Xjmin) (f1/fmax) (4)
Stages of completion of optimization problems using artificial immune system algorithm are based on the following steps:
Step 1. Initialize population
3607 contained in the distribution network.
Step 2. Evaluate the fitness value of each population
In order to minimize the power losses, fitness of artificial immune system is considered as a total loss in the distribution system. Total losses were evaluated by solving the power flow program. This is done by calling the power flow program into the artificial immune system as the main program. Optimizations also pay attention to the constraints of the voltage in the distribution system so that the minimum voltage and the maximum are not exceeded.
Step 3. Clone
In this process, a combination of tie switches and total power losses in the distribution network is carried out the cloning.
Step 4. The process of mutation
In this process, the value of cloning is mutated by implementing mutation carriers. Mutations only on the operator variations are used to generate offspring from each parent. Fitness of the offspring is calculated by calling the power flow program.
Step 5. Selection process
The selection process is done by applying selection strategies based on priority.
Step 6. Test the convergence
The test procedure is done to determine the convergence criteria optimization termination. Convergence criteria specified by the difference between the maximum and the minimum fitness of less than 0.0001. If the convergence condition is not met, then the process will be repeated until a convergence condition is achieved.
maximumfitness – minimumfitness≤ 0,0001 (5)
3. RESULTS AND DISCUSSION
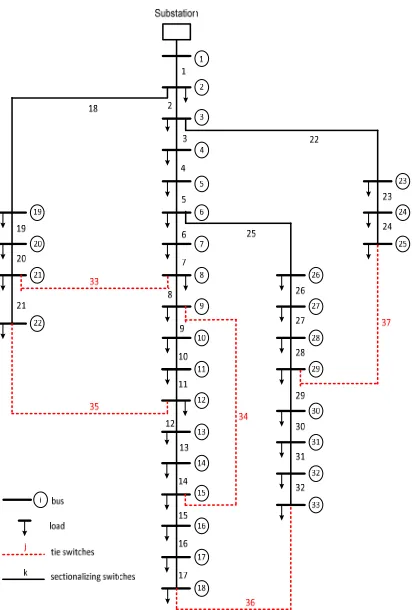
In this study, the optimization distribution network configuration of the 33 bus IEEE model distribution network using Clonal Selection Immune System algorithm is described. The procedure of optimization is implemented on the IEEE model of 33 bus, 12.66 kV radial distribution network in two conditions, i.e. both in without DG
[image:4.612.316.522.311.616.2]integration and with DG integration. The distribution network has 33 buses and 32 sections, as shown in Figure 2. The sectionalizing switches are switches that are in closed under normal conditions while the tie switches are switches that are in open under normal conditions. Data which are loaded on 33-bus IEEE distribution network can be seen in [10]. The total load of the IEEE distribution network is 3715 kW. The base of the system is V=12.66 kV and S=10 MVA. In initial configuration, the IEEE distribution system has been set at five tie switches, i.e. switches of 33, 34, 35, 36 and 37, respectively, as can be seen in Figure 2. It also can be seen in Figure 2 that the IEEE distribution network model is consist of one feeder from a substation.
3608
Table 1. DG Location And Capacity Of IEEE 33-Bus System
Name Number Bus Active Power (MW)
Power Factor
Reactive Power (MVAr)
DG1 18 1.92 0.9 0.93
DG2 22 1.75 1 0
DG3 33 1.68 0.9 0.81
Total 5.35 - 1.74
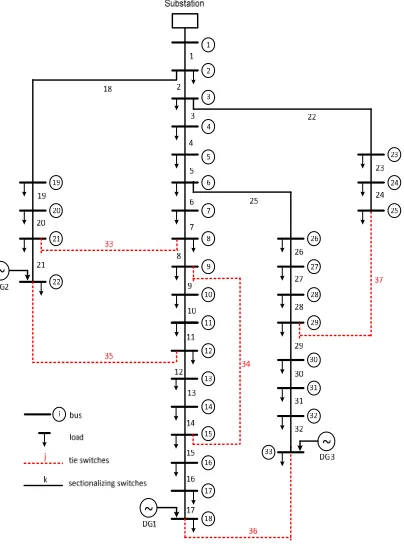
[image:5.612.311.525.184.319.2]In IEEE 33-bus distribution network, there are installed as many as three DGs on buses of 18, 22, and 33. The capacities of these three DGs are 1.92 MW, 1.75 MW, and 1.68 MW, respectively, as shown in Table 1. The installation of these DGs is intended to see the impact of DG on distribution network performances.
Figure 3. Integration Of Three Dgs On 33-Bus IEEE Distribution Network
The DG models that have used in our study consist of both wind farms and solar photovoltaics. We have assumed that power factor of all DG wind farms are 0.9 lagging while solar photovoltaics are unity. Integration of the three DGs on 33-bus IEEE
[image:5.612.97.299.354.626.2]distribution network is shown in Figure 3. Then, the optimization of configuration of the radial distribution network model with DG integration using AIS algorithm is performed. The results of the optimization are shown in Figure 4, Figure 5, Figure 6, and Figure 7.
Figure 4. Phase Of Power Loss To Iteration During Optimization Process
Figure 5. The Optimal Configuration Of 33-Bus IEEE Distribution Network With DG Integration
[image:5.612.316.520.375.663.2]3609 distribution network with integration of three DGs. The various iterations are applied to see the performance of AIS algorithm in optimization of distribution network configuration. Using the iterations, it is expected to be obtained information that the lowest number of iterations to get the best configuration and the lowest computation time. Optimization results show that there are as many as 9 power losses phases due to changes in iteration numbers, i.e. 5, 10, 30, 50, 100, 200, 300, 400 and 500, respectively, as can be seen in Figure 4. The optimal configuration is obtained on the iteration of 500, in computing time of 393.91 seconds. The positions of tie switches for this configuration are 8, 19, 27, 34 and 36, respectively.
Figure 6. Power Loss Distribution Of IEEE 33-Bus Test System
Figure 6 shows the power loss distribution of IEEE 33-bus IEEE network test system in conditions of pre-reconfiguration without DG, post-reconfiguration without DG, pre-post-reconfiguration with DG, and post-reconfiguration with DG. It can be seen that the power losses magnitude on each branches is reduced by reconfiguration procedure. For example, on the branch 2, on pre-reconfiguration without DG configuration has 50 kW power losses but after configuration optimization decreased to 24 kW. The decrease is due to the network be reconfigured after the current flowing in the conductor 2 is smaller than the pre-reconfiguration of the radial network. Overall reduction of active power loss of the radial distribution network without the integration of DG for post-reconfiguration is 36.23%, which is decreased from 202.68 kW to 129.29 kW at post-reconfiguration. The optimal configuration of the radial network is obtained by making the status of
tie switches of 33, 35, and 36 to be closed while the sectionalizing switches of 6, 10, and 32 are open.
[image:6.612.314.522.416.565.2]Integration of three DGs on the buses of 18, 22, and 33 with each capacity of 1.92 MW, 1.75 MW and 1.68 MW, respectively, has a significant impact on the reduction of power loss of IEEE 33 bus distribution network, as shown in Figure 6. For example in branch 2, on conditions of pre and post-reconfiguration of network without DG have power losses are 50 kW and 24 kW, respectively while after DG integration it has been plummeted to 12.5 kW. The decrease of power loss is due to the integration of DG on the buses 18, 22, and 33 accounted for active and reactive power in large enough so that the effect in increasing the overall magnitude of the bus voltage. Therefore, the current flowing in the conductor of distribution network is to be reduced. Total active power loss of distribution network is decreased from 202.64 kW to 43.51 kW. Furthermore, the optimal distribution network configuration further reduces power loss becomes 27.61 kW. The optimal distribution network configuration is obtained by making the status of tie switches 33, 35, and 37 be closed while the status of the sectionalizing switches 8, 19, and 27 to be open.
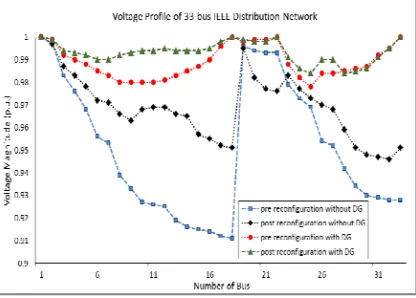
Figure 7. Voltage Profile Of IEEE 33-Bus Radial Network Test System
3610 this optimization. On buses of 20, 21, and 22, there were a slight decrease in voltage magnitude as a consequence of changes in the status of the current configuration switches. As can be seen in the results of configuration optimization in Figure 7, the buses of 20, 21, and 22 are connected to more buses, so they are resulting in a slight voltage drop. In overall, the voltage profile of post-reconfiguration condition is better than pre reconfiguration condition. The lowest voltage magnitude of pre-reconfiguration is 0.913 p.u. on bus of 18 while the lowest voltage magnitude of post-reconfiguration is 0.949 p.u. on the same bus, as shown in Figure 7.
Integration of three DGs on IEEE 33-bus distribution network model has a significant impact on bus voltage profile improvement. Figure 7 shows that the voltage magnitude for entire bus increases except bus 1 which has reached 1 p.u. The improved voltage profile can be seen from the increasing in magnitude of the lowest voltage magnitude. In condition without DG, the lowest voltage magnitude is 0.915 p.u. on bus of 18 while in condition with DG integration is 0.978 p.u. on bus 25 for the same network configuration, as shown in Figure 7. The increase is due to the integration of DG on the buses 18, 22, and 33 so the active and reactive power is large enough. Therefore, the impact increasing the overall magnitude of the bus voltage is obtained. In particular, it can be observed especially on the bus of 18. The voltage magnitude on bus of 18 is the lowest voltage in IEEE 33 bus power distribution network on the initial conditions, i.e. 0.914 p.u. Integration of DG1 with a capacity of 1.92 MW on bus 18 is adequate to increase the magnitude of the voltage to 1 p.u. Likewise with integration of DG3 with a capacity of 1.68 MW on bus 33 is adequate to raise the voltage magnitude from 0.929 to 1 p.u.
5. CONCLUSION
In this study, the clonal selection immune system algorithm was tested on an IEEE 33-bus distribution network. Based on the results, it was shown that the algorithm is effective in enhancing efficiency of the two test distribution systems. Efficiencies of the IEEE 33-bus distribution network in the pre reconfiguration without DG is 94.81%, post reconfiguration without DG is 96.61%, pre reconfiguration with DG is 98.82%, and post reconfiguration with DG is 99.23%. In order to see the performance of AIS algorithm, it has also been tested on the voltage profile for the IEEE 33-bus distribution network. The result of the
optimization is that the integration of DG in the test networks has obtained in improved voltage quality. The voltage quality is to be improved further by reconfiguring the distribution network.
ACKNOWLEDGEMENTS
The research team would like to thank profusely to the Ministry of Research, Technology and Higher Education for funding this research. Hopefully this good cooperation can be continued so as to contribute to the research development and strengthening of national innovation system.
REFRENCES:
[1] Farahani, V., B. Vahidi, and H.A. Abyaneh,
Reconfiguration and Capacitor Placement Simultaneously for Energy Loss Reduction Based on an Improved Reconfiguration Method, IEEE Trans. on Power Systems, Vol. 27, No. 22, 2012, pp. 587-595.
[2] Syahputra, R., Robandi, I., Ashari, M. (2015).
Reconfiguration of Distribution Network with DER Integration Using PSO Algorithm. TELKOMNIKA, 13(3). pp. 759-766.
[3] Syahputra, R., Soesanti, I., Ashari, M. (2016).
Performance Enhancement of Distribution Network with DG Integration Using Modified PSO Algorithm. Journal of Electrical Systems (JES), 12(1), pp. 1-19.
[4] Syahputra, R., Robandi, I., Ashari, M. (2015).
PSO Based Multi-objective Optimization for
Reconfiguration of Radial Distribution
Network. International Journal of Applied Engineering Research (IJAER), 10(6), pp. 14573-14586.
[5] Merlin, A., and H. Back, “Search for a
minimal-loss operating spanning tree
configuration in an urban power distribution system”, Proc. 5th PSCC Conference, 1975, pp.1–18, Cambridge, U.K.
[6] Syahputra, R., (2012), “Distributed Generation:
State of the Arts dalam Penyediaan Energi Listrik”, LP3M UMY, Yogyakarta, 2012.
[7] Syahputra, R. (2010). Fault Distance
Estimation of Two-Terminal Transmission Lines. Proceedings of International Seminar on Applied Technology, Science, and Arts (2nd APTECS), Surabaya, 21-22 Dec. 2010, pp. 419-423.
[8] Jamal, A., Suripto, S., Syahputra, R. (2017).
3611 of Applied Engineering Research (IJAER), 12(6), pp. 898-907.
[9] Jamal, A., Suripto, S., Syahputra, R. (2016).
Performance Evaluation of Wind Turbine with Doubly-Fed Induction Generator. International Journal of Applied Engineering Research (IJAER), 11(7), pp. 4999-5004.
[10]Syahputra, R., Robandi, I., Ashari, M. (2015).
Performance Improvement of Radial
Distribution Network with Distributed
Generation Integration Using Extended Particle Swarm Optimization Algorithm. International Review of Electrical Engineering (IREE), 10(2). pp. 293-304.
[11]Syahputra, R., Robandi, I., Ashari, M. (2014).
Optimization of Distribution Network
Configuration with Integration of Distributed Energy Resources Using Extended Fuzzy Multi-objective Method. International Review of Electrical Engineering (IREE), 9(3), pp. 629-639.
[12]Syahputra, R., Robandi, I., Ashari, M., (2013),
“Distribution Network Efficiency Improvement Based on Fuzzy Multi-objective Method”. International Seminar on Applied Technology, Science and Arts (APTECS). 2013; pp. 224-229.
[13]Jamal, A., Syahputra, R. (2013). UPFC Based
on Adaptive Neuro-Fuzzy for Power Flow Control of Multimachine Power Systems. International Journal of Engineering Science Invention (IJESI), 2(10), pp. 05-14.
[14]Syahputra, R., (2012), “Fuzzy Multi-Objective
Approach for the Improvement of Distribution Network Efficiency by Considering DG”, IJCSIT, Vol. 4, No. 2, pp. 57-68.
[15]Syahputra, R., Robandi, I., Ashari, M. (2014).
“Optimal Distribution Network
Reconfiguration with Penetration of
Distributed Energy Resources”, Proceeding of 2014 1st International Conference on Information Technology, Computer, and Electrical Engineering (ICITACEE) 2014, UNDIP Semarang, pp. 388 - 393.
[16]Syahputra, R., (2013), “A Neuro-Fuzzy
Approach For the Fault Location Estimation of Unsynchronized Two-Terminal Transmission Lines”, IJCSIT, Vol. 5, No. 1, pp. 23-37.
[17]Jamal, A., Syahputra, R. (2014). Power Flow
Control of Power Systems Using UPFC Based on Adaptive Neuro Fuzzy. IPTEK Journal of Proceedings Series. 2014; 1(1): pp. 218-223.
[18]Soedibyo, Ashari, M., Syahputra, R. (2014).
“Power loss reduction strategy of distribution
network with distributed generator
integration”, Proceeding of 2014 1st
International Conference on Information
Technology, Computer, and Electrical
Engineering (ICITACEE) 2014, UNDIP Semarang, pp. 404 - 408.
[19]Syahputra, R., Soesanti, I. (2016). DFIG
Control Scheme of Wind Power Using ANFIS Method in Electrical Power Grid System. International Journal of Applied Engineering Research (IJAER), 11(7), pp. 5256-5262.
[20]Syahputra, R., Robandi, I., Ashari, M., (2012),
“Reconfiguration of Distribution Network with DG Using Fuzzy Multi-objective Method”, International Conference on Innovation, Management and Technology Research (ICIMTR), May 21-22, 2012, Melacca, Malaysia.
[21]Syahputra, R., Soesanti, I. (2015). Power
System Stabilizer model based on Fuzzy-PSO for improving power system stability. 2015
International Conference on Advanced
Mechatronics, Intelligent Manufacture, and
Industrial Automation (ICAMIMIA),
Surabaya, 15-17 Oct. 2015 pp. 121 - 126.
[22]Soesanti, I., Syahputra, R. (2016). Batik
Production Process Optimization Using Particle Swarm Optimization Method. Journal of Theoretical and Applied Information Technology, 86(2), pp. 272-278.
[23]Syahputra, R., Soesanti, I. (2016). Design of
Automatic Electric Batik Stove for Batik Industry. Journal of Theoretical and Applied Information Technology (JATIT), 87(1), pp. 167-175.
[24]Syahputra, R. (2016). Application of
Neuro-Fuzzy Method for Prediction of Vehicle Fuel Consumption. Journal of Theoretical and Applied Information Technology (JATIT), 86(1), pp. 138-149.
[25]Jamal, A., Suripto, S., Syahputra, R. (2015).
Multi-Band Power System Stabilizer Model for Power Flow Optimization in Order to Improve Power System Stability. Journal of Theoretical and Applied Information Technology (JATIT), 80(1), pp. 116-123.
[26]Syahputra, R. (2017). Distribution Network
Optimization Based on Genetic Algorithm. Jurnal Teknologi, Journal of Electrical Technology UMY (JET-UMY), 1(1), pp. 1-9.
[27]Syahputra, R., Robandi, I., Ashari, M. (2014).
3612
[28]Syahputra, R., Robandi, I., Ashari, M., (2014),
“Distribution Network Efficiency Improvement Based on Fuzzy Multi-objective Method”. IPTEK Journal of Proceedings Series. 2014; 1(1): pp. 224-229.
[29]Syahputra, R., Soesanti, I. (2015). “Control of
Synchronous Generator in Wind Power Systems Using Neuro-Fuzzy Approach”, Proceeding of International Conference on
Vocational Education and Electrical
Engineering (ICVEE) 2015, UNESA Surabaya, pp. 187-193.
[30]Syahputra, R., Wiyagi, R.O., Sudarisman.
(2017). Performance Analysis of a Wind Turbine with Permanent Magnet Synchronous Generator. Journal of Theoretical and Applied Information Technology (JATIT), 95(9), pp. 1950-1957.
[31]Syahputra, R., Robandi, I., Ashari, M., (2011),
“Control of Doubly-Fed Induction Generator in Distributed Generation Units Using Adaptive
Neuro-Fuzzy Approach”. International
Seminar on Applied Technology, Science and Arts (APTECS). 2011; pp. 493-501.
[32]Jamal, A., Syahputra, R. (2016). Heat
Exchanger Control Based on Artificial Intelligence Approach. International Journal of Applied Engineering Research (IJAER), 11(16), pp. 9063-9069.
[33]Syahputra, R., Soesanti, I. (2016). An Optimal
Tuning of PSS Using AIS Algorithm for Damping Oscillation of Multi-machine Power System. Journal of Theoretical and Applied Information Technology (JATIT), 94(2), pp. 312-326.
[34]Syahputra, R., Soesanti, I. (2016). Power
System Stabilizer Model Using Artificial Immune System for Power System Controlling. International Journal of Applied Engineering Research (IJAER), 11(18), pp. 9269-9278.
[35]Syahputra, R., Soesanti, I. (2016). Application