ORIGINAL RESEARCH ARTICLE
EFFICIENT REVERSIBLE HIDING TECHNIQUE BASED
ON PAIRWISE PREDICTION ERROR EXPANSION
1*
Nidhi Mishra,
2Dr. Sanjeev Jaiv and
3Dr. Shashikant Tripathi
1,3
M.G.C.G.V. Chitrakoot, Satna (M.P.), 485334, India
2
Shri Mata Vaisno Devi University Katra, Jammu and Kashmir, India182320
ARTICLE INFO ABSTRACT
Being reversible, the original digital content can be completely restored after data extraction. Prediction-error expansion (PEE) is an important method in reversible watermarking. PEE can embed large payload with low distortion into digital images. PEE is advantageous use in image redundancy usually gives better performance. But, the correlations between prediction-errors are not regarded and not use in conventional PEE based methods. In PEE, the prediction-errors are expanded and modified individually for embedding the data. In this paper an efficient reversible watermarking technique has proposed. In this paper every two adjacent prediction-errors together consider as pair. And generate a sequence which consisting of prediction-error pairs. Then Pixel selection method is used for sorting in decreasing order of prediction pair. To make a sequence of prediction error pairs, we making 2D prediction-error histogram. With the help of 2D histogram an efficient embedding strategy namely pairwise prediction error expansion can be designed. Prediction error pairs was expanding and shifting in histogram bins. Expanded bin are embed data. To achieve an improved performance we use a reduced size of location map. The result of our method is better is verified through many experiments.
*Corresponding author
Copyright ©2017,Nidhi Mishra et al. This is an open access article distributed under the Creative Commons Attribution License, which permits unrestricted use, distribution, and reproduction in any medium, provided the original work is properly cited.
INTRODUCTION
Reversible watermarking techniques are used to put back whole original cover content after the extraction of data. As a basic need, the quality of digital cover image content should be low after data embedding. When embedding the data into cover images, the pixel value of cover image will be changed. Thus the image quality is disgraced. At a time of reverse when secret messages are extracted, cover image cannot become into their original state. Lasting distortion will take place. Distortion for some application is unacceptable, for example medical images. And here reversible data hiding is necessary. An aspect of reversible data hiding is the reversibility, specifically, when the digital content has been authenticated, one can eradicate the embedded data to restore the original content. This is main reason of reversible data hiding is distortion free data hiding.
In susceptible images such as military law enforcement and medical images, every bit of information is most important. Reversible data embedding method will provide the original data when the digital content is authenticated. Reversible watermarking is used to embed the useful information into a digital work such as audio, video, image. In addition, in reversible after the watermark extraction, the cover image restored as identical bit-by bit to the original cover image. A huge reversible watermarking algorithm has been proposed
already by various authors. Majority of reversible
watermarking algorithms has been for grayscale images. Reversible watermarking offering a way to situate data into cover medium for the motive of ownership finger printing,
protection, secret communication authentication, and
annotation [Wu, 2003; Wu et al., 2003]. Reversible data hiding (RDH) [Shi et al., 2004; Caldelli et al., 2010] techniques hide data or embed data in a host signal. In reversible watermarking two main issues are necessary that keep in mind:
ISSN: 2230-9926
International Journal of Development Research
Vol. 07, Issue, 10, pp.16047-16052, October,2017
Article History: Received 09th July, 2017
Received in revised form 14th August, 2017
Accepted 17th September, 2017
Published online 10th October, 2017 Key Words:
Reversible data Hiding (RDH),
Pairwise prediction-error expansion (pairwise PEE),
Authentication, pixel selection, Rhombus pattern,
2D prediction-error histogram (2D PEH),
Citation: Nidhi Mishra, Dr. Sanjeev Jaiv and Dr. Shashikant Tripathi. 2017. “Efficient Reversible Hiding Technique Based on Pairwise Prediction Error
Expansion”, International Journal of Development Research, 7, (10), 16047-16052.
the embedding capacity should be high; and distortion should be low. Both two requirements conflict with each other. Generally, a higher embedding capacity causes a higher degree of distortion.
Literature Review
Until now, various RDH algorithms have been introduced, e.g., compression based algorithms [Fridrich, 2001; Celik, 2006], difference expansion(DE) based algorithms [Tian, 2003; Alattar, 2004; Kamstra, 2005], histogram shifting (HS)based algorithms [Lee et al., 2006; Hwang, 2006], prediction-error expansion (PEE)based algorithms [Thodi, 2007; Hu, 2009; Sachnev et al., 2009; Luo et al., 2010; Li et al., 2011; Coltuc, 2011; Wu, 2012] and integer-to-integer transform based algorithms [Lee, 2007; Coltuc, 2012; Gui, 2012], few other RDH work have also been noticed [Lin, 2012; Bas, 2011]. All of these technique, PEE is largely applied nowadays because of its efficient capacity distortion trade-off. PEE was firstly proposed by Thodi and Rodriguez [Thodi, 2007]. They proposed the differences between the pixel and its prediction. Differences are expanded for embedding the data. They compare between DE and HS based methods, PEE has a better performance. So the derived
prediction-error histograms (PEH) has more rapidly
distributed. After that, Hu et al. [2009] proposed PEE with an effective smaller size location map, and thus increase the capacity. Afterwards, Sachnev et al. [2009] proposed to sorting prediction errors based on magnitude of local variance. The PEH is distributed and modification is in histogram bins. Compared with previous methods, the result show sorted prediction-errors embedding introduce low distortion for low capacitiese specially. Li et al. [2011] were proposed method where image divide two parts i.e., smooth pixel and rough pixel. Method is adaptive embed based which selects two bits in a smooth pixel and one bit in a rough one. In such a way it obtained a better execution for high capacities. Coltuc [Coltuc, 2011] proposed a novel PEE which is transformationof modifying pixel. This transformation of modification was not only applied in the current pixel but also its next three context pixels. Since it is sure the total changes on four pixels to be smaller than that of only modification of one pixel. This method performs less distortion than the other ones which based on high-performance predictors such as MED and GAP. The conventional PEE methods mainly focus on interpixel correlations. This method is not correlate within next prediction errors. If we combine two adjacent pair and each pair is worked as a unit then such type of correlations can also be make use to reduce the distortion. Yet, the one-dimensional prediction-error histogram (1DPEH) in the conventional PEE, work as a low-dimensional projection of image data. It is necessary to make a new pattern of PEE that work as a higher dimensional projection to better exploit for correlations.
In this paper we proposed a new RDH framework that called pairwise PEE. In resist to the conventional PEE methods, we propose rhombus pattern prediction scheme to predict prediction value of pixel. Difference between pixel value and prediction value is called prediction error and make sequence of error. We take every two adjacent prediction-errors and generate a sequence of unit. Unit consists of prediction-error pairs. Using a pixel selection method for sorting of prediction pair. Sorting was in decreasing order, sorting was based on magnitude of prediction pair. After that we get a two-dimensional prediction-error histogram (2D PEH).
Finally, embed data by Histogram modification such as shifting or expanding in the 2D PEH bins. Comparing both PEE, where pairwise PEE is better exploit image redundancy
than conventional PEE and achieves an improved
performance.
PROPOSED PAIRWISE PEE SCHEME
In our work the Pair wise PEE embedding procedures are having following steps.
Rhombus Pattern Used for Prediction of pixel
First of all we decompose cover image into pixels. Next we use rhombus pattern scheme [Thodi, 2007], for prediction of pixel. In this arrangement all pixels are divided into two sets: the shadow pixel set and blank pixel set shown in Fig 1.
Fig.1. Prediction pattern. Shadow pixel set can predict and expand to hide one bit of data
The shadow pixel sets are used for embedding data and other set blank pixel sets are used for computing predictors. According to this scheme we take a pixel position xij from
shadow set. Topredict pixel value of it, we take itsfour
surrounding neighboring pixel . All
pixelsincluding xij making a cell. The shadow pixel sets
embedding scheme for a single cell encoding is given follows.
The pixel xij and its predicted value are computed as
follows:
(1)
Here shadow set pixel and blank sets pixel both are independent of each other. Independence means if we change in one set then not any affect the other set.
Based on predicted value and original value xij the
prediction-error calculated by Finally, after the
prediction error sequence (e1, e2, . . . , eN ) is produced, we
propose a new method. In this new method we take prediction error sequence. This sequence divided into pairs of sequence. Each pair consist two prediction errors. Each pair called a unit. For example pair of sequence by taking ei= (e2i, e2i−1).
Using Pixel selection scheme for Sorting
pair in sorting order. The sorting order is in decreasing manner which is based on prediction accuracy. In decreasing order the pair with small magnitude that will process first. To determine that prediction is accurate or not, a common method is used. Calculate local complexity of prediction pair. Specifically, local complexity LC(ei) of a pair ei, is computed as follows
[image:3.595.102.223.143.261.2](see Fig. 2)
Fig. 2. Context of a shadow pixel pair
(2)
Local complexity is defined as the sum of absolute differences between diagonal blank pixels sets in the 4×4 sized surrounding neighborhood pixel. A small LC represents that prediction pair is situated in smooth region of image. And preferentially used for data embedding. Setting a capacity dependent integer valued parameter threshold T.The pairs who are satisfying this condition LC(ei ) ≤T. They are utilized in
data embedding, while the other pairs are skipped. For other side when extraction and restoration are proceeding, some information is required to extract original image and information. For this purpose some side information needs to be embedded into cover image or original image as well.
Losslessly Compressed Location Map
We use the side information to take as location map. Location map is every part of embedding process, when some pixels come upon the overflow or underflow problem. For example, a pixel value of the gray-scale image may be out of the range [0,
255] after data embedding. To stop this out of range value, preprocess should be done before embedding to making different these pixel values into a trusted range. Since modify the quality to each such pixel value is at most, Since the changing to each pixel value is almost 1 in our method, only those pixel value which are in border need to be changed as follows. We chang exi to 254 if it is 255 and to 1 if it is 0. At the same time, each modified pixel is marked with 1 in a location map during the time the others are marked with 0. Then the location map is losslessly compressed to reduce its size
2D PEH
After getting prediction error pair next is to made histogram. In our proposed method we use 2D histogram [24] instead of 1D histogram. Shape of histogram totally defines performance of data embedding. In normally, distribution of the prediction errors is similar as a Laplacian distribution. The shape of the distribution is decided by the mean and variance. Generally the mean is zero so essentially variances determine the shape of histogram. Two dimensional histogram of prediction error pair are Laplacian distribution.
It is dependently distributed each other. In fact, in a pair two adjacent prediction-errors are normally highly correlated. By considering every two adjacent prediction-errors together, the
sequence can be transformed into a new one
with ei= (e2i-1, e2i) (suppose for simplicity
that N is even), and the associated 2D PEH is
(3)
We illustrate firstly conventional PEE in 1D PEH. For embedding data into PEH, prediction error is expanded or shifted as
(4)
Where T is a threshold which is parameter value of capacity-dependent integer, and b ∈ {0, 1} is data bit for embedding. Here, the bins which are in region of [−T, T] are enlarged. This limit called inner region. That means bin are expanded to embed data. Those bin in region of (−∞, −T) ∪ [T, +∞] are shifted from outside to create vacancies.
The transformation of prediction error in term of mapping for the case of T=1, the mapping between ei and ei’ is
Now, we illustrate 1D PEH can also be implementing in 2D PEH.
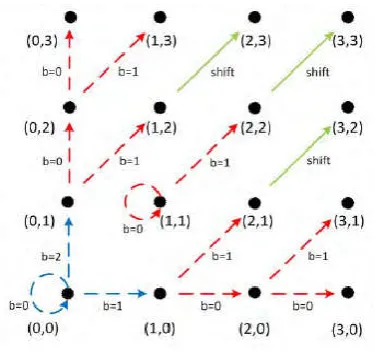
For the pair (e2i−1, e2i) = (0, 0), in the 1D mapping, e2i−1 is
expanded to 0 or 1 to embed a data bit b1∈ {0, 1}, e2iis also
expanded to 0 or 1 to embed another data bit b2∈ {0, 1}.
Accordingly, in the 2D case shown in Fig. 3, the pair (0, 0) is expanded to (0, 0), (0, 1), (1, 0) and (1, 1) when (b1, b2) is (0, 0), (0, 1), (1, 0) and (1, 1), respectively.
For (e2i−1, e2i ) = (1, 0), in 1D case, e2i−1 is shifted to 2, and
e2iis expanded to 0 or 1 to embed a data bit b ∈ {0, 1}. So, in
2D case, the pair (1, 0) is expanded to (2, 0) if b = 0, and (2, 1) if b = 1.
For (e2i−1, e2i ) = (2, 1), in 1D case, e2i−1 and e2iare shifted to 3
and 2, respectively. So, in 2D case, the pair (2, 1) is shifted to (3, 2)
Fig. 3. Transformation of prediction-error
[image:3.595.367.499.653.771.2]Pairwise PEE
We now present our pairwise PEE strategy to enhance the conventional PEE shown in Fig.3. Notice that, we do not intent to analyze every possible case of pairwise PEE, but investigate the generic case that leads to insightful results. In doing so, here we only consider the case that the maximum modification to each pixel value is restricted to 1. Our idea is straightforward. We want to expand or shift bins in a less distorted direction as much as possible. For example, for the pair (0, 0) in Fig. 3, it is embedded with2 bits (b1, b2), and the
distortion is 0, 1, 1 and 2 when (b1, b2) is (0, 0), (0, 1), (1, 0) and (1, 1), respectively. In this case, the cost for mapping (0, 0) to (1, 1) is 2, while mapping (0, 0) to (0, 0), (0, 1) or (1, 0) costs much less. So, to reduce the distortion, the directions with high distortion, e.g., mapping (0, 0) to (1, 1), should be discarded shown in fig.4Based on this consideration, we propose a new 2D mapping as shown in Fig. 4. In this new mapping, for each pairing {(0, 0), (0, −1), (−1, 0), (−1, −1)}, it is embedded withlog2 3 bits instead of 2 bits in the
conventional PEE. Moreover, since the mappings between (0, 0) and (1, 1), (0,−1) and(1,−2), (−1, 0) and (−2, 1), (−1,−1) and (−2,−2), are discarded, each pair in {(1, 1), (1,−2), (−2, 1), (−2,−2)} can be embedded with 1 bit in the new mapping while they are just shifted in the conventional PEE.
[image:4.595.69.257.352.530.2]
Fig. 4. Proposed pairwise PEE
The capacity-distortion performance is examined in proposed Pairwise PEE as follows. The proposed Pairwise PEE capacity, denoted asECpro, can be written as
(5)
Here g is used in 2D PEH and it explained in equation (3). And the other term, the distortion in as similar of l2-error, the proposed pairwise PEE distortion, formulated as EDpro, and
(6)
In our proposed method for embedding data three parameters are used. First parameter is pixel-selection threshold T, second parameter is compressed location map size and third parameter is message size. For example in embedding we take a 512 × 512 sized gray-scale image, and bit size of each parameter respectively 12 +18 + 18 = 48 bits.
For data embedding 48 bits are sufficient to encode these parameters.In our proposed method, the LSB consist three parameters. The first line of cover image is using LSB replacement, and should be pulling out first at data extraction phase.
There placed LSBs of the first-line pixels and the compressed location map both will embed into the cover image. Location map is also as a part of payload. Now, we describe the embedding and extraction procedures for the blank layer in detail. Both the shadow and blank layers pixel are embedded equally. Note that here the same as the method of Sachnev et al.[12]Each layer from shadow or blank is complete embedding process with half of secret message bits.
Embedding Procedure
Step1: To leave out first-line pixels which are better suited the pixels of boundary-valued into the reliable range, and build up the location map accordingly. Then minimum losses compress the location map.
Step2: To predict shadow pixels in the scanning order and then find out the prediction error pair series (e1, e2….., eN)
with the rhombus pattern prediction schemeas mentioned above. For each ei, compute its local complexity LC(ei) using
equation (7).
Step3: Empty LSB of few first-line pixels. To create48 bits space for embedding of the three parameters. There placed LSB with compressed location map put as a part of payload.
Step4: find smallest integer p. Thereare many pairs to embed the payloads. It includes thereplaced LSBs, the compressed location map and thesecret message bits.
Step5: With the use of LSB replacement, the values of , the compressed location map size and the message size are embeddedinto LSBs of few first-line pixels.
Step6: Process the prediction-error pairs, if satisfying LC (ei )
≤ ρ to embed the payload. After this step, the shadow layer embedding is completed.
Extraction Procedure
Step1: After reading LSBs of some first-line pixels, the values of three parameters are found out.
Step2: Use same prediction and scan order to get marked prediction-error pair sequence (e1’, e2’……eN’) for each
ei’calculate its local complexity LC(ei’) which is the same as the one used in the embedding phase.
Step3: To Processing that pairs which are satisfying LC(ei’ ) ≤ ρ. To become well again of these pairs is applied by the inverse mapping of the proposed pairwise PEE, and the embedded payload is extracted from the pairs.
Step4: After the process of embedded payload pull out, then the location map and replaced LSBs can be getting.
Step5: After returning the first-line pixels through the extracted LSBs. At last finally, the original shadow pixels are getting back.
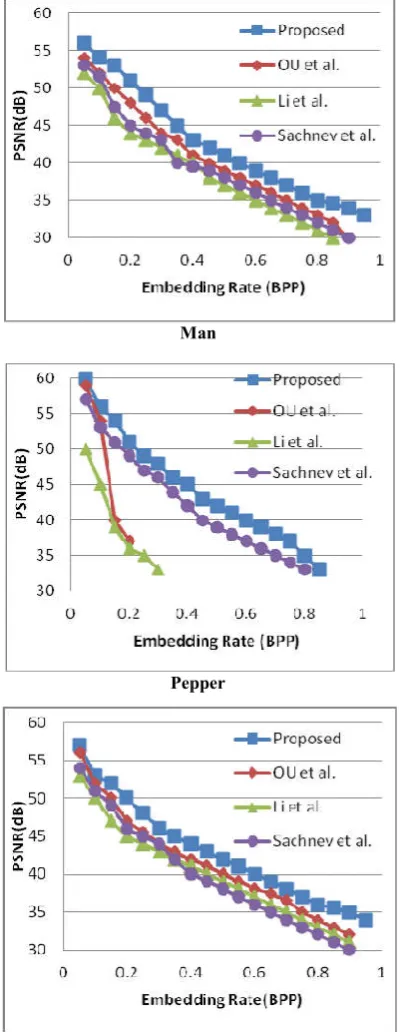
EXPERIMENTAL RESULTS
In this part, the capacity-distortion performance of the proposed method is evaluated by comparing it with some state of- the-art works including OU et al. [2011
[image:5.595.334.535.55.572.2][2011], and Li et al. [29]. The first experiment, as shown in Fig. 5, is enforced on six standard 512 × 512 sized gray images: Lena, Baboon, Barbara, Boat, Peppers and Man. Here, except Barbara, the other five images are downloaded from the USC-SIPI database1. Since the maximum modification of each pixel value is1 in the proposed method, According to Fig.5 one can see that the proposed method outperforms works. Our method can provide a larger PSNR and maximum embedding rates rather than other Among the comparison methods, Sachnev et al.’s is a hybrid PEE method using a sorting technique to preferentially process the smooth pixels.
Lena
Baboon
Barbara
Boat
distortion performance of the proposed method is evaluated by comparing it with some state 2011], Sachnev et al.
The first experiment, as shown in rced on six standard 512 × 512 sized gray-scale images: Lena, Baboon, Barbara, Boat, Peppers and Man. Here, except Barbara, the other five images are downloaded from the SIPI database1. Since the maximum modification of each osed method, According to Fig.5 one can see that the proposed method outperforms works. Our method can provide a larger PSNR and maximum embedding Among the comparison methods, ’s is a hybrid PEE method using a sorting technique to preferentially process the smooth pixels.
Man
[image:5.595.58.269.250.791.2]Pepper
Fig.5. Comparisons in terms of capacity
Although the predictor is simple, the sorting technique makes the data embedding more efficient and hence Sachnev method significantly outperforms the typical PEE method of others conventional PEE, Li et al.
prediction, and mainly focuses on the performance of very high capacity by embedding more bits into smooth pixels. Although employing a pixel selection technique, for low capacity, their method usually yields a smaller PSNR than Sachnev et al.’sOU et al.’s method gives
Sachnev. They are effective attempt for low capacity. OU et al is a 2D PEH method uses pixel selection technique and rhombus pattern predictor and improved PSNR but embedding capacity is low. Typically, compared with OU
although the same predictor and a similar sorting technique and 2D PEH are utilized, our method is
PSNR with 1.25 dB in average for maximum possible capacity with 1 bit per pixel see Tables I and II, respectively.
Man
Pepper
Fig.5. Comparisons in terms of capacity-distortion performance
Although the predictor is simple, the sorting technique makes the data embedding more efficient and hence Sachnev et al.’s method significantly outperforms the typical PEE method of
et al.’s method utilizes GAP for
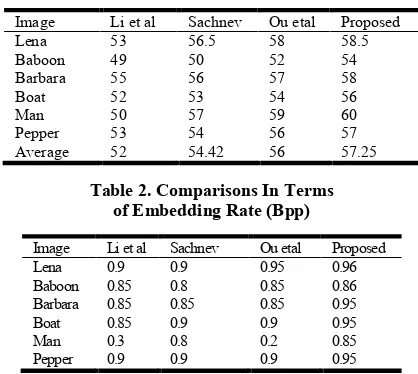
Table 1. comparisons in terms of psnr (db)
Image Li et al Sachnev Ou etal Proposed
Lena 53 56.5 58 58.5
Baboon 49 50 52 54
Barbara 55 56 57 58
Boat 52 53 54 56
Man 50 57 59 60
Pepper 53 54 56 57
[image:6.595.56.265.67.254.2]Average 52 54.42 56 57.25
Table 2. Comparisons In Terms of Embedding Rate (Bpp)
Image Li et al Sachnev Ou etal Proposed Lena 0.9 0.9 0.95 0.96 Baboon 0.85 0.8 0.85 0.86 Barbara 0.85 0.85 0.85 0.95 Boat 0.85 0.9 0.9 0.95
Man 0.3 0.8 0.2 0.85
Pepper 0.9 0.9 0.9 0.95
Table I represent PSNR value of different method for different Images. Table II represent Embedding Rate in Bit per Pixel. (BPP). The main advantage of our method is it has limitation of maximum possible capacity with near about 1 bit per pixel.
Conclusion
The proposed reversible watermarking technique is a combination of both efficient existing conventional techniques and some new techniques. This is able to perform significantly. Using a rhombus pattern prediction enables to efficiently use of hiding data. Pixel selection for sorting prediction error pair is used for low distortion in data hiding. Pairwise PEE method proposed that it can produce excellent ratio between capacity and distortion. In addition, the 2D PEE method in the proposed scheme significantly use lossless and reduce sized location map. So, capacity will be increased considerably. The Pairwise PEE is a 2D mapping method and it uses the correlations between prediction errors in a pair. The double embedding scheme stops using each pixel for data hiding in the perfect case. Such ideas in designs are supposed to less the distortion or increase the capacity to gain better RDH schemes. It is valuable to examine this issue in the future work.
REFERENCES
Alattar, A. M. 2004. “Reversible watermark using the difference expansion of a generalized integer transform,”
IEEE Trans. Image Process., vol. 13,no. 8, pp. 1147–
1156, Aug.
Bas, P., Filler, T., and Pevny, T. 2011. “Break our steganographic system—Theins and outs of organizing BOSS,” in Proc. 13th Int. Workshop Inf. Hiding, vol. 6958, pp. 59–70.
Bo Ou, Xiaolong Li, and Yao Zhao, 2013. “Pairwise Prediction-Error Expansion for Efficient Reversible Data Hiding,” IEEE Trans. on image processing, vol. 22, no. 12, Dec.
Caldelli, R., Filippini, F. and Becarelli, R. 2010. “Reversible water marking techniques: An overview and a classification,” EURASIP J. Inf. Security, vol. 2010, Jan. Celik, M. U., Sharma, G. and Tekalp, A. M. 2006. “Lossless
watermarking for image authentication: A new framework and an implementation,” IEEE Trans. Image Process., vol. 15, no. 4, pp. 1042–1049, Apr.
Coltuc, D. 2011. “Improved embedding for prediction-based reversible watermarking,” IEEE Trans. Inf. Forensics
Security, vol. 6, no. 3, pp. 873–882, Sep.
Coltuc, D. 2012. “Low distortion transform for reversible watermarking,” IEEE Trans. Image Process., vol. 21, no. 1, pp. 412–417, Jan.
Fridrich, J., Goljan, M. and Du, R.2001. “Invertible authentication,” Proc. SPIE, vol. 4314, pp. 197–208, Aug. Gui, X., Li, X. and Yang, B. 2012. “A novel integer transform
for efficient reversible watermarking,” in Proc. ICPR, pp. 947–950.
Hu, Y., Lee, H. K. and Li, J. 2009. “DE-based reversible data
hiding with improved overflow location map,” IEEE
Trans. Circuits Syst. Video Technol., vol. 19, no. 2, pp.
250–260, Feb.
Hwang, J., Kim, J. and Choi, J. 2006. “A reversible watermarking based on histogram shifting,” in Proc. 5th
IWDW, pp. 348–361.
Kamstra, L. and Heijmans, H. J. A. M. 2005. “Reversible data embedding into images using wavelet techniques and sorting,” IEEE Trans. Image Process., vol. 14, no. 12, pp. 2082–2090, Dec. 2005.
Lee, C. D. Yoo, and T. Kalker, “Reversible image
watermarking based on integer-to-integer wavelet
transform,” IEEE Trans. Inf. Forensics Security, vol. 2, no. 3, pp. 321–330, Sep. 2007.
Lee, S. K., Suh, Y. H. and Ho, Y. S. 2006. “Reversible image authentication based on watermarking,” in Proc. IEEE ICME, pp. 1321–1324, Jul.
Li, X., Yang, B. and Zeng, T. 2011. “Efficient reversible
watermarking based on adaptive prediction-error
expansion and pixel selection,”IEEE Trans. Image
Process., vol. 20, no. 12, pp. 3524–3533,Dec.
Lin, S.J. and Chung, W.H. 2012. “The scalar scheme for reversible information-embedding in gray-scale signals Capacity evaluation and code constructions,” IEEE Trans.
Inf. Forens. Security, vol. 7, no. 4, pp. 1155–1167, Aug.
Luo, L., Chen, Z., Chen, M., Zeng, X. and Xiong, Z. 2010. “Reversible image watermarking using interpolation technique,” IEEE Trans. Inf. Forensics Security, vol. 5, no. 1, pp. 187–193, Mar.
Sachnev, V., Kim, H. J., Nam, J., Suresh, S. and Shi, Y. Q. 2009. “Reversible watermarking algorithm using sorting
and prediction,” IEEE Trans. Circuits Syst. Video
Technol., vol. 19, no. 7, pp. 989–999,Jul.
Shi, Y. Q., Ni, Z., Zou, D., Liang, C. and Xuan, G. 2004. “Lossless data hiding: Fundamentals, algorithms and applications,” in Proc. IEEE ISCAS, vol. 2. May 2004, pp. 33–36.
Thodi, D. M. and Rodriguez, J. J. 2007. “Expansion
embedding techniques for reversible watermarking,” IEEE
Trans. Image Process., vol. 16, no. 3,pp. 721–730, Mar.
Tian, J. 2003. “Reversible data embedding using a difference expansion,” IEEE Trans. Circuits Syst. Video Technol., vol. 13, no. 8, pp. 890–896, Aug.
Wu, H. Yu, and B. Liu, “Data hiding in image and video .II. Designs and applications,” IEEE Trans. Image Process., vol. 12, no. 6, pp. 696–705, Jun. 2003.
Wu, H.T. and Huang, J. 2012. “Reversible image watermarking on prediction errors by efficient histogram modification,” Signal Process., vol. 92,no. 12, pp. 3000– 3009, Dec.
Wu, M. and Liu, B. 2003. “Data hiding in image and video .I. fundamental issues and solutions,” IEEE Trans. Image
Process., vol. 12, no. 6, pp. 685–695, Jun.