S H O R T R E P O R T
Open Access
Comparative analysis of sequencing
technologies for single-cell transcriptomics
Kedar Nath Natarajan
1,3*†, Zhichao Miao
1,2†, Miaomiao Jiang
4,5†, Xiaoyun Huang
4, Hongpo Zhou
4, Jiarui Xie
4,
Chunqing Wang
4, Shishang Qin
4, Zhikun Zhao
4, Liang Wu
4, Naibo Yang
4, Bo Li
4, Yong Hou
4,6, Shiping Liu
4,6,7*and
Sarah A. Teichmann
1,2,8*Abstract
Single-cell RNA-seq technologies require library preparation prior to sequencing. Here, we present the first report to compare the cheaper BGISEQ-500 platform to the Illumina HiSeq platform for scRNA-seq. We generate a resource of 468 single cells and 1297 matched single cDNA samples, performing SMARTer and Smart-seq2 protocols on two cell lines with RNA spike-ins. We sequence these libraries on both platforms using single- and paired-end reads. The platforms have comparable sensitivity and accuracy in terms of quantification of gene expression, and low technical variability. Our study provides a standardized scRNA-seq resource to benchmark new scRNA-seq library preparation protocols and sequencing platforms.
Keywords:Single-cell RNA sequencing, Sequencing platforms, Benchmarking scRNA-seq, Illumina sequencing, BGISEQ-500
Background
Single-cell RNA-seq (scRNA-seq) has become the estab-lished approach to dissect cellular heterogeneity, unravel cell states, and identify subpopulation structures across different cell types [1–4]. The different scRNA-seq methods and technologies have been benchmarked using synthetic RNA spike-ins [5–7]. However, to date, most scRNA-seq methods require cDNA libraries to be com-patible with short-read Illumina sequencing platform.
The most widely used Illumina platform uses a step-wise sequencing by polymerase approach. The libraries are made by fragmentation of bulk or single-cell cDNA, followed by the addition of custom adaptors. The tem-plate is flooded across a patterned flow cell to bind with immobilized primers and washed to remove unbound ends. The bound but free template ends further interact with nearby primers, forming bridge structures. The sec-ond strand is synthesized by PCR using the same
primers, followed by washing and re-formation of brid-ges. This bridge amplification typically generates more than a million copies of each template within the tight physical cluster on the flow cell (reviewed in [8]). A sim-plified schematic is shown in Additional file 1: Figure S1A. The actual sequencing process itself is termed “ se-quencing by synthesis.” Here, a mixture of primers, DNA polymerase, and modified nucleotides are added to enriched template on flow cell. During each cycle, frag-ments within each cluster incorporate a complementary single modified nucleotide with a base-specific, cleavable fluorophore, while unbound fragments are washed away. The flow cell is imaged using total internal reflection fluorescence (TIRF) microscopy to identify incorporated based, followed by cleavage of modified base. This cycle of nucleotide addition, elongation, and cleavage is re-peatedly performed to ascertain the DNA sequence.
The BGISEQ-500 is an alternative short-read sequencing platform, developed by BGI (Beijing Genomics Institute). The BGISEQ-500 works use combinatorial probe-anchor synthesis (cPAS) that combines DNA-Nanoball (DNBs) ar-rays with stepwise sequencing using DNA polymerase on a flow cell [8] (Additional file 1: Figure S1A). The three key steps in the BGISEQ-500 platform are generation of DNBs, loading DNBs onto a flow cell, and the sequencing of DNA
© The Author(s). 2019Open AccessThis article is distributed under the terms of the Creative Commons Attribution 4.0 International License (http://creativecommons.org/licenses/by/4.0/), which permits unrestricted use, distribution, and reproduction in any medium, provided you give appropriate credit to the original author(s) and the source, provide a link to the Creative Commons license, and indicate if changes were made. The Creative Commons Public Domain Dedication waiver (http://creativecommons.org/publicdomain/zero/1.0/) applies to the data made available in this article, unless otherwise stated.
* Correspondence:[email protected];[email protected];
Kedar Nath Natarajan, Zhichao Miao, and Miaomiao Jiang are equal contributors.
1Wellcome Sanger Institute, Wellcome Genome Campus, Hinxton, Cambridge
CB10 1SA, UK
4BGI-Shenzhen, Shenzhen 518083, China
fragments. In cPAS-based sequencing, the template cDNA is first fragmented and size selected (200–500 bp). The tem-plate undergoes four sequential rounds of adaptor ligation, circularization, and cleavage, generating a final circularized template with four unique adaptors. The circular templates undergo rolling circle amplification (RCA) to produce a large mass of DNA concatemers (DNBs) and are finally immobilized and sequenced on a flow cell using combina-torial probe-anchor synthesis (cPAS). Across the flow cell, the DNBs bind to an anchor and fluorescent probe (com-plementary to adaptors). The probes are degenerate (apart from the first position) and capture the first base at either end of the anchor. Each sequencing cycle consists of re-moving the previous probe, re-ligating to the same anchor with different fluorescent probes, and sequence determin-ation. This cycle is repeated for each of the remaining three adapter sequences to generate paired-end reads (reviewed in [8]). The BGISEQ-500 platform has been previously ap-plied to detection of small noncoding RNAs [9], human genome re-sequencing [10], and palaeogenomic ancient DNA sequencing [11], but not to scRNA-seq.
One of the key differences between the BGISEQ-500 and Illumina platforms is the sequencing cost, calculated from yield per run. These sequencing costs are typically subject to geographical, institutional pricing and con-tinue to decline. Typically, the cost per gigabase (Gb) on BGISEQ-500 is 40–60% of Illumina HiSeq4000 platform, without accounting for physical sequencer cost (Add-itional file 3: Table S1). The combination of higher throughput (~ 2×) with marginally increased cost (10– 15%) per lane makes the BGISEQ-500 an attractive alter-native. This is important in scRNA-seq, where signifi-cant multiplexing is required alongside considerable read depth per cell.
Here, we assess the suitability of BGISEQ-500 sequen-cing platform for scRNA-seq and compare with the Illu-mina HiSeq platform using matched single-cell data.
We perform two different scRNA-seq methods (SMARTer and Smart-seq2) on mouse embryonic stem cells (mESCs) and human K562 cells [12, 13]. We chose mESCs and K562 cells as two widely used mouse and human cell lines, which have been profiled in large-scale consortia (e.g., ENCODE) and in studies benchmarking single-cell protocols [5, 6, 14]. For comparison, we utilize RNA-spike-ins including Exter-nal RNA Controls Consortium (ERCCs) and Spike-in RNA Variants (SIRVs). The ERCCs and SIRVs span 92 synthetic RNA species and 69 artificial transcripts, re-spectively, of varying lengths, concentrations, GC contents, isoforms, and abundance levels. We bench-mark and compare two performance metrics ( sensitiv-ity and accuracy) on single cells using two different protocols and across Illumina and BGISEQ-500 se-quencing platform.
We have previously applied these performance metrics to compare different scRNA-seq protocols [5]. As in our previous framework, the“sensitivity”or molecular detec-tion limit is defined as the minimum number of RNA spike-in molecules detected within a single cell. The“ ac-curacy” refers to the correlation between the estimated abundances of input RNA spike-ins and the known in-put molecules added to single-cell reaction (ground truth) (Additional file1: Figure S1B–C). Specifically, the single-cell sensitivity is computed using a logistic regres-sion model with spike-in RNA detection as a dependent variable across platforms. The sensitivity is measured as the input spike-in abundance level, where the detection probability reaches 50% (Additional file 1: Figure S1B). This approach minimizes biases due to batch effects (uneven sizes, sampling, and variable spike-in detection). The accuracy is calculated using the Pearson product-moment correlation coefficient (R) between es-timated spike-in expression from sequencing and the a priori known input spike-in concentration (ground truth) in log space, for each individual cell (Add-itional file 1: Figure S1C, Additional file2: Supplemen-tary methods).
In this study, we perform the first systematic scRNA-seq comparison across two sequencing plat-forms, using 1297 matched cDNA samples from 468 unique single cells using two scRNA-seq protocols. We compare and assess the accuracy, sensitivity, and robust-ness of BGISEQ-500 library preparation and sequencing platform with the current state-of-art Illumina HiSeq platform. Our large dataset contains single- and paired-end reads (50 and 100 bp) for batch-matched mESCs and K562s, which is a large data resource for comparison of new protocols and benchmarking compu-tational methods.
Results
We performed two scRNA-seq protocols (SMARTer and Smart-seq2) in parallel on 288 single-mESCs using both ERCCs and SIRVs spike-ins on Fluidigm C1-system [12,
13]. The Smart-seq2 protocol was performed in replicates (SM2 replicate 1 and 2) using mESCs batches. The single-cell lysis, reverse transcription, and pre-amplification for all methods were done within the C1-system. Each chamber within the C1 chip was visually validated to con-tain a single cell and to avoid bad chambers (doublet, deb-ris, and dead cells; Additional file 2: Supplementary methods).
library preparation and sequencing platforms affect single-cell measurements (Fig. 1a). The final libraries had similar size distributions across both sequencing platforms, though there is a weak trend for slightly lar-ger fragments in the BGISEQ-500 libraries.
For each single cell, we converted the aligned reads to normalized transcript per million (TPM) units (Additional file 2: Supplementary methods). Across single cells, the fragment size distribution, read cover-age over genes, dropout rates, and expression vari-ation were quite similar between both sequencing platforms (Additional file1: Figure S1D). We also devised pseudo-bulk by pooling all single cells together and ob-served high correlations between sequencing platforms and protocols (Additional file1: Figure S1E).
Next, we calculated the sensitivity and accuracy using both sets of spike-ins across matched single cells across both platforms (Additional file1: Figure S2A–B). Globally, the single-cell accuracy was similar across the sequencing platforms, irrespective of scRNA-seq protocol (R= 0.66– 0.70, Additional file 1: Figure S2B; violin plots in Additional file 1: Figure S2C). The sensitivity (i.e., detec-tion limit) was similar across scRNA-seq protocols and ranged from 21 to 47 molecules (number of RNA mole-cules #M= 21–47, Additional file 1: Figure S2A; violin plots in Additional file1: Figure S2D) between sequencing platforms. The detection limit was slightly lower for BGISEQ-500 platforms, likely due to highly sequencing depth. Surprisingly, we could detect as few as 12 mole-cules across one of the Smart-seq2 protocol replicates (SM2-seq replicate 1; Additional file1: Figure S2D).
Given that sensitivity can be dependent on sequencing depth [5], we compared the distribution of reads across single cells. The single cells were more deeply sequenced across BGISEQ-500 platform, accounting for slightly in-creased sensitivity (Additional file 1: Figure S2E). This also increased the detected genes in BGISEQ-500 com-pared to Illumina platform (Additional file 1: Figure S2F). Interestingly, we cultured these mESCs in media containing serum and LIF (leukemia inhibitory factor), where stem cell and differentiating subpopulations have been identified [15,16]. In one of our Smart-seq2 proto-col replicates (SM2-seq replicate1), we could discern two subpopulations based on the number of genes (Add-itional file 1: Figure S2F). We classified all single cells based on the number of genes expressed across plat-forms (Illumina > 5000 and BGI > 7500 genes) and ob-served that these subpopulations expressed different levels of pluripotency markers. The more pluripotent cells (Illumina > 5000 and BGI > 7500 genes) expressed higher levels of stem cell markers (Illumina > 5000 and BGI > 7500 genes), while the differentiated-like cells had fewer expressed genes and lower, stochastic gene expres-sion (Additional file 1: Figure S2F–G) [15, 16]. The
statistics (performance metrics, reads, spike-in, genes de-tected, etc.) for each matched single cell are summarized in Additional file4: Table S2.
To reduce the bias including technical variability, due to sequencing depth, we downsampled total reads across two orders of magnitude (raw reads to 106
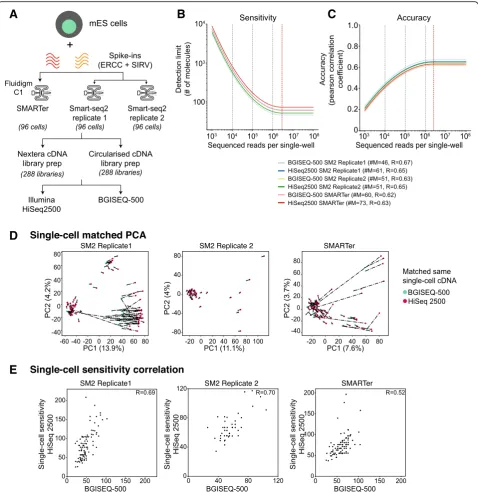
, 105, 104 total reads) and re-computed sensitivity and accuracy. This al-lows us to compare the platforms at different sequencing depths and also estimate where saturation of sequencing occurs. Both sensitivity and accuracy were highly similar across single cells between scRNA-seq protocols and se-quencing platforms, upon downsampling (Fig.1b–c). The detection limit was consistent between scRNA-seq proto-cols and sequencing platforms (#M= 46–73), with the sensitivity reaching saturation around ~ 2.8 million reads (red dashed line; Fig. 1b). The accuracy was also consist-ent (R= 0.62~0.67) between platforms, reaching saturation at ~ 2.5 million reads (red dashed line; Fig.1c).
We next assessed the matched single-cell similarity across platforms by comparing either total expression (Genes + spike-ins) or for spike-ins alone. We accounted for sequencing depth by downsampling to 1 million reads per single cell, as this has shown to be enough for single-cell analysis [5]. We performed principal compo-nent analysis (PCA) and plot each matched cell by representing the sequencing platforms, where the dis-tance between them is a measure of gene expression similarity (dashed line; Fig. 1d). The PCA captures strong similarity between matched cells (short distance) across platforms for most of the single cells across both platforms, with low PC1 (8–14%) and PC2 (4%) contri-bution. The PCA separates the pluripotent subpopula-tion from outlier cells (bad cells) (Fig.1d). This is most apparent in Smart-seq2 protocol replicate 1 (Fig.1d; first panel), where the largest subpopulation (left) corre-sponds to pluripotent cells, while the smallest subpopu-lation is differentiating-like cells (top-center; see also Additional file 1: Figure S2G) with a group of low-quality outliers (with large inter-cell distances; see also Additional file1: Figure S2G).
A
D
E
B
C
Fig. 1aSchematic overview of the mESC scRNA-seq experiment and sequencing. Three sets of 96 mESCs are profiled using SMARTer and Smart-seq2 protocols on C1-system. For each single-cell, we prepared two sets of libraries for Illumina and BGISEQ-500 platform resulting in 576 matched libraries.
[image:4.595.59.538.87.580.2]and after downsampling. The rationale is that without downsampling, single-cell correlations would be poorer due to sequencing depth variation, and skewed towards the more deeply sequenced BGISEQ-500 data. As expected, the correlations were poorer before downsampling (R= 0.14~0.52; Additional file 1: Figure S3C). Upon downsampling, the correlations were sig-nificantly improved in a manner that is consistent across protocols (R= 0.52~0.70).
We also compared the single-cell sensitivities for matched cells both before and after downsampling. The rationale is that without downsampling, single-cell cor-relations would be poorer due to sequencing depth vari-ation and skewed towards the more deeply sequenced BGISEQ-500. As expected, the correlations were poorer before downsampling (R= 0.14~0.52, Additional file 1: Figure S3C). Upon downsampling, the correlations were significantly improved in a manner that is consistent across protocols (Fig.1e,R= 0.52~0.70).
In summary, we highlight that both Illumina and BGISEQ-500 platforms have similar and comparable performance metrics (sensitivity and accuracy) and can capture underlying biological subpopulations at single-cell level. The BGISEQ-500 offers a cost-effective alternative to Illumina platform with similar yields.
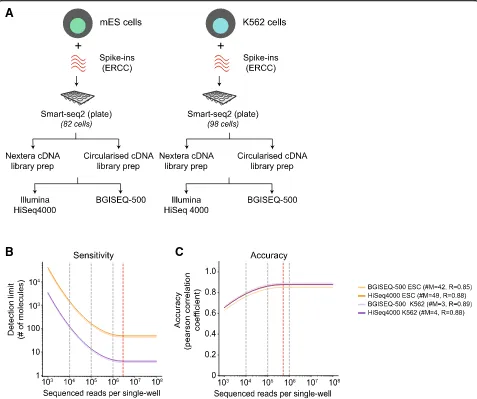
Next, we repeated our benchmarking comparison using plate-based Smart-seq2 protocol on a smaller subset of 82 mESCs and 98 K562s using ERCC spike-ins only. We chose plate-based Smart-seq2 as its most widely used full-length protocol and avoid cell capture biases in the C1-platform. We used the matched single-cell cDNA from mESCs and K562s to generate 600 BGISEQ-500 sequen-cing libraries in both single- and paired-end configura-tions and 121 HiSeq 4000 paired-end sequencing libraries (721 sequencing libraries in total) (Fig. 2a; Add-itional files4, 5,6, and7: Table S2, S3, S4, and S5). This setup allows us to compare the effect of library prepar-ation and sequencing platform from both matched single-cell cDNA, but also single-cell replicates processed in parallel (Fig.2a).
Across single-cells, the sequencing depth varied from 3 to 20 million reads across both sequencing platforms. The mESCs are much smaller than K562s with dramatically variable amount of cellular RNA per single cell. Across both sequencing platforms, we observed higher sequen-cing depth and higher number of genes and spike-ins de-tected for K562s compared to mESCs (Additional file 1: Figure S4A; Additional file6: Table S4). Taking a conser-vative cutoff (TPM > 10), we observed most genes (~ 70%) were expressed in both cell types, as well as cell type-specific genes (5500 and 2371 genes across K562s and mESCs) (Additional file1: Figure S4H).
Owing to the higher sequencing depth, the K562s had increased sensitivity across both sequencing platforms
with detection of as few as 3–4 molecules (#M = 3–4; Fig. 2b). This compared to a somewhat worse but con-sistent mESC detection limit (#M = 42~49), due to se-quencing depth variation. The accuracy, which is less dependent on depth was quite high and consistent (R= ~ 0.85~0.88) for both cell types, indicating similar per-formance metrics across sequencing platforms (Fig. 2b and Additional file1: Figure S4B–C). The accuracy satu-rated at ~ 0.5 million reads per single cell. The statistics (performance metrics, reads, genes, spike-ins detected, etc.) for each matched K562 and mESCs across both platforms are provided in Additional files4,5,6,7, and
8: Table S2, S3, S4, S5, and S6.
Since we generated mESC data from different scRNA protocols, technologies, and sequencing platforms contain-ing ERCC spike-ins in two different batches, we collectively assessed the mESCs performance metrics for both plat-forms. We downsampled the raw reads and observed that both sensitivity and accuracy were comparable between both platforms (Additional file1: Figure S4D–E). Combin-ing all the mESC data, the sensitivity and accuracy were sat-urated at ~ 2 million and ~ 250,000 reads, respectively (Additional file1: Figure S4D–E). We also observed similar detected genes detected between both platforms (Additional file1: Figure S4E, Additional files4and5: Table S2 and S3). In summary, our analysis demonstrates similar and robust performance metrics between BGISEQ-500 and Illumina platforms for scRNA-seq.
Our dataset spans 468 unique single cells of two differ-ent cell types (mESCs, K562s), two scRNA-seq protocols (SMARTer, Smart-seq2), two technologies (Fluidigm C1, plate-based), and matched 1297 libraries across Illumina and BGISEQ-500 sequencing platform (Additional files4,
5, 6,7, and8: Table S2, S3, S4, S5, and S6). In addition to paired-end (PE) data, we also generated 50 bp and 100 bp single-end (SE) scRNA-seq from mESCs and K562 totaling > 750 GB of raw single-cell data.
From both the SE and PE BGISEQ-500 data, the average sequencing depth per cell was ~ 9.6 and ~ 8.7 million reads, respectively (Additional files5,6,7, and8: Table S3, S4, S5 and S6). Both SE and PE datasets detected > 9500 genes for K562s and > 9000 genes for mESCs. The accur-acies for K562 and mESCs cells across both SE and PE reads was R= ~ 0.70–0.85, and the sensitivities for K562 and mESCs cells were #M = 4~25 across both SE and PE reads. We also compared the frequency of alternative spli-cing events in the downsampled mESCs and K562s PE data. We observe quite similar alternative splicing events between K562 and mESCs across both platforms (Add-itional file1: Figure S4G).
read-lengths across different scRNA-seq protocols, tech-nologies, and sequencing platforms. The matched 1297 single-cell datasets and annotations would serve as an ideal starting point for benchmarking and comparison of new protocols and computational methods for the scien-tific community.
Discussion
The rapid developments in single-cell genomics are transforming our understanding of biological systems by capturing underlying gene expression variability to
identify cell types, states, and transitions across cell pop-ulations. Single-cell transcriptomic profiling is a multi-step sampling procedure, where the first major step involves cell lysis, RNA capture, reverse transcrip-tion of RNA, preamplificatranscrip-tion of cDNA generatranscrip-tion. The next major step requires single-cell cDNA to be con-verted into a sequencing compatible library, followed by sequencing. There are several scRNA-seq protocols that utilize different chemistries, platforms, and technologies to address the first critical step of converting RNA into cDNA. The technical variation, performance metrics
A
B
C
[image:6.595.59.536.88.487.2](sensitivity, accuracy), and reproducibility for the first critical step have been recently evaluated and bench-marked using synthetic RNA spike-in molecules [5–7]. However, all the scRNA-seq protocols and technologies require libraries to be compatible for sequencing on short-read Illumina platform.
Here we explore an alternative BGISEQ-500 short-read sequencing platform for scRNA-seq that uses combinator-ial probe-anchor synthesis (cPAS). Unlike Illumina, BGISEQ-500 platform performs template enrichment using rolling circle amplification on DNA-Nanoballs com-bined with stepwise sequencing for template amplification [8] (Additional file1: Figure S1A). One of the biggest ad-vantages of BGISEQ-500 is the cost and throughput per run (Gb/per run). It is important to highlight that the se-quencing costs continue to decline yearly and reagent and personnel costs across facilities are often subject to geo-graphical and institutional pricing, making it difficult to compare exact costs. However, a typical BGISEQ-500 100 bp paired-end run generates 120–130 Gb (1.8-2x Illumina throughput) at 10–15% increased cost per lane. This can be especially useful for full-length scRNA-seq, where both multiplexing and higher sequencing depth per cell is re-quired. On the other hand, Illumina platform is the current state of the art with reagents widely available, used, and benchmarked.
Our study is the first to utilize BGISEQ-500 platform for scRNA-seq. Our comprehensive benchmarking of performance metrics utilizes two scRNA-seq protocols (SMARTer and Smart-seq2), multiple spike-ins (ERCC alone, ERCC+SIRV), two different cell lines (mESCs, K562s), and two technologies (Fluidigm C1, plate-based) across Illumina HiSeq and BGISEQ-500 platform. Utiliz-ing 468 sUtiliz-ingle K562 and mESCs and matched 1297 single-cell libraries, we observe BGISEQ-500 to be highly comparable in sensitivity, accuracy, and reprodu-cibility to Illumina platform, while being considerably more cost-effective.
From our mESC scRNA-seq dataset, we could distin-guish technical artifacts (sequencing depth) from bio-logical variation (subpopulations) across both sequencing platforms. We observe differential alternative splicing events between K562s and mESCs across both sequencing platforms. We observe some RNA degradation in few single-cell libraries, which we believe is due to transport of samples. Our data using mESCs and K562s across two scRNA-seq protocols supports the notion that minimal variability is introduced during library preparation and se-quencing for both Illumina and BGISEQ-500 platforms. In combination with our previous framework [5], we be-lieve that variability between the steps of scRNA-seq pro-tocols is largest during the RNA to cDNA step. Both the performance metrics and single-cell characteristics (num-ber of genes, expression range, subpopulation, etc.)
suggest that BGISEQ-500 library preparation and sequen-cing are robust and comparable to Illumina platforms for single-cell applications.
We observe minimal variability in cDNA processing across different library preparation and sequencing plat-forms. In the current study, we did not perform scRNA-seq protocols with Unique Molecular Identifiers (UMIs) that account for PCR amplification biases. Given that UMIs primarily address biases during the RNA-to-cDNA stage (and to cDNA amplification), this would have minimal or no impact on our assessment of sequencing platforms. The scRNA-seq UMI-based proto-cols could easily be extended to be compatible with se-quencing on BGISEQ-500 platform. Our large resource for benchmarking scRNA-seq data suggests that the BGISEQ-500 platform is suitable for plate-based (micro-well or nano(micro-well), droplet, and microfluidics technologies.
In addition to benchmarking, we provide a large com-prehensive multi-cell type, protocol, and platform scRNA-seq dataset spanning 468 cells and 1297 libraries in both single- and paired-end configuration to the com-munity. Given the large research initiatives profiling transcriptomes of single cells in mouse [3, 17] and Hu-man, such as the Human Cell Atlas [18], achieving high-quality and cost-effective methods is paramount. Our standardized resource can be utilized for investigat-ing technical biases and for benchmarkinvestigat-ing scRNA-seq protocols and computational methods.
Additional files
Additional file 1:Supplementary figures. (PDF 1140 kb)
Additional file 2:Supplementary methods. (PDF 608 kb)
Additional file 3:Table S1.The sequencing throughput and costs for single- and paired-end reads across both Illumina and BGISEQ-500 platform. (XLSX 9 kb)
Additional file 4:Table S2.Single-cell library statistics computed from rawpaired-endsequencing reads for mESCs using SMARTer and Smart-seq2 protocols and sequenced across HiSeq2500 and BGISEQ-500 platforms. (CSV 50 kb)
Additional file 5:Table S3.Single-cell library statistics computed from randomly downsampled 1 millionpaired-endsequencing reads for mESCs performed using SMARTer and Smart-seq2 protocols and sequenced across HiSeq2500 and BGISEQ-500 platforms. (CSV 48 kb)
Additional file 6:Table S4.Single-cell library statistics computed from rawpaired-endsequencing reads for mESCs and K562 using plate-based Smart-seq2 protocol and sequenced across HiSeq4000 and BGISEQ-500 platforms. (CSV 87 kb)
Additional file 7:Table S5.Single-cell library statistics computed from randomly downsampled 1 millionpaired-endsequencing reads for mESCs and K562 using plate-based Smart-seq2 protocol and sequenced across HiSeq4000 and BGISEQ-500 platforms. (CSV 82 kb)
Additional file 9:Table S7.Metadata for all single-cell libraries profiled in this manuscript. Each cell is labeled with a sample id (accession num-ber), protocol, place of experiment, read type, and sequencing platform.
Acknowledgements
The authors thank the Teichmann lab for helpful discussions and comments on the manuscript.
Funding
This study was supported by ERC grant (#260507) to SAT. S.P.L was supported by grants from Chinese Ministry of Science and Technology, Shenzhen Innovation Committee (#JCYJ20170412153248372) and Fundamental Central University research fund (x2swD2172910). N.Y was supported by P.R.China, MST Special Fund. Z.M was supported by Wellcome Trust grant (#108437/Z/15/Z). KNN was supported by a Wellcome Trust Grant (105031/B/14/Z), core funding from SDU, Denmark, VILLUM Fonden Young Investigator Award (#00025397) and Novo Nordisk funding (#NNF18OC0052874).
Availability of data and materials
The SMARTer, two replicates of Smart-seq2 scRNA-seq runs using mESCs and both spike-ins (ERCCs and SIRVs) and sequenced on BGISEQ-500 are deposited at E-MTAB-7239 [19]. The matched ESC data can be retrieved from ArrayExpress (E-MTAB-5483, E-MTAB-5484 and E-MTAB-5485) [5]. The plate-based Smart-seq2 scRNA-seq runs using mESC and K562 cells and ERCCs spike-ins, sequenced on both HiSeq 4000 and BGISEQ-500 are deposited at BioProject (#PRJNA430491) [20], linked sequence read archive repository (SRA#: SRP132313) [21] and CNGB nucleotide Sequencing archive (CNP0000075). The supplementary tables (Additional files4,5,6,7,8, and9: Table S2, S3, S4, S5, S6 and S7) contain additional single-cell statistics (Accuracy, sensitivity, #genes, #reads and #spike-ins detected etc.) and associated metadata.
Authors’contributions
KNN, XH, SL, and SAT designed and supervised the project. KNN, HZ, JX, and CW performed the experiments with help from SQ, ZZ, LW, BL, and YH. KNN and ZM performed the bioinformatics analysis. KNN, ZM, MJ, XH, and SAT wrote the manuscript. All authors reviewed and approved the manuscript.
Ethics approval and consent to participate
Not applicable.
Consent for publication
Not applicable.
Competing interests
MJ, XH, HZ, JX, CW, SQ, ZZ, LW, BL, YH, and SL are employees of Beijing Genomics Institute, Shenzhen, China. The other authors declare that they have no competing interests.
Publisher’s Note
Springer Nature remains neutral with regard to jurisdictional claims in published maps and institutional affiliations.
Author details
1
Wellcome Sanger Institute, Wellcome Genome Campus, Hinxton, Cambridge CB10 1SA, UK.2European Bioinformatics Institute (EMBL-EBI), Wellcome
Genome Campus, Hinxton, Cambridge CB10 1SD, UK.3Danish Institute of
Advanced Study (D-IAS), Functional Genomics and Metabolism Unit, Department of Biochemistry and Molecular Biology, University of Southern Denmark, Odense 5230, Denmark.4BGI-Shenzhen, Shenzhen 518083, China. 5State Key Laboratory of Bioelectronics, Southeast University, Nanjing 210096,
China.6China National GeneBank, BGI-Shenzhen, Shenzhen 518120, China. 7
School of Biology and Biological Engineering, South China University of Technology, Guangzhou, China.8Theory of Condensed Matter, Cavendish
Laboratory, Cambridge University, JJ Thomson Avenue, Cambridge CB3 0HE, UK.
Received: 24 September 2018 Accepted: 14 March 2019
References
1. Tirosh I, Izar B, Prakadan SM, Wadsworth MH 2nd, Treacy D, Trombetta JJ, et al. Dissecting the multicellular ecosystem of metastatic melanoma by single-cell RNA-seq. Science. 2016;352:189–96.
2. Lönnberg T, Svensson V, James KR, Fernandez-Ruiz D, Sebina I, Montandon R, et al. Single-cell RNA-seq and computational analysis using temporal mixture modelling resolves Th1/Tfh fate bifurcation in malaria. Sci Immunol [Internet]. 2017;2 Available from:https://doi.org/10.1126/sciimmunol.aal2192. 3. Han X, Wang R, Zhou Y, Fei L, Sun H, Lai S, et al. Mapping the mouse cell
atlas by Microwell-Seq. Cell. 2018;173:1307.
4. Natarajan KN, Teichmann SA, Kolodziejczyk AA. Single cell transcriptomics of pluripotent stem cells: reprogramming and differentiation. Curr Opin Genet Dev. 2017;46:66–76.
5. Svensson V, Natarajan KN, Ly L-H, Miragaia RJ, Labalette C, Macaulay IC, et al. Power analysis of single-cell RNA-sequencing experiments. Nat Methods. 2017;14:381–7.
6. Ziegenhain C, Vieth B, Parekh S, Reinius B, Guillaumet-Adkins A, Smets M, et al. Comparative analysis of single-cell RNA sequencing methods. Mol Cell. 2017;65:631–43.e4.
7. Wu AR, Neff NF, Kalisky T, Dalerba P, Treutlein B, Rothenberg ME, et al. Quantitative assessment of single-cell RNA-sequencing methods. Nat Methods. 2014;11:41–6.
8. Goodwin S, McPherson JD, McCombie WR. Coming of age: ten years of next-generation sequencing technologies. Nat Rev Genet. 2016;17:333–51. 9. Fehlmann T, Reinheimer S, Geng C, Su X, Drmanac S, Alexeev A, et al.
cPAS-based sequencing on the BGISEQ-500 to explore small non-coding RNAs. Clin Epigenetics. 2016;8:123.
10. Huang J, Liang X, Xuan Y, Geng C, Li Y, Lu H, et al. A reference human genome dataset of the BGISEQ-500 sequencer. Gigascience. 2017;6:1–9. 11. Mak SST, Gopalakrishnan S, Carøe C, Geng C, Liu S, M-HS S, et al. Comparative
performance of the BGISEQ-500 vs Illumina HiSeq2500 sequencing platforms for palaeogenomic sequencing. Gigascience. 2017;6:1–13.
12. Picelli S, Faridani OR, Björklund AK, Winberg G, Sagasser S, Sandberg R. Full-length RNA-seq from single cells using Smart-seq2. Nat Protoc. 2014;9:171–81.
13. Ramsköld D, Luo S, Wang Y-C, Li R, Deng Q, Faridani OR, et al. Full-length mRNA-Seq from single-cell levels of RNA and individual circulating tumor cells. Nat Biotechnol. 2012;30:777–82.
14. Yue F, Cheng Y, Breschi A, Vierstra J, Wu W, Ryba T, et al. A comparative encyclopedia of DNA elements in the mouse genome. Nature. 2014;515: 355–64.
15. Klein AM, Mazutis L, Akartuna I, Tallapragada N, Veres A, Li V, et al. Droplet barcoding for single-cell transcriptomics applied to embryonic stem cells. Cell. 2015;161:1187–201.
16. Kolodziejczyk AA, Kim JK, Tsang JCH, Ilicic T, Henriksson J, Natarajan KN, et al. Single cell RNA-sequencing of pluripotent states unlocks modular transcriptional variation. Cell Stem Cell. 2015;17:471–85.
17. Tabula Muris C, Overall C, Logistical C, Organ C, Processing, Library P, Sequencing, Computational Data A, Cell Type A, Writing G, et al. Single-cell transcriptomics of 20 mouse organs creates a Tabula Muris. Nature. 2018; 562:367–72.
18. Rozenblatt-Rosen O, Stubbington MJT, Regev A, Teichmann SA. The human cell atlas: from vision to reality. Nature. 2017;550:451–3.
19. Natarajan KN, Miao Z, Jiang M, Huang X, Zhou H, Xie J, Wang C, Qin S, Zhao Z, Wu L, Yang N, Li B, Hou Y, Liu S, Teichmann SA. Comparative analysis of sequencing technologies platforms for single-cell transcriptomics. ArrayExpress. 2019.https://www.ebi.ac.uk/arrayexpress/ experiments/E-MTAB-7239/. Accessed 28 Mar 2019.
20. Natarajan KN, Miao Z, Jiang M, Huang X, Zhou H, Xie J, Wang C, Qin S, Zhao Z, Wu L, Yang N, Li B, Hou Y, Liu S, Teichmann SA. Comparative analysis of sequencing technologies platforms for single-cell transcriptomics. NCBI Bioproject. 2019.https://www.ncbi.nlm.nih.gov/bioproject/?term= PRJNA430491. Accessed 28 Mar 2019.