Scheduling Algorithms Implementation for
LTE Downlink
S. Sravani, M.Tech Student
Dept. of ECE, St. Ann’s College of Engineering & Technology, Chirala, INDIA. [email protected]
K. Jagadeesh Babu, Professor
Dept. of ECE, St. Ann’s College ofEngineering & Technology, Chirala, INDIA.
Abstract: The increasing demand for cellular communications leads to the development of Long Term Evolution (LTE). LTE is the evolution for existing 3G mobile networks which offers higher capacity, efficient utilization of radio resources, lower latency. As a core functionality of LTE downlink radio resource management, packet scheduling algorithms plays a vital role. Maximum SNR( Max SNR), Round Robin, Proportional Fair are the conventional scheduling algorithms. The main contribution of Max SNR is towards maximizing system throughput. Round Robin and Proportional algorithms tries to please the fairness among the users. In this paper two new scheduling Algorithms has been proposed in order to give higher capacity than Round Robin and higher fairness than Max SNR.
Keywords: LTE, OFDMA, Packet Scheduling, Max SNR, Round Robin, Proportional Fair.
I.
INTRODUCTIONLTE release 8 is the standard for Radio Access Network specified by 3GPP [1]. 3GPP, the 3rd Generation Partnership Project is collaboration between groups of telecommunications associations known as organizational partners. LTE is a standard [2] for Radio Access Network (RAN) part of Evolved –
Universal Terrestrial Radio Access (E-UTRA). The standard is targeted to support 100Mbps for downlink and 50Mbps for uplink. It uses Orthogonal Frequency Division Multiple Access (OFDMA) for downlink and Single Carrier – Frequency Division Multiple Access (SC–FDMA) for uplink. WCDMA is used for 3GPP Release 6. It is verified that OFDMA is outperforming than WCDMA in both broadcast and unicast services [3].
The efficient use of radio resources has become the challenging task for next generation wireless communication systems. The scarcity of radio resources, diverse Quality of
complicate the scheduling and radio resource management. The main function of the scheduler is to
intelligently allocate radio resources to users in order to achieve high system performance in terms of efficiency and fairness. This makes the scheduling algorithm a key component in optimizing the system performance across the physical (PHY) and Media Access Control (MAC) layers [5].
The Two key performance indicators considered are fairness and efficiency. Efficiency is evaluated in terms of system throughput, which is sometimes unfair to users with bad channel conditions. On the other hand, absolute fairness may lead to low bandwidth efficiency. Therefore, a tradeoff between efficiency and fairness is desired.
II.
BRIEFINTRODUCTION TOCONVENTIONAL SCHEDULINGALGORITHMSidentified by their unique ID. Active users are changed for every instant because the users are situated randomly but not fixed.
A. MAX SNR Scheduler
In Max SNR Scheduling all the users are ranked with their respective Signal-to-noise ratio (SNR) Values. For every scheduling event, the user with the highest SNR value is selected and allocated number of time cycles depending on service requirements and availability of resources. It is possible for the same user to be rescheduled for the next available resource provided that it still possess the highest SNR value at the next scheduling event. The user selection for every scheduling event depends upon the following criteria:
= ( ) (1)
Here, j is the selected user for the ith instant,( ) is the SNR ratio of ith user, N is the total number of active users.
B. Round Robin Scheduler
Round Robin (RR) is a well known scheduling strategy
in packet data services. RR runs the scheduling in a fixed cycle. All active users are identified by their ID. Each user is allocated an equal and fixed number of time slot(s) in a ring fashion. Transmission service will not be regranted to the same user before all other users had been served as shown below.
= ( ( )) (2)
Here, N is the total number of active users, ( )is the user queue length, j is the selected user for the instant. The users are served on first come first serve basis.
C. Proportional Fair Scheduler
The proportional fair tries to please both fairness and total system throughput requirements with the following metric. In order to improve fairness without sacrificing much in terms of throughput, one can incorporate both fairness and throughput in a scheduling scheme as figures of merit. Proportional Fair (PF) is one of many efforts to address this issue. The scheduler selects the user with a maximal priority metric, defined as
j=arg ( )
( ) (3)
Where i is the user index, j is the selected user, N is the total number of users, ( )is the current supportable data rate by the channel, and ( − 1)is the average experienced rate by this user. With this scheme, a user is selected when it has a good channel or high ( ), to keep system throughput high. In the meantime, users in bad channels are also considered since their low average rate ( − 1)will increase their chance of being selected for the next scheduling event.
III.
SYSTEM MODELThe LTE system is based on a flat architecture, known as
“Service Architecture Evolution”, with respect to 3G systems [5]. This guarantees a seamless mobility support and a high speed delivery for packet data and signaling. As shown in Fig 1,
it is made by a core network, known as the “Evolved Packet
Core”, and a radio access network, namely the Evolved –
Universal Terrestrial Radio Access Network (E - UTRAN). The Evolved Packet Core comprises the Mobility Management Entity (MME), the Serving Gateway (SGW), and the Packet Data Network Gateway (PGW). The MME is responsible for user mobility, intra-LTE handover, and tracking and paging procedures of User Equipments (UEs) upon connection establishment. The main purpose of the SGW is, instead, to route and forward user data packets among LTE nodes, and to manage handover among LTE and other 3GPP technologies. The PGW interconnects LTE network with the rest of the world, providing connectivity among UEs and external packet data networks.
Figure 1: The service Architecture Evolution in LTE Network
In the downlink System simulation of LTE, 19-cell structure with 19 Base Stations (eNB) are located at the cell center, N number of users (UE) are uniformly distributed within the cell radius are considered. Wrap around technique is employed to avoid edge effects [6]. OFDMA has been adopted as multiple access technique. As the signal travels through wireless medium it has path loss and affected by multipath fading.
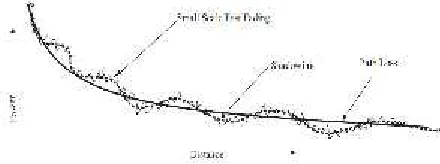
A. Path loss Model
The path loss from each base station to each user is calculated. A user is made associated with the base station which has minimum path loss from the user among all the path losses from all the eNBs.
Figure 2: Propagation Path loss
The path loss model considered for the simulation is,
( ) = 128.1 + 37.6 ∗ ( ) + + 10 ∗ ( )
(4)
Where, ( )is the path loss of a user at distance d, S is is the shadowing value and it is log-normally distributed with zero mean and 8dB standard deviation and is the multipath fading coefficient over frequency channel k.
B. Channel Model
In IEEE 802.16a standard, the non-line of sight (NLOS) is assumed. The frequency selective fading can be modeled as Rayleigh fading by using tapped delay line model [6]. The development of frequency selective fading channel leads to a representation of the time-varying channel impulse response as
ℎ( , ) = ℎ ( ) ( − ( )) + ℎ ( ) ( − ( )) +
ℎ ( ) ( − ( )) (5)
Where, ℎ( , )is the averaging of the received signal from multipath, ℎ ( ), ℎ ( ), ℎ ( ) are the time varying gains, ( − ( ))are the impulse response of signal at delays . The multi path gains are considered from the power delay profile [7].
In this, channel is modeled using three fading paths, each representing a cluster of multipath components received at around the same delay. The maximum Doppler shift is computed as v*f/c, where v is the mobile speed, f is the carrier frequency, and c is the speed of light. For example, a maximum Doppler shift of 200 Hz (as above) corresponds to a mobile speed of 65 mph (30 m/s) and a carrier frequency of 2 GHz.
Together, the path delays and path gains specify the channel's average delay profile. Typically, the average path gains decay exponentially with delay (i.e., the dB values decay linearly), but the specific delay profile depends on the propagation environment.
C. System Description
Based on the frame structure in the standard, for 5MHz
bandwidth 24 Physical Resource Blocks (PRB’s) are supported.
[image:4.612.42.262.482.564.2]of number of PRBs it can use for transmission and are listed in table 1.1 [8-11].
Table 1: Number of PRBs for each channel bandwidth supported by LTE
Channel Bandwidth (MHz)
1.4 3 5 10 15 20
Number of
PRB’s 6 15 25 50 75 100
For every scheduling drop, PRBs are allocated to the uniformly distributed users according to the specified scheduling algorithm. Each user reported with the specified SINR and is calculated as,
= (6)
Where,
= ( ) (7)
Here, is the Received Signal Power, B is the Thermal Noise power over transmission bandwidth, is the transmitted signal power, ( )is the Path Loss. From this the capacity of the system can be defined as
= BW× (1 + ) (8)
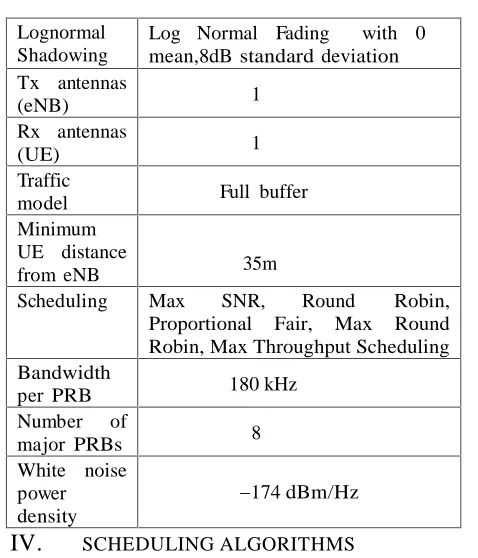
[image:5.612.325.564.121.400.2] [image:5.612.53.287.244.305.2]The simulation parameters adopted are listed in the below table.
Table 2: Simulation Parameters
Parameter Value
Carrier
frequency 2000 MHz
Cellular
layout Two tier (19 cells) Inter-site
distance 1.732 Km
System
bandwidth 5 MHz, 24 PRBs considered
Distance-dependent path loss
128.1 + 37.6 log10 (d), d in kilometers
Lognormal Shadowing
Log Normal Fading with 0 mean,8dB standard deviation Tx antennas
(eNB) 1
Rx antennas
(UE) 1
Traffic
model Full buffer
Minimum UE distance
from eNB 35m
Scheduling Max SNR, Round Robin, Proportional Fair, Max Round Robin, Max Throughput Scheduling Bandwidth
per PRB 180 kHz
Number of
major PRBs 8
White noise power density
−174 dBm/Hz
IV.
SCHEDULING ALGORITHMSDifferent wireless users experience different channel conditions at a given time. At any given time there will be high probability that some users will have good radio link condition. By scheduling users, the shared channel resources are used in the most efficient manner and the total system capacity is maximized.
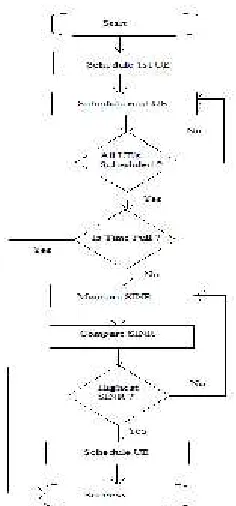
A. Algorithm 1
This scheduling algorithm has been developed to please the system throughput as well as fairness. In this Scheduling scheme users are scheduled in two levels. In the first level, the scheduler gives equal priority to all the users and in the second level, the users with highest SINR will be served. With this scheme fairness is maintained in the first level, higher throughput will be achieved from the second level. User selection will be according to the following criteria.
For first level:
= ( ( )) (9)
[image:5.612.57.282.506.665.2]= ( ) (10)
[image:6.612.379.507.123.417.2]The flow chart for the above scheduling algorithm is depicted below.
Figure 3: Flow chart for Algorithm 1
B. Algorithm 2
Main objective of this algorithm is to serve all the active users but the user with highest SINR will serve first. So that the Throughput as well as Fairness among all the users will be maintained. The working of this algorithm is as follows:
[image:6.612.114.232.190.443.2]All the active users are ranked according to their SINR and arranged in the descending order. Resources are allotted in a round robin fashion, the UE having high SINR served first and second highest served second and so on. The served user will again served only when all the users are served in the present time slot. The flow chart regarding the working of above algorithm has shown below.
Figure 4: Flow chart for Algorithm 2
C. Scheduling Scheme Evaluation
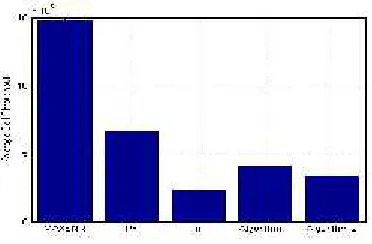
The Scheduling algorithms have been compared in terms of Average Cell Throughput, System Capacity and fairness coefficient [14]: the fairness coefficient is defined as= , Where V is the variance of the normalized throughput of multi users. System capacity refers to the overall system capacity and Average cell throughput refers to the average throughput of all the cells.
V.
SIMULATION RESULTSScheduler are almost same because number of users is less than
the number of PRB’s. In case of Fairness Both the Algorithms
[image:7.612.54.571.150.654.2]are having high value than Max SNR.
Figure 5: Average Cell Throughput
Figure 6: Fairness Coefficient
Figure 7: System Capacity
[image:7.612.55.241.175.297.2]The below table shows the comparative results of all the scheduling algorithms with respect to different parameters.
Table 3: Comparison of different parameters for different scheduling algorithms
VI.
CONCLUSIONSLTE is a breakthrough technology with respect to previous generation of cellular networks, as it is based on an all-IP architecture that aims at supporting several high quality services such as video streaming, VoIP, online gaming and everything related to wideband Internet access. Given this ambitious objective, the desired performance can only be achieved by implementing a series of procedures at physical and MAC layers, able to exploit the wireless link capacity up to the Shanon limit.
The two scheduling algorithms are outperforming than the conventional scheduling methods. The radio resources are used in an efficient manner through these algorithms.
REFERENCES
[1] www.3gpp.org.
[2] 3GPP, Tech. Specif. Group Radio Access Network –
Requirements for Evolved UTRA (E-UTRA) and Evolved UTRAN (E-UTRAN), 3GPP TS 25.913.
[3] T.25.892, Feasibility Study for Orthogonal Frequency Division Multiplexing (OFDM) for UTRAN enhancement. 2004 - 06.
[4] International Telecommunication Union (ITU), Overall network operation, telephone service, service operation and human factors, ITU-T Recommendation E.800 Annex B, Aug.2008
MAXSNR PF RR Algorithm 1 Algorithm 2
Average cell Throughput (10^5)
14 7 2.8 4.5 4
Fairness coefficient
5.8 ×
10 1.9× 10 1.74× 10 6.2× 10 1.74× 10
System capacity
2.8
[image:7.612.291.573.194.310.2][5] 3GPP, Tech. Specif. Group Radio Access Network –
Evolved Universal Terrestrial Radio Access (E - UTRA) and Evolved Universal Terrestrial Radio Access Network (E - UTRAN); Medium Access Control (MAC) Protocol Specification (Release 9), 3GPP TS 36.321.
[6] Basic operation of the wrap-around technique for system
– level simulation. [online]. Available: ftp://ftp.3gpp2.org/ TSGC/Working /2002/TSGC0207/TSGC200207SanDiego /WG3/c30200 2 0708 -030%20ericy%20 wrap%20around %20 pr -oposal.pdf [7] E.Dahlman, S. parkvall, J. Skold, and P.Beming, 3G
Evolution HSPA and LTE for Mobile Broadband. Academic Press 2008.
[8] Biglieri, Ezio; Proakis, J.;Shamai, S., “Fading channels:
Information-theoretic and communications aspects,”
Information Theroy, IEEE Transactions on, vol.44, no.6, pp. 2619, 2692, Oct 1998 doi: 10.1109/19.720551 [9] Patzold, M.: Szczepanski, A.; Youssef, N., “Methods for
modeling of specified and measured multipath power –
delay profiles, “Vehicular Technology, IEEE
Transactions on, vol.51, no.5, pp.978,988, Sep 2002 doi: 10.1109/TVT.2002.801747.
[10] T. 36.101, “Evolved universal terrestrial radio access (E-UTRA) User Equipment (UE) radio transmission and
reception,” 2008.
[11] A. Oborina and M. Moisio, “Speed up of efficient sinr mapping calculations for system level simulations”, in
Antennas and Propagation, 2007. EuCAP 2007. The second European Conference on, pp. 1–6, nov. 2007. [12] H. Song, R. Kwan and J. Zhang, “On Statistical
characterization of eesm effective snr over frequency
selective channels,” Wireless Communications, IEEE
Transactions on, vol.8, pp.3955–3960, august 2009. [13] E. Tuomaala and H. Wang, “Effective sinr approach of
link to system mapping in ofdm/multi-carrier mobile
network,” in Mobile Technology, Applications and
Systems, 2005 2ndInternational Conference on, pp. 5 pp. -5, nov.2005.