Briggs, A.H., Weinstein, M.C., Fenwick, E.A.L., Karnon, J., Sculpher,
M.J., and Paltiel, A.D. (2012) Model parameter estimation and uncertainty
analysis: a report of the ISPOR-SMDM modeling good research practices
task force working group - 6. Medical Decision Making, 32 (5). pp.
722-732. ISSN 0272-989X
Copyright © 2012 The Authors
http://eprints.gla.ac.uk/73438/
Deposited on: 20 December 2012
Enlighten – Research publications by members of the University of Glasgow
http://eprints.gla.ac.uk
http://mdm.sagepub.com/
Medical Decision Making
http://mdm.sagepub.com/content/32/5/722
The online version of this article can be found at:
DOI: 10.1177/0272989X12458348
2012 32: 722
Med Decis Making
Andrew H. Briggs, Milton C. Weinstein, Elisabeth A. L. Fenwick, Jonathan Karnon, Mark J. Sculpher and A. David Paltiel
Research Practices Task Force Working Group
−
6
Model Parameter Estimation and Uncertainty Analysis : A Report of the ISPOR-SMDM Modeling Good
Published by:
http://www.sagepublications.com
On behalf of:
Society for Medical Decision Making
can be found at:
Medical Decision Making
Additional services and information for
Immediate free access via SAGE Choice Open Access: http://mdm.sagepub.com/cgi/alerts Email Alerts: http://mdm.sagepub.com/subscriptions Subscriptions: http://www.sagepub.com/journalsReprints.nav Reprints: http://www.sagepub.com/journalsPermissions.nav Permissions:
What is This?
- Sep 18, 2012
Version of Record
>>
Model Parameter Estimation and
Uncertainty Analysis: A Report of the
ISPOR-SMDM Modeling Good Research
Practices Task Force Working Group–6
Andrew H. Briggs, DPhil, Milton C. Weinstein, PhD, Elisabeth A. L. Fenwick, PhD,
Jonathan Karnon, PhD, Mark J. Sculpher, PhD, A. David Paltiel, PhD, on Behalf of
the ISPOR-SMDM Modeling Good Research Practices Task Force
A model’s purpose is to inform medical decisions and health care resource allocation. Modelers employ quantita-tive methods to structure the clinical, epidemiological, and economic evidence base and gain qualitative insight to assist decision makers in making better decisions. From a policy perspective, the value of a model-based analysis lies not simply in its ability to generate a precise point esti-mate for a specific outcome but also in the systematic examination and responsible reporting of uncertainty sur-rounding this outcome and the ultimate decision being ad-dressed. Different concepts relating to uncertainty in decision modeling are explored. Stochastic (first-order) uncertainty is distinguished from both parameter (second-order) uncertainty and from heterogeneity, with structural uncertainty relating to the model itself forming another
level of uncertainty to consider. The article argues that the estimation of point estimates and uncertainty in param-eters is part of a single process and explores the link between parameter uncertainty through to decision uncer-tainty and the relationship to value-of-information analy-sis. The article also makes extensive recommendations around the reporting of uncertainty, both in terms of deter-ministic sensitivity analysis techniques and probabilistic methods. Expected value of perfect information is argued to be the most appropriate presentational technique, along-side cost-effectiveness acceptability curves, for representing
decision uncertainty from probabilistic analysis. Key
words:uncertainty analysis; sensitivity analysis;
heteroge-neity; value of information; guidelines.(Med Decis Making
2012;32:722–732).
A
new Good Research Practices in Modeling TaskForce was constituted by the ISPOR Board of Directors in 2010, and the Society for Medical Decision Making was invited to join the effort. This
paper, along with six others,1-6 is part of a series commissioned by the Task Force.
INTRODUCTION
This report adopts the Task Force’s view that a model’s purpose is to inform medical decisions and health care resource allocation. Modelers employ quantitative methods to structure the clinical,
Related Materials
For more information on the ISPOR-SMDM Task Force, visit the website at http://www.ohsu.edu/epc/mdm/modeling.cfm. See ‘‘Modeling Good Research Practices—Overview, Issues, and Pre-ferred Practices: A Report of the ISPOR-SMDM Modeling Good Research Practices Task Force,’’ by J. Jaime Caro, Andrew H. Briggs, Uwe Siebert, and Karen M. Kuntz, published in this issue on pages 667-677, for an overview of the series.
Received 2 March 2012 from the Institute of Health & Wellbeing, Univer-sity of Glasgow, Glasgow, UK (AHB, EALF); Harvard School of Public Health, Boston, Massachusetts, USA (MCW); School of Population Health and Clinical Practice, University of Adelaide, SA, Australia (JK); Centre for Health Economics, University of York, York, UK (MJS); Yale School of Medicine and Yale School of Management, New Haven, Connecticut, USA (ADP). Revision accepted for publica-tion 18 April 2012.
Address correspondence to Andrew H. Briggs, Health Economics and Health Technology Assessment, Institute of Health & Wellbeing, Univer-sity of Glasgow, 1 Lilybank Gardens, Glasgow G12 8RZ, Glasgow, G12 8RZ, UK; e-mail:[email protected].
epidemiological, and economic evidence base and gain qualitative insight to assist decision makers in making better decisions. From a policy perspective, a model-based analysis’s value lies not simply in its ability to generate a precise point estimate for a spe-cific outcome but also in the systematic examination and responsible reporting of uncertainty surrounding this outcome and the ultimate decision being addressed. These are the hallmarks of good modeling practice.
The extent to which an uncertainty analysis can be considered fit for purpose in part depends on the decision(s) the modeling seeks to support. Uncer-tainty analysis can serve 2 main purposes: assess con-fidence in a chosen course of action and ascertain the value of collecting additional information to better inform the decision.
Many models are designed to help decision makers maximize a given outcome (e.g., cases identified in a screening model, or quality-adjusted life-years, in a cost-effectiveness model), subject, perhaps, to one or more limiting constraints (such as a fixed budget). The model generates point estimates of the outcome for each possible course of action; the ‘‘best’’ choice is the one that maximizes the outcome subject to the constraint. If the decision maker has to make a resource allocation decision now, has no role in commissioning or mandating further research, and cannot delay the decision or review it in the future, then the role of uncertainty analysis is limited and the decision should be based only on expected values (although some commentators have argued that for nonlinear models, probabilistic sensitivity analysis [PSA] is required to generate appropriate expected values7). Nevertheless, decision makers may want to gauge confidence in the best choice’s appropriate-ness by exploring its robustappropriate-ness to changes in the model’s inputs.
Increasingly, models are developed to guide deci-sions of particular bodies (e.g., organizations respon-sible for deciding whether to reimburse a new pharmaceutical). Such decision makers who have the authority to delay decisions or review them later, based on research they commission or mandate, should be interested not just in expected cost-effec-tiveness but also in a thorough uncertainty analysis and the value of additional research. Such informa-tion, as well as assessments of factors such as the costs of reversing a decision shown to be suboptimal as further information emerges, and the cost of research and likelihood of undertaking it, can influence the array of decisions available. Thus,
uncertainty analysis conveys not only qualitative information about the critical uncertainties sur-rounding a decision but also quantitative information about the decision maker’s priorities in allocating resources to further research.
Many models are developed for general dissemina-tion, without a specific decision maker in mind. Such models could inform a range of decision makers with varying responsibilities. Here, there is a case for undertaking a full uncertainty analysis, thus allowing different decision makers to take from the analysis what they require given the decisions with which they are charged.
Best Practices
VI-1 The systematic examination and responsible reporting of uncertainty are hallmarks of good model-ing practice. All modelmodel-ing studies should include an uncertainty assessment as it pertains to the decision problem being addressed.
VI-2The decision maker’s role should be considered when presenting uncertainty analyses. The analytic perspective description should include an explicit statement regarding what is assumed about the deci-sion makers’ power to delay or review decideci-sions and to commission or mandate further research.
BACKGROUND AND TERMINOLOGY
It is important to be precise concerning the termi-nology used in this article, which is sometimes confused in the literature (reflecting the multidisci-plinary nature of decision modeling in health care). In particular, stochastic (first-order) uncertainty is distinguished from both parameter (second-order) uncertainty and from heterogeneity. Furthermore, each concept is argued to have an analogous form within a regression-type model in statistics. As in regression analysis, the structural uncertainty asso-ciated with the model itself must also be considered. Table 1 summarizes the concepts used here and pre-ferred terminology, lists other terms used, and pro-vides the link to statistical regression.
The termparameter uncertaintyis not the same as the uncertainty around the realization of individual events or outcomes. This stochastic uncertainty relates to the fact that individuals facing the same probabili-ties and outcomes will experience the effects of a dis-ease or intervention differently, just as a fair coin might come up heads or tails on any given toss (e.g.,
the first patient in a sample might respond to a treat-ment but the next may not, the first may not experience an adverse effect but the second may, the first may stay in hospital for 2 days and the second for 3). Parameter uncertainty (second-order uncertainty) relates to the fact that the probabilities that govern outcomes are themselves uncertain because they are estimated quantities (e.g., 100 tosses of a fair coin will not always lead to 50 realizations of ‘‘heads’’ and 50 ‘‘tails’’). Esti-mates of the probability of ‘‘heads’’ based on 100 obser-vations are uncertain. The sample size informing that estimate and variance in the data contribute to deter-mining the parameter uncertainty. Parameter uncer-tainty also arises from the existence of multiple, conflicting studies; problems with a source study’s internal or external validity; generalizability from a study to a real-world setting; and lack of empirical data. Although these 2 types of uncertainty are clearly linked, uncertainty about actual outcomes for individ-uals differs from uncertainty surrounding population parameter values (e.g., the response probability, adverse event probability, or mean length of hospital stay). The distinction is analogous to the difference between standard deviation (estimate of how individ-ual observations within a sample vary) and standard error (precision of an estimated quantity).
Parameter uncertainty may be represented via deterministic sensitivity analysis (DSA) or via PSA. In a DSA, parameter values are varied manually to test the sensitivity of the model’s results to specific parameters or sets of parameters. In a PSA, (prefera-bly) all parameters are varied simultaneously, with multiple sets of parameter values being sampled from a priori–defined probability distributions. The
outputs from a PSA may inform several different forms of analysis, including confidence intervals, cost-effectiveness planes (showing the distributions of costs and effects for each evaluated technology or service), cost-effectiveness acceptability curves (showing the probability of cost-effectiveness for each option), and value-of-information analyses. The latter involve the estimation of the expected value of perfect information (EVPI), which may be estimated for the model as a whole or for specific parameters or sets of parameters (expected value of partial perfect information [EVPPI]).
Further adding to the confusion between first- and second-order (parameter) uncertainty is use of variabil-ity to refer to the former but also to differences in param-eter values across patients or patient subgroups. Heterogeneity refers to the extent to which between-patient variability can be explained by between-patients’ charac-teristics (e.g., age- and sex-specific mortality). Its rele-vance lies in the identification of subgroups for whom separate cost-effectiveness analyses should be under-taken. Such analyses may inform alternative decisions regarding the service provision to each subgroup or contribute to a weighted analysis of the aggregate group. An analogy is a simple regression model of the form
Y5Xb1e;
where an outcome variable Y depends on covariates X. The vector of coefficientsbrepresents the model parameters and is estimated with uncertainty repre-sented by the coefficients’ standard error from the fit-ted regression. The extent to which the predicfit-ted
Table 1 Uncertainty for Decision Modeling: Concepts and Terminology
Preferred Term Concept
Other Terms Sometimes Employed
Analogous Concept in Regression Stochastic uncertainty Random variability in outcomes
between identical patients
Variability; Monte Carlo error; first-order uncertainty
Error term Parameter uncertainty The uncertainty in estimation
of the parameter of interest
Second-order uncertainty Standard error of the estimate Heterogeneity The variability between patients
that can be attributed to characteristics of those patients
Variability; observed or explained heterogeneity
Beta coefficients (or the extent to which the dependent variable varies by patient characteristics)
Structural uncertainty The assumptions inherent in the decision model
Model uncertainty The form of the regression model (e.g., linear, log-linear, etc.)
values (Y) vary with known covariates X represents heterogeneity, and the stochastic error terme repre-sents unexplained variability, which we call stochas-tic uncertainty.
Just as a linear regression imposes a structural rela-tionship between independent and dependent varia-bles, so a decision-analytic model is characterized by assumptions reflected in its structure but not formally expressed numerically (e.g., types of adverse events included, duration of treatment effects, time depen-dency of probabilities, and prognostic implications of surrogate endpoints or clinical events). Although these structural assumptions are not typically formally quan-tified, it is uncertain whether they express reality accu-rately. As such, and analogously with statistical modeling, any representation of uncertainty in a deci-sion model is conditional on its structural assumptions. Therefore, in principle, the structural characteristics are a further level of uncertainty to be considered.
Although a model’s overall structure results from many assumptions and analytic decisions, it is useful to distinguish 2 broad categories of models that reflect both the underlying structure and relate to the uncer-tainty concepts outlined above. Patient-level stochas-tic simulations (e.g., discrete-event simulations3and state-transition microsimulations2) are structured around events occurring at the individual level and requiring simulation of numerous virtual patients. For these models, assessment of parameter uncer-tainty requires elimination of stochastic unceruncer-tainty (sometimes called Monte Carlo error). In cohort mod-els, parameter uncertainty can be addressed without concern for stochastic uncertainty.
Methodological uncertainty has been identified as a specific type8,9that can be as important as parame-ter uncertainty.10 In common with others,9,11 we think a reference case should be applied. Neverthe-less, disagreement about appropriate methodology may be a reason to undertake sensitivity analysis.
Best Practices
VI-3 Terminology to describe concepts relating to parameter estimation and representation of uncer-tainty varies within the health care decision-modeling field and in comparison to related fields. Authors should be aware of this and seek to carefully define their use of terminology to avoid potential confusion. PARAMETER ESTIMATION AND UNCERTAINTY ANALYSIS
All models have parameters that must be estimated. In doing so, analysts should conform to
evidence-based medicine principles (e.g., seek to incorporate all evidence, rather than selectively picking a single source; use best-practice methods to avoid potential biases, as when estimating treatment effectiveness from observational sources; employ formal evidence synthesis techniques12,13). Uncertainty analysis is equally integral: The steps taken to estimate a parame-ter link directly with those necessary to conduct uncertainty analysis. Standard statistical methods for estimation generate a point estimate together with some measure of precision, such as standard errors or 95% confidence intervals. This is true whether these methods are implemented within a uni- or mul-tivariable framework, although the latter will also pro-vide a measure of covariance between estimated parameters. Consequently, whether primary data sour-ces are used to estimate input parameters or informa-tion derives from one or more secondary source, the estimation generates a point estimate, a measure of precision, and, potentially, one of covariance. These types of information from estimation should feed directly into the uncertainty analysis.
This is true whatever the uncertainty analysis’s technical specification. For a 1-way DSA, it is neces-sary to specify the parameter’s point estimate and a defensible range; these may be taken directly from the estimation process, with the latter based, for example, on a 95% confidence interval. A 2-way uncertainty analysis will be more useful if informed by the covariance between the 2 parameters of inter-est or on the logical relationship between them (e.g., a 2-way uncertainty analysis might be represented by the control intervention event rate and the hazard ratio with the new treatment).
Representation of uncertainty depends on the uncertainty analysis planned. For DSA, an interval estimate representing beliefs about the parameter’s plausible range is required. For PSA, a distribution is specified via its parameters.
Best Practices
VI-4All decision models have parameters that need to be estimated. Populating models with parameter estimates should conform to evidence-based medi-cine principles.
Consistency of Approach between Deterministic and Probabilistic Uncertainty Analysis
Uncertainty estimates for parameters estimated (or estimable) from data should be consistent with standard statistical approaches. The underlying distributional
assumption used to calculate the 95% confidence inter-val can be the basis for an uncertainty analysis distribu-tional assumption. One exception is when taking a formal Bayesian approach involving subjective prior information, where the standard distributional assump-tion relates to the data likelihood combined with the prior information to form the posterior density. In this case, consistency between DSA and the fully Bayesian probabilistic approach would be retained if the DSA interval estimate were based on the Bayesian posterior’s 95% highest density region.14
Some uncertainty analyses do not require formal ascertainment of parameter uncertainty. These include threshold analysis, in which the parameter’s value needed to change the decision is identified. This is closely linked to ‘‘even if’’ approaches, which identify extreme parameter values that still do not change the decision—with the implication that these parameters are unlikely to influence the decision. Such analyses may be sufficient if there is little decision uncertainty given reasonable assumptions about param-eter uncertainty. Another form not requiring uncertainty estimation is identification of the quantitative relation-ships between inputs and outputs (e.g., it might be deter-mined that a 10% increase in a particular parameter’s value leads to a 20% increase in expected effectiveness and 5% decrease in expected cost). This sort of analysis is unlikely to be sufficient because a parameter with low sensitivity, but highly uncertain, could easily have more impact on the model outputs than a more sensitive parameter but estimated more precisely. Therefore, completely arbitrary analyses, such as the effect on out-puts of varying each input by650%, is not recommen-ded as a representation of uncertainty.
Best Practices
VI-5 Whether employing deterministic methods (point estimate and range) or probabilistic methods (parameterized distribution), the link to the underly-ing evidence base should be clear.
VI-6Although completely arbitrary analyses, such as presentation of the effect on outputs of varying inputs by650%, can be used as a measure of sensitivity, such analyses should not be used to represent uncertainty.
Estimation and Choice of Distribution for PSA and Interval Estimation
If there is much information available to inform a parameter’s estimate, then by the central limit
theorem—the sampling distribution of the arithme-tic mean will follow a normal distribution (with suffi-cient sample size), whatever the data’s underlying distribution—then the normal distribution can be used in a PSA and a standard confidence interval in a DSA. Consistency between each form of uncertainty estimate is maintained because the arithmetic mean and standard error inform both the parameters of the distribution and the confidence interval calculation. Nevertheless, the reality of multiple data sources sug-gests that reliance on a single study is likely to underes-timate uncertainty. This suggests a broader uncertainty analysis than based on study data alone, leaving open some subjective assessment for ensuring appropriate representation of uncertainty, even where single large studies are available for estimating parameters and their associated uncertainty.
The general principle remains that assumptions for specifying the distribution and/or defining the interval for uncertainty analysis should follow stan-dard statistical methods (e.g., beta distributions are a natural match for binomial data; gamma or log nor-mal for right skew parameters; log nornor-mal for relative risks or hazard ratios; logistic for odds ratios15). These distributions can be used directly in PSA or to define the interval (plausible range) for a DSA.
Sometimes there is very little information on a parameter because either there are very few studies informing the estimation or there are no data and expert opinion must be relied on. Here, it is impera-tive that uncertainty related to such estimates be fully explored. A conservative approach should be adop-ted with an appropriately broad range of possible esti-mates elicited from each expert, reflected in how opinions are combined across experts and incorpo-rated into the uncertainty analysis. On no account should parameters be excluded from an uncertainty analysis on the grounds that ‘‘there is not enough information to estimate uncertainty.’’ Continuous distributions providing a realistic portrayal of uncer-tainty over the parameter’s theoretical range should be favored in PSA. Hence, careful consideration should be given to whether convenient-to-fit, but implausible, distributions (e.g., uniform or triangu-lar) should have any role in PSA. Formal methods for eliciting probability distributions from experts have been developed.16
Best Practices
VI-7Use commonly adopted statistical standards for point and interval estimation (e.g., 95% confidence intervals or distributions based on agreed statistical methods for a given estimation problem). Where
departures from these standards are deemed neces-sary (or no such standard exists), these should be jus-tified.
VI-8Where there is very little information on a param-eter, adopt a conservative approach such that the absence of evidence is reflected in a very broad range of possible estimates. Never exclude parameters from uncertainty analysis on the grounds that there is insuf-ficient information to estimate uncertainty.
VI-9Favor continuous distributions that portray uncer-tainty realistically over the theoretical range of the parameter. Careful consideration should be given to whether convenient-to-fit but implausible distributions (such as the triangular) should have a role in PSA.
MULTIVARIATE ESTIMATION AND CORRELATION
When regression is used to capture the effect of subject characteristics on parameter estimates, the dependent variable is a functional parameter of the regression coefficients. Therefore, uncertainty in the functional parameter can be defined in terms of uncertainty (and correlation) in the coefficients. The covariance matrix defines these uncertainties, and the assumption of multivariate normality is appropriate for the regression’s linear predictor. These can be used to specify the interval for DSA or as the basis for PSA.15
In PSA, parameters are typically not all indepen-dent of one another. For example, if 2 uncertain parameters are disease progression probabilities with and without treatment, part of the uncertainty may derive from doubts regarding the disease’s natural his-tory and part from imprecise measurement of treat-ment efficacy. The component related to natural history would affect the progression probabilities with or without treatment, whereas the component related to efficacy would affect the relationship (e.g., relative risk) between progression probabilities with and without treatment. It would be wrong to regard the progression probabilities as coming from indepen-dent distributions and conduct the PSA accordingly. It might be reasonable, however, to regard the natural history progression probability and the risk reduction with treatment as independent. Parameter distribu-tions in this situation should be defined in a way that makes it plausible that they are independent. In this example, the baseline progression probability and the relative risk reduction would be assigned
distributions in the PSA, with the on-treatment pro-gression probability derived as their product. Where this application of relative risks can result in out-of-range parameters, consider switching to odds ratios. Although this method of defining parameters in a way that induces mutual independence offers a prac-tical and sufficient approach in many situations, more sophisticated methods that explicitly quantify joint distributions of correlated parameters may also be considered.15
Best Practices
VI-10Correlation among parameters should be consid-ered. Jointly estimated parameters, such as those from a regression analysis, will have direct evidence on cor-relation, which should be reflected in the analysis. Independently estimated parameters will have no such evidence, but this should not necessarily lead to an assumption of independence. Possible approaches are to include a correlation coefficient as a parameter where concern exists that an unknown correlation could be important or to reparameterize the model so that that the uncertain parameters can be reasonably assumed to be independent.
CALIBRATION METHODS AND STRUCTURAL UNCERTAINTY
There is emerging interest in calibration meth-ods that combine knowledge over parameter inputs, structure, and outputs (or calibration tar-gets) to assist in ensuring consistency of inputs and outputs. Common calibration targets include overall and disease-specific mortality and event incidence rates.
Bayesian (or multiparameter) evidence synthesis is a calibration approach developed in health technology assessment using Markov chain Monte Carlo (MCMC)
via freely available WinBUGS software.13 This
approach involves specification of a structure com-prising inputs and parameters that are functions of multiple inputs, for which an external data source exists.17The MCMC estimates a joint set of posterior distributions for the input parameters, based on the functional parameters: likelihood. Most applied exam-ples of this approach have involved relatively simple structures. For more complex models, standard cali-bration approaches can be applied to identify the best fitting set of inputs, or multiple sets of values, which can then form the basis for uncertainty analy-sis.18–21Steps in calibration include identifying cali-bration targets, selecting individual and aggregated
measures of goodness-of-fit (GoF), defining the param-eter space, selecting a search strategy, defining conver-gence thresholds, and specifying a stopping rule.22
The use of calibration to estimate parameters or adjust estimated values emphasizes the important role model structure plays in defining the relation-ship between inputs and outputs. Structural uncer-tainty is frequently ignored, although it may have a much greater impact on results than parameter uncertainty.10 Recent approaches to this issue have sought to parameterize structural uncertain-ties into the model.23-25 This is trivial for nested structures (e.g., a constant hazard function could be replaced by a more flexible function) but is much more challenging for nonnested structures, which could require complete redesign/rebuilding of the model. Although it may be feasible to inter-nalize structural uncertainty by adding parameters to the model, any given research team will be lim-ited in the extent to which they can fully incorpo-rate this form of uncertainty. In such situations, analysts are encouraged to be as explicit as possible regarding the structural assumptions that might have an impact on the findings and suggest alterna-tive assumptions that future modeling exercises might employ.
Best Practices
VI-11Where uncertainties in structural assumptions were identified in the process of conceptualizing and building a model, those should be tested in uncer-tainty analysis. Consideration should be given to opportunities to parameterize these uncertainties for ease of testing. Where it is impossible to perform structural uncertainty analysis, it is important to be aware that this uncertainty may be at least as impor-tant as parameter uncertainty.
REPORTING UNCERTAINTY ANALYSES
Often, it is appropriate to report aspects of both DSA and PSA (e.g., may report deterministic thresh-old analysis for key parameters and PSA to convey overall uncertainty). The guiding principle is that the reporting method should be tailored to guide the decision at issue.
When additional assumptions or parameter values are introduced for purposes of uncertainty analysis (e.g., distribution parameters for PSA, parameter ranges for DSA), these should be disclosed and justi-fied. Technical appendices are often appropriate for this purpose. When calibration is used to derive
parameters, uncertainty around the calibrated values should be reported, and this uncertainty should be reflected in DSA, PSA, or both.
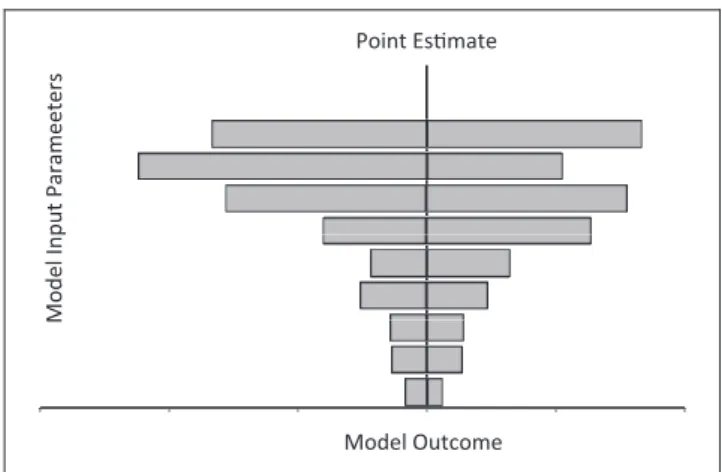
Reporting Deterministic Sensitivity Analysis (DSA) Many methods may be used to convey how results depend on individual parameters, multiple parame-ters jointly, or model structure. One-way DSA may be reported using a tornado diagram (Figure 1). The horizontal axis is the outcome; along the vertical axis, parameters are arrayed and horizontal bars rep-resent the outcome range associated with the speci-fied parameter’s range. The outcome point estimate corresponding to base-case values is indicated by a vertical line cutting through all horizontal bars. Commonly, the longest bar (reflecting the parameter generating the widest uncertainty) is placed at the top, and the other bars are arrayed in descending order of length. A tornado diagram should be accom-panied by a legend or table indicating the upper and lower bounds of values for each parameter, with their justification in terms of the evidence base. A table may be used instead of a tornado diagram or the results ranges provide in the text of the report (e.g., the text might state that ‘‘the outcome ranged from X to Y when parameter Z was varied from A to B’’). It is important that the range A to B represents a defen-sible range for parameter Z, not an arbitrary one.
Often, uncertainty in a parameter may be repre-sented by several discrete values, instead of a contin-uous range, sometimes called scenario analyses (e.g., evidence from clinical studies, utility surveys, or cost data sets may lead to different values). It is acceptable to report alternative outcomes under each of these
Point Esmate
Model Input Parameeters
Model Outcome
Figure 1 Tornado diagram showing impact of uncertainty on the outcome of a decision model
discrete assumptions to complement other uncer-tainty analysis.
Structural uncertainty may be represented deter-ministically by reporting results under each set of structural assumptions. Quantitative uncertainty analysis may be embedded within structural uncer-tainty analysis by reporting them separately under each structural assumption.
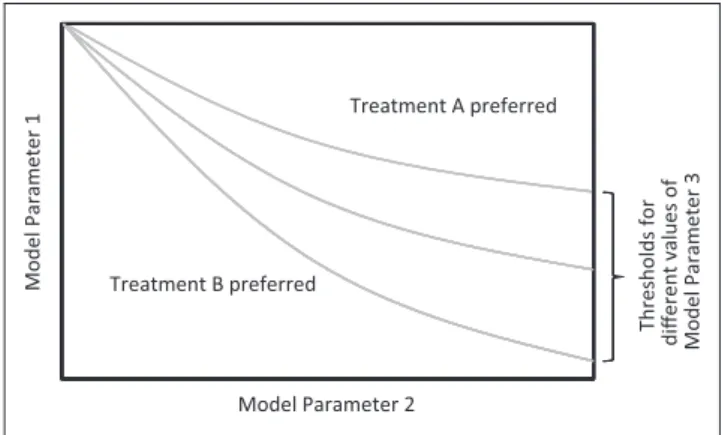
In presenting 1-way uncertainty analysis, reporting negative incremental cost-effectiveness ratios (ICERs) should be avoided as they are meaningless.26,27Instead, the ICER range should be limited to results correspond-ing to positive incremental health consequences and costs—quadrant I in the cost-effectiveness plane. Results for which incremental costs are positive and health consequences negative should be indicated qualitatively as ‘‘dominated’’ and those with negative incremental costs and positive health consequences as ‘‘dominant.’’ ICERs corresponding to negative incre-mental costs and health consequences—quadrant III—should be distinguished from ICERs in quadrant I. Results of 1-way threshold analyses are easily reported in text (e.g., ‘‘The ICER remains less than Y as long as the value of X is greater than A,’’ or ‘‘Alter-native 1 dominates 2 if the value of Z is less than B’’). Results of 2- and multiway uncertainty analysis require graphical or tabular displays (Figure 2). The axes represent possible values, and the quadrant is partitioned into regions corresponding to various ICERs, the boundaries representing specified ICER thresholds, or thresholds of dominance. As in 1-way analyses, it is important to specify which alterna-tive dominates and which comparator is more effec-tive and costly when an ICER threshold is indicated. Three-way threshold analyses may be superimposed on 2-way graphs by overlaying thresh-old curves (Figure 3), but this often leads to visual
overload and confusion and will work only if the third parameter can be represented as taking on dis-crete values.
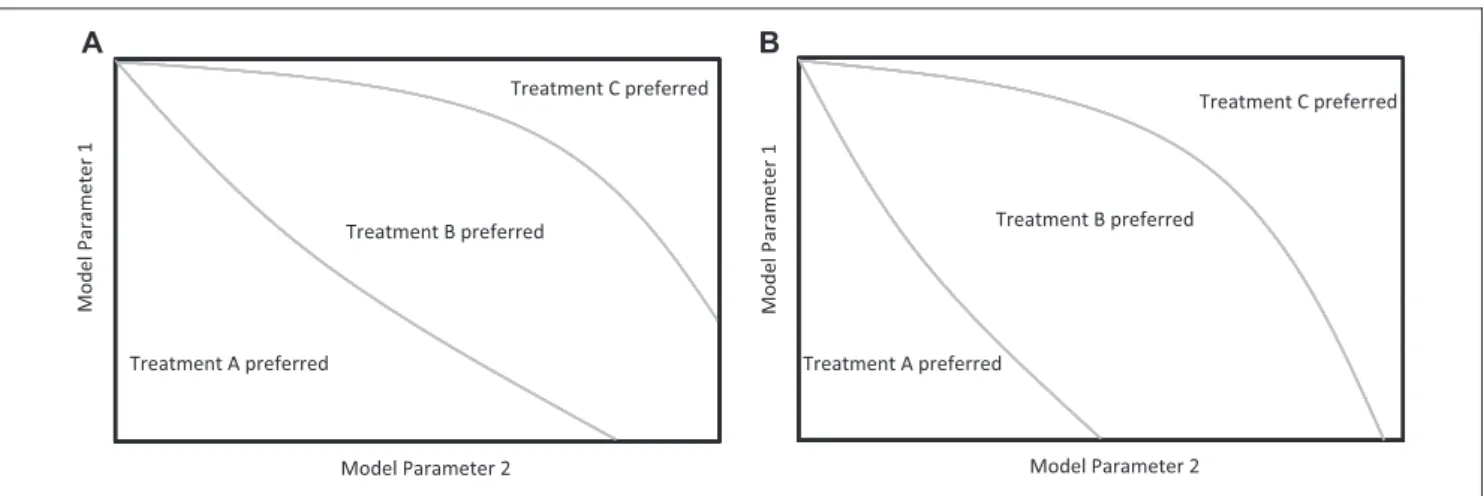
Threshold analyses are especially useful, perhaps necessary, when reporting DSA involving 3 or more comparators. In those situations, the relevant question may be, ‘‘Which alternative is cost-effective at a threshold of X?’’ To portray the answer for 2 parameters, partition the quadrant to show which alternative is cost-effective at various ICER thresholds and for different combina-tions of parameters (Figures 4A and 4B). Results for dif-ferent decision criteria (e.g., ICER thresholds or dominance) are best presented in separate panels of a graphical display.
When the base-case result of an analysis strongly favors one alternative, a threshold analysis may be pre-sented as a worst-case or ‘‘even if’’ analysis (e.g., ‘‘Even if the risk reduction is as low as X, the ICER remains below Y,’’ or ‘‘Even if the relative risk reduction with alternative A is as low as X and the cost of treatment is as high as Y, alternative A dominates B’’). Threshold values can easily be combined with the tornado pre-sentation by marking them on the horizontal bars. Reporting Probabilistic Sensitivity Analysis (PSA)
When reporting a PSA, the specific distribution (e.g., beta, normal, log-normal) as well as its parame-ters should be disclosed. Sometimes it is feasible to incorporate this information into the table listing model parameters. If not, a table detailing the distri-butions may be included in a technical appendix. Jus-tification for the distributions chosen should be provided. This may be directly from empiric data, a full Bayesian evidence synthesis, or subjective. As personal judgments need not correspond to the deci-sion makers’ perceptions, alternative specifications
Treatment A preferred
Model Parameter 1
Model Parameter 2 Treatment B preferred
Figure 2 Two-way threshold analysis.
Treatment A preferred
Model Parameter 1
Model Parameter 2 Treatment B preferred
Thresholds for
different values of Model Parameter 3
and parameters should be provided so users can select the distributions most closely reflecting their own judgments. A rule of reason applies in this regard: Parameters that exert little leverage on the overall uncertainty can be left as subjective.
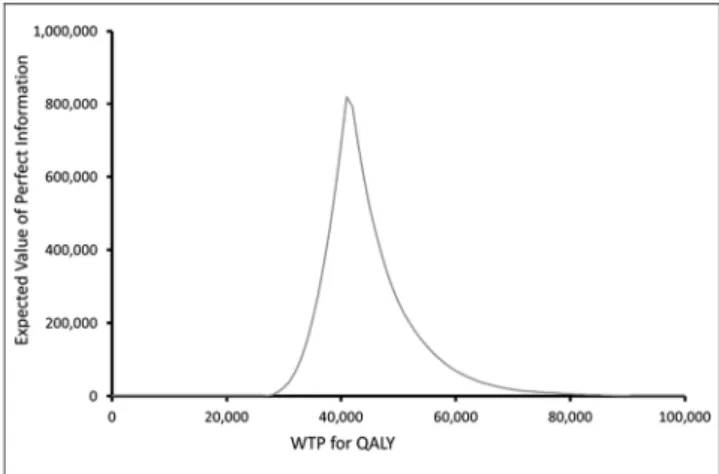
Perhaps the best measure of uncertainty surround-ing a particular decision in cost-effectiveness analy-sis is the EVPI because this measure combines the probability of incorrect decision making with the consequential loss function.28The higher the EVPI, the larger the opportunity cost of an incorrect sion viewed at the point at which the uncertain deci-sion is being made (i.e., the more costly is the uncertainty). Total EVPI is commonly reported in monetary terms, using net monetary benefit (an alter-native is to express EVPI using net health benefit). Because both net monetary and net health benefit depend on the ICER threshold, EVPI should be reported for specified ICER threshold(s) or in graphi-cal form as a function of ICER thresholds (Fig 5).
EVPPI can be estimated to identify key parameters and should be reported as for EVPI. Because of the likely correlation between individual parameters in EVPPI, it may be preferable to report values for groups of parame-ters, which might also be the focus of future research efforts.29,30Expected value of sample information analy-ses31 should be reported similarly but with the addi-tional proviso that the factors governing the assumed study from which sample information is obtained (e.g., sample size, individual-level or patient-level variation in outcomes) must also be specified.
When a PSA is performed without an accompany-ing value-of-information analysis, options for present-ing results include cost-effectiveness acceptability
curves (CEACs) and distributions of net monetary ben-efit or net health benben-efit. When more than 2 interven-tions are involved, CEACs for each should be plotted on the same graph (Figure 6), with or without inclu-sion of a cost-effectiveness acceptability frontier. Reporting Uncertainty owing to Calibrated Parameters
When model calibration is used to estimate param-eters not directly observable from data, uncertainty owing to the calibration process should be reported. As for other model parameters, such reporting may be either deterministic or probabilistic. Deterministic reporting involves presentation of the range of cali-brated input parameter values across the convergent parameter sets and the resulting range of outputs (e.g., ICERs). The results may be reported as discrete point estimates or as a range.
Probabilistic calibration-related uncertainty can be reported in many ways. If a formal Bayesian approach to calibration is used, then the posterior distributions of the calibrated parameters should be reported. If a less formal approach to calibration is used, then a dis-crete joint distribution of parameter estimates can be generated based on all convergent input parameter sets. The discrete distribution may assign equal proba-bility to each resulting parameter value set, or probabil-ity weights may be applied that reflect the relative GoF of the component parameter sets.
Analogous to the reporting of structural uncer-tainty, the results of separate calibration analyses using alternative methodological approaches should be reported under each discrete calibration process. Treatment C preferred Treatment B preferred Model Parameter 1 Model Parameter 2 Treatment A preferred Model Parameter 1 Model Parameter 2 Treatment A preferred Treatment B preferred Treatment C preferred A B
Figure 4 Two-way threshold graph with 3 or more comparators. (A) Two-way SA for 3 treatments at $50,000 WTP for a QALY. (B) Two-way SA for 3 treatments at $100,000 WTP for a QALY.
Alternative approaches may include the objective function used for evaluating GoF, the computational process or algorithm used to identify convergent parameter sets, and the importance weights attached to different calibration targets.
Best Practices
VI-12It is appropriate to report both deterministic and probabilistic uncertainty analyses within a single evaluation. Tornado diagrams, threshold plots, or simple statements of threshold parameter values are all appropriate ways of reporting results from deter-ministic sensitivity analyses.
VI-13When additional assumptions or parameter val-ues are introduced for purposes of uncertainty analyses, these values should be disclosed and justified.
VI-14 When model calibration is used to derive parameters, uncertainty around the calibrated values should be reported and reflected in deterministic or probabilistic sensitivity analyses or both.
VI-15When the purpose of a PSA is to guide deci-sions about acquisition of information to reduce uncertainty, results should be presented in terms of expected value of information.
VI-17 For economic studies, when a PSA is per-formed without an accompanying expected value of information analysis, options for presenting results include CEACs and distributions of net monetary benefit or net health benefit. When more than 2 com-parators are involved, curves for each comparator should be plotted on the same graph.
REFERENCES
1. Caro JJ, Briggs AH, Siebert U, Kuntz KM. Modeling good research practices—overview: a report of the ISPOR-SMDM Mod-eling Good Research Practices Task Force-1. Med Decis Making. 2012;32(5):667–677.
2. Roberts M, Russell LB, Paltiel AD, Chambers M, McEwan P, Krahn M. Conceptualizing a model: a report of the ISPOR-SMDM Modeling Good Research Practices Task Force-2. Med Decis Mak-ing. 2012;32(5):678–689.
3. Siebert U, Alagoz O, Bayoumi AM, et al. State-transition model-ing: a report of the ISPOR-SMDM Modeling Good Research Practi-ces Task Force-3. Med Decis Making. 2012;32(5):690–700. 4. Karnon J, Stahl J, Brennan A, Caro JJ, Mar J, Mo¨ller J. Modeling using discrete event simulation: a report of the ISPOR-SMDM Modeling Good Research Practices Task Force–4. Med Decis Mak-ing. 2012;32(5):701–711.
5. Pitman R, Fisman D, Zaric GS, et al. Dynamic transmission modeling: a report of the ISPOR-SMDM Modeling Good Research Practices Task Force Working Group–5. Med Decis Making. 2012;32(5):712–721.
6. Eddy DM, Hollingworth W, Caro JJ, Tsevat J, McDonald KM, Wong JB. Model transparency and validation: a report of the ISPOR-SMDM Modeling Good Research Practices Task Force–7. Med Decis Making. 2012;32(5):733–743.
7. Claxton K. Exploring uncertainty in cost-effectiveness analysis. Pharmacoeconomics. 2008;26:781–98.
8. Briggs A, Sculpher M, Buxton MJ. Uncertainty in the economic evaluation of health care technologies: the role of sensitivity anal-ysis. Health Econ. 1994;3:95–104.
9. Gold MR, Siegel JE, Russell LB, Weinstein MC. Cost-effectiveness in Health and Medicine. New York: Oxford University Press; 2007. 10. Brisson M, Edmunds WJ. Impact of model, methodological, and parameter uncertainty in the economic analysis of vaccination programs. Med Decis Making. 2006;26:434–46.
11. National Institute for Health and Clinical Excellence. Guide to the Methods of Technology Appraisal. London: NICE; 2008.
Figure 5 Expected value of perfect information as a function of the cost–per–quality-adjusted life-year threshold.
350 1.00 300 0.80 0.90 Treatment A Treatment B Treatment C 200 250 0.60 0.70 EVPI 150 0.40 0.50 Per-pateint EVPI 50 100 0.20 0.30 Probability cost-effecve 0 0.00 0.10 WTP for QALY 100,000 80,000 90,000 70,000 60,000 50,000 40,000 30,000 20,000 10,000 0
Figure 6 Cost-effectiveness acceptability curves with 3 or more treatment strategies.
Available from: URL: www.nice.org.uk/media/B52/A7/ TAMe-thodsGuideUpdatedJune2008.pdf. Accessed 1 December 2012. 12. Lumley T. Network meta-analysis for indirect treatment com-parisons. Stat Med. 2002;21:2313–24.
13. Everitt BS. The Cambridge Dictionary of Statistics. Cambridge, UK: Cambridge University Press; 1998.
14. Briggs AH, Sculpher MJ, Claxton K. Decision Modelling for Health Economic Evaluation. Oxford, UK: Oxford University Press; 2006.
15. O’Hagan A, Buck CE, Daneshkhah A, et al. Uncertain Judge-ments: Eliciting Expert Probabilities. Chichester, UK: John Wiley and Sons; 2006.
16. Lunn D, Spiegelhalter D, Thomas A, Best N. The BUGS project: evolution, critique and future directions. Stat Med. 2009;28: 3049–67.
17. Ades AE, Cliffe S. Markov chain Monte Carlo estimation of a multiparameter decision model: consistency of evidence and the accurate assessment of uncertainty. Med Decis Making. 2002; 22:359–71.
18. Karnon J, Czoski Murray C, Smith KJ, Brand C. A hybrid cohort individual sampling natural history model of age-related macular degeneration: assessing the cost-effectiveness of screening using probabilistic calibration, Med Decis Making. 2009;29:304–16. 19. Karnon J, Vanni T. Calibrating models in economic evaluation: a comparison of alternative measures of goodness-of-fit, parameter search strategies, and convergence criteria. Pharmacoeconomics. 2011;29:51–62.
20. Kim JJ, Kuntz KM, Stout NK, et al. Multiparameter calibration of a natural history model of cervical cancer. Am J Epidemiol. 2007; 166:137–50.
21. Taylor DCA, Pawar V, Kruzikas DT, et al. Incorporating cali-brated model parameters into sensitivity analyses deterministic and probabilistic approaches. Pharmacoeconomics. 2012;30:119–26. 22. Vanni T, Karnon J, Madan J, et al. Calibrating models in economic evaluation: a seven step approach. Pharmacoeconomics. 2011;29:35–49. 23. Bojke L, Claxton K, Sculpher M, Palmer S. Characterizing structural uncertainty in decision analytic models: a review and application of methods. Value Health. 2009;12:739–49.
24. Chapman CH, Thompson SG, Sharples LD. Accounting for uncertainty in health economic decision models by using model averaging. J R Stat Soc Ser A Stat Soc. 2009;172(2):383–404. 25. Jackson CH, Bojke L, Thompson SG, et al. A framework for addressing structural uncertainty in decision models. Med Decis Making. 2011;31:662–74.
26. Briggs A, Fenn P. Confidence intervals or surfaces? Uncer-tainty on the cost-effectiveness plane. Health Econ. 1998;7:723–40. 27. Stinnett AA, Mullahy J. The negative side of cost-effectiveness analysis (letter). JAMA. 1997;277:1931–2.
28. Claxton K, Sculpher M, Drummond M. A rational framework for decision making by the National Institute for Clinical Excel-lence (NICE). Lancet. 2002;360:711–15.
29. Brennan A, Kharroubi S, O’Hagan A, et al. Calculating partial expected value of perfect information via Monte Carlo sampling algorithms. Med Decis Making. 2007;27:448–70.
30. Groot KoerkampB, Hunink MG, Stijnen T, Weinstein MC. Iden-tifying key parameters in cost-effectiveness analysis using value of information: a comparison of methods. Health Econ. 2006;4:383–92. 31. Ades AE, Lu G, Claxton K. Expected value of sample informa-tion calculainforma-tions in medical decision modeling. Med Decis Mak-ing. 2004;24:207–27.