An Implementation of Wireless Sensor Network
Using Voronoi_PSO (Particle Swarm Optimization)
Harjeet Kaur1, Dr. Sandeep Kautish2 Guru Kashi University, Talwandi Sabo
Abstract :Today’s increasing area of research is Wireless Sensor Network (WSN).Correct placement of nodes is one of the major challenge in Wireless Sensor Network One of the most active research fields in wireless sensor networks is that of coverage. . Coverage is usually explained as how well a sensor network will monitor a field of interest. In the research work we are using a strategy known as VORONOI_PSO (Particle Swarm Optimization) to solve the coverage problem. VORONOI DIAGRAM is the basically a deployment strategy. In this deployment strategy area is covered by using VORONOI Diagram which contains VORONOI polygon which is often known as VORONOI cell. Each VORONOI cell contains one sensor node in it. VORONOI DIAGRAM is the node deployment technique which is used to cover irregular areas. A new methodology has been designed to overcome the problem of VORONOI by using the PARTICLE SWARM OPTIMISATION (PSO) technique. The Optimization algorithms are search approaches which are carried out to search an optimal solution to a problem, in order to fulfill objectives. In this the coverage problem gets improved by finding the optimal coverage depending on optimal placement of nodes which improve the overall output.
Keywords: WSN, Coverage, PSO, VORONOI, VORONOI_PSO.
I.INTRODUCTION
Due to a recent development in the technology, there is a growth in wireless sensor network which is composed of large figure of homogeneous & heterogeneous sensor nodes which operates in wireless fashion to achieve common objective. Homogeneous nodes are oftenly used over heterogeneous nodes because of less complexity and better manageability. Within its radio communication range, each sensor nodes communicates with another nodes.
Sensor: Sensor is a transducer. It converts physical phenomenon e.g. light, heat, vibration,motion, and sound into electrical signals. Sensor Network: Sensor network consists of a large number of sensor nodes and nodes deployed either inside or very close to the sensed phenomenon. Sensor Nodes (motes): Sensor nodes are battery operated nodes with limited computing and processing capabilities. Sensor nodes with limited energy can sense their own residual energy and have the same architecture; Sensor nodes works together to form a network for monitoring the target region. Through the co-operation of sensor nodes, the Wireless Sensor Networks collect and send various kinds of message about the monitored environment (e.g. temperature, humidity, etc.) to the sink (base) node, which processes the information and reports it to the user
and always have data to send to the Base Station.
II. COVERAGE PROBLEM
Coverage problem is caused by three main reasons: not enough sensors to cover the whole Region of Interest (ROI) , limited sensing range and random deployment. As sensors are operated using confined power supply some of them die out resulting in inadequate sensors to fully cover the Region Of Interest .A sensor’s sensing range is restricted to a certain radius due to which sensor cannot cover the region outside its sensing range which results to the coverage problem.[1]
Coverage can be classified into three categories:, Area coverage, Point Coverage and Barrier Coverage.
A. Area Coverage
The most critical problem in area coverage is the coverage kind of an area by the sensors. The main objective of area coverage in Wireless Sensor Networks is to cover an area (also referred sometimes as region)at each point in the region need to be monitored by at least one sensor and also to direct the environment completely.
In area coverage the best coverage takes place when the main focused area is covered by the least number of the sensors completely. Area coverage is often used for the areas in which the probability of events exists in all coordinates. Also the existence of the inessential sensors in this model cause the multi coverage which lead to the high density of the network.[1].
B. Point Coverage
It is a sub group of the area coverage method. Point coverage is when the total area is not covered by the sensors but just some points are covered . In point coverage only the points which are applicative are covered. Medium numbers of the sensors are spread around the goals and then are activated according to specific scheduling in relation to specific responsibilities and send the collective information to the Base Station. In this the main objective is to cover a set of points (target) with known location that need to be monitored and identified by some specific points which must be controlled are considered. The target coverage strategy is centered on verifying the exact locations of sensor nodes which guarantees efficient coverage approach for a limited number of targets.
C. Barrier (path) coverage
In barrier coverage total area is not covered by the sensors. This model is appropriate for penetration diagnosis applications. The coverage operations take place in such a manner that if the penetration takes place from the width of the under coverage area, the sensors must diagnose them .In barrier coverage the main goal is to maximize or minimize the probability of undetected penetration through the region (sensor network).
III. TECHNIQUES OR METHODS
Strategies used in solving coverage problem in Wireless Sensor Networks are analyzed during deployment of nodes. The strategies are classified into three categories these are: grid based, force based and computational geometry based.
A. Force Based
Force based deployment strategies depends on the sensors mobility, using attractive and virtual repulsive forces the sensors are force to move away or towards each other so that full coverage is attained. The sensors will keep moving until equilibrium state is gained; where attractive and repulsive forces are equal thus they end up cancelling each other.
B. Computational geometry
the triangle (p1, p2, x) as depicted
C. Grid points
They are used in Wireless Sensor Networks deployment in two ways: either to determine sensor positions or to measure coverage. In Grid based sensor networks Region Of Interest is divided into square grids and the sensors can only be placed at the center of the square. The cost of grid based deployment is determined by number of grid points, name and amount of sensors deployed. There are commonly three types of grids used in networking to achieve the maximum coverage these are:
1) square grid
2) triangular lattice
3) hexagonal grid
One of the best kinds of the grid among three kinds of grid is Triangular lattice since it has the smallest overlapping area and hence the grid requires the least number of sensors.
IV. SWARM INTELLIGENCE
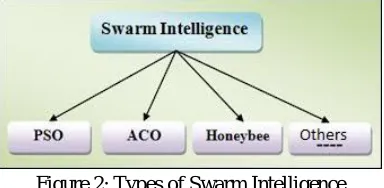
[image:4.612.211.403.440.534.2]A swarm is a large number of homogenous, simple agents interacting locally among themselves, and their environment with no central control to allow a global interesting behavior to emerge. Swarm-based algorithms have recently emerged as a family of nature-inspired, population-based algorithms that are capable of producing low cost, at fast rate, and robust solutions to several complex problems. Swarm Intelligence (SI) can therefore be defined as a relatively new branch of Artificial Intelligence that is used to model the collective behavior of social swarms in nature, such as ant colonies, honey bees, and bird flocks. Although these agents (insects or swarm individuals) are relatively unsophisticated with limited capabilities on their own, they are interacting together with certain behavioral patterns to cooperatively achieve tasks necessary for their survival. The social communications among swarm individuals can be either direct or indirect. Examples of direct interaction are through visual or audio contact, such as the air dance of honey bees. Indirect interaction takes place when one individual changes the environment and the other individuals respond to the new environment (new path), such as the pheromone trails of Ants that they deposit on their way to search for food sources. This type of indirect interaction is referred to as stigmergy technique, which means communication through the environment. The Area of research presented in this depth paper focuses on Swarm Intelligence. This paper discusses the most popular model of swarm intelligence inspired by ants’ pheromone behavior for solving travelling salesman problem.
Figure 2: Types of Swarm Intelligence
V. PARTICLE SWARM OPTIMIZATION
including its simplicity and easy implementation, the algorithm can be used widely in the fields such as function optimization, the model classification, machine study, neutral network training, the signal procession, vague system control, automatic adaptation control and etc.
Each particle in the swarm holds the following information: (i) the current position x , which represents a solution to the problem, (ii) the current velocity v , (iii) the best position, the one associated with the best objective function value the particle has achieved so far pbest , where this objective function value is calculated using a function f(.) that evaluates the desirability of a solution, and (iv) the neighborhood best position, the one associated with the best objective function value found in the particle’s neighborhood nbest . The choice of nbest depends on the neighborhood topology adopted by the swarm, different neighborhood topologies have been studied in this.
A. PSO parameters
Velocity, inertia weight, learning factor and the largest iterative number are initialized. Array of particles are initialized with random position and velocity vectors.
B. Find the distance of the interest point to its nearest sensor. Fitness is evaluated for every particle at its current position using Euclidian distance as:-
1) (x1,x2)2 – (y1-y2)2≤ r2
2) (x1,y1) (x2,y2) are the two points 3) sensing range r.
C. Minimize the fitness value; ideally the fitness value should be equal to zero, where the distance between the interests points with their nearest sensors are within the sensors’ sensing range. If the fitness of the particle is lesser than that of the best particle, then the particle would be the best particle for the next move, and the fitness of this particle is taken as best fitness.
D. Each particle is made to modify its current position, current velocity, the distance between current position and pibest, the distance between current position and pgbest.
E. If the next position of the particle is best, then the particle chooses a new position, otherwise, the same algorithm is continued.
F. This process is repeated in iterations, until all the particles communicate with each other and generate maximum coverage. [2]
VI. PROPOSED ALGORITHM
The proposed PSO algorithm involves the deployment of randomly uniform nodes. The area is divided into fixed radial zones and the PSO algorithm is initialized followed by the adjusting of velocity values. Using the fitness function, the fitness value is predicted as the selection process for old and new bats begin. If the set number of iterations is not reached, new sets of fitness values are predicted again using the fitness function. Otherwise the, Voroni divided zone is optimized. The algorithm stops after all parameters have been evaluated. This process is illustrated by the flowchart below:
The basic steps in performing this dissertation are:
Step 1:- There is random deployment of nodes in the required region of interest. Based on these nodes a network is formed in form of mesh topology.
Step 2:- Area is covered by using VORONOI Diagram containing polygon that is known as cell. Each cell contain one sensor node in it.VORONOI is the node deployment technique which is used to cover irregular areas.
Step 3:- Implement Particle Swarm Optimization
Step 4:- Calculate the fitness value for each of the eligible node. Fitness value is calculated by using fitness unction. Step 5:- It gives rate of change of distance and speed of a node.
Step 6:- Find the best solution. The best solution is based upon distance and position of a node.
Step 7:- Selection process gives the optimal solution for the search space and also define the feasible solution (which consist of the most optimal solution with less number of dead nodes).
Step 8:- Ignoring or eliminating all the non-feasible solution.
Step 9:- Dividing the entire area into different number of zones with respect to base station.
VII. RESULTS AND DISCUSSION
[image:6.612.174.438.110.341.2]FOR 250 NODES
Figure 3: Random deployment of 250 nodes
In this on MATLAB editor by applying simple coding we can place 250 random nodes anywhere which can be placed anywhere at any time by running it into command window we get the graphical representation in terms of x and y axes.
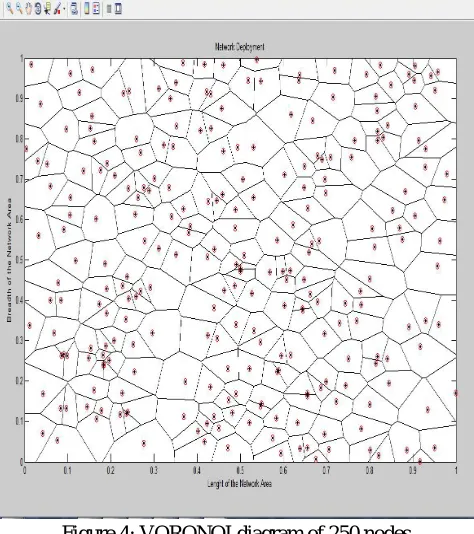
Figure 4: VORONOI diagram of 250 nodes
[image:6.612.188.425.391.658.2]Figure 5: PSO_VORONOI diagram of 250 nodes
The above results shows the optimized placement of nodes. In this Particle Swarm Optimization is applied on Voronoi diagram. Hence there is reallocation of nodes.
Figure 6: Bar graph of proposed and existing technology for 250 nodes
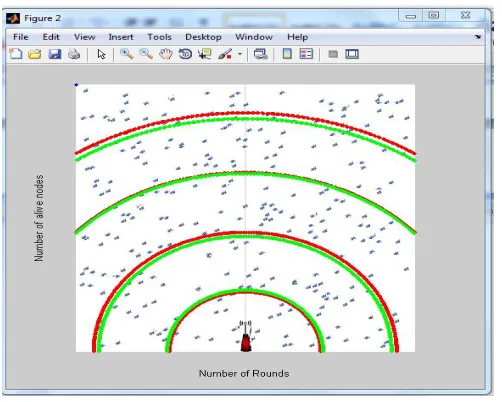
[image:7.612.173.440.426.656.2]Figure 7: Zone division of area
The entire region is divided into zone with respect to base station. The region which is closest to the base station contains maximum number of eligible nodes. Nodes which contain these two properties are called eligible nodes and from these eligible nodes cluster head is chosen. Eligible nodes are the nodes which can easily able to communicate with base station. And the nodes which could not communicate with base station are not eligible nodes and they are ignored.
AVERAGE COVERAGE
Figure 8: Comparison Of existing and Proposed Work for average coverage
The graph is plotted between coverage with PSO (along x-axis) versus number of nodes (along y-axis). Hence, from the graph we determine that average coverage area covered by proposed technology is better than existing technology.
VIII.CONCLUSION
[image:8.612.176.436.373.547.2]algorithm in terms of Average Coverage. In near future work can beextended and can be implemented on real time environment and also more tests for different conditions and optimizing other problems in Wireless Sensor Network.
REFERENCES
[1] JyotiYadav and Sandeep Man, “Target coverage in wireless sensor network:A review”, International Journal of Innovation Research and Studies(IJIRS),vol 2 issue 4,April 2013.
[2] NikithaKukunuruBabuRaoThella and Rajya Lakshmi Davuluri, “Sensor deployment using particle swarm optimization”, International Journal of Engineering Science and Technology(IJEST),vol 2(10),2010.
[3] AmitabhaGhosh and SajalK.Das. “Coverage and connectivity issue in wireless sensor network:A survey”,ELSEVIER,vol 303-334,2008.
[4] KiesukeKameyama, “Paricle swarm optimization”,Institute of Electronics and information communication Engineering(IEICE),vol E9-D,July2009.
[5] Nor Azlina An Aziz, “Wireless sensor networks coverage-energy algorithm based on particle swarm optimization”,Emirates Journal for Engineering Research(EJER),vol 41-52,2013.
[6] Qinghai Bai, “Analysis of particle swarm optimization algorithm”,Communication in Computer Science Engineering(CCSE),vol 3 no.1,Feburary 2010. [7] W.Z.Wan Ismail ansS.Abd.Manaf, “Study on coverage in wireless sensor network using grid based strategy and particle swarm optimization”,IEEE,vol
978,2010.
[8] Dian palupiRini,SitiMariyamShamsuddin and SitiSophiyatiYuhaniz, “Particle swarm optimization:Techniques System and challenges”, International Journal of Computer Application(IJCA) vol 14 no.1, january 2011.