Technology (IJRASET)
Quality Improvement of Plastic Timer-A Six
Sigma Approach
Neeldana Bakshi
Operations Management Department, HNIMR, Savitribai Phule Pune University, Pune, Maharashtra, India
Abstract-Quality has become one of the most important consumer decision factors in the selection among competing products and services. Quality means fitness for use and is inversely proportional to variability. Quality improvement is the reduction of variability in processes and products. Quality control and improvement involve the set of activities used to ensure that the products and services meet requirements and are improved on a continuous basis. Six Sigma provides an effective mechanism to focus on customer requirements, through improvement of process quality and seeks to improve the quality of the output of a process by identifying and removing the causes of defects and minimizing variability in manufacturing and business processes. The project describes the application of the Six Sigma methodologies by taking the example of a plastic timer as the product, and demonstrates the benefits attained. The objective of this paper is to understand how to reduce and control variation of a process and improve the quality and process capability of the timers by applying six sigma methodologies and determine the key factors for improvement opportunities. This paper also integrates the lessons learnt and suggests measures in order to increase the overall sigma capability of the timers.
Keywords— Six Sigma; Process Capability; DPMO; Performance Level; DMAIC; Quality Management
I. INTRODUCTION
The focus of six-sigma is reducing variability in key product quality characteristics to the level at which failure or defects are extremely unlikely. It is a method that provides organizations tools to improve the capability of their business processes. Each Six Sigma project carried out within an organization follows a defined sequence of steps and has specific value targets. Six Sigma provides an effective mechanism to focus on customer requirements, through improvement of process quality. There are many ways in which Six Sigma is defined or perceived.
A. 3.4 ppm defectives or 99.999998% accuracy.
B. A method of solving business problems by using scientific methods.
C. A philosophy to meet business goals.
D. It is a vision of quality that equates with only 3.4 defects for million opportunities for each product.
The Six Sigma Approach is also data-driven. It focuses on reducing process variation, centering the process and on optimizing the process. The emphasis is on the improvement of process capability rather than the control of product quality, which includes the improvement of quality and reduction of cost of quality. Six Sigma approach is designed to give answers to certain questions that can prove to be of great help to achieve quality improvement plan and goals. A term Sigma Quality Level is used as an indicator of a process goodness. Lower Sigma quality level means greater possibility of defective products, while higher sigma level indicates the process results in fewer defects and zero variations within a process. Six Sigma addresses the entire process behind the production of an item or completion of a service, rather than just the final outcome. It is proactive rather than reactive, as it sets out to determine how improvements can be made even before defects or shortcomings are found.
II. LITERATUREREVIEW
SR.NO YEAR PAPER NAME AUTHORS DESCRIPTION 1 2012 Six Sigma practice
for quality improvement – A case study of Indian auto ancillary unit
Dr.
Rajeshkumar U. Sambhe
Technology (IJRASET)
2 2013 Implementation of Six Sigma for Process
Improvement-A Review
Shrikant S Chohan, Ghanshyam
This paper deals with six sigma its implementation for improvement.
3 2013 Process Capability Analysis as a Means of Decision Making in Manufacturing Company Adeoye Akeem.O., Adedoyin, Salami.I, Alawaye Anthonia.I.
This Research, the process capability analysis as a means of decision making in manufacturing company was aimed, to investigate whether the production process is in control, to investigate whether the specification limit of the company is properly centered, to examine the process capability of the company and to state if the process is capable or not.
4 2006 Six Sigma process improvements in automotive parts production Soković, M., D,Pavletić ,E. Krulčić,
In the paper is presented a Six Sigma project, undertaken within company for production automotive parts, which deals with identification and reduction of production cost in the debarring process for gravity die-castings and improvement of quality level of produced parts.
III. RESEARCH DESIGN
Theresearch designrefers to the overall strategy that one chooses to integrate the different components of the study in a coherent and logical way, thereby, ensuring it effectively addresses theresearchproblem; it constitutes the blueprint for the collection, measurement, and analysis of data. The research design adopted was a Descriptive Research. In this project after formulating the objectives a sample size of 52 timers was taken. The specification limits of the timers were 60±5 minutes. A target time of 60 minutes was set before actually beginning the process. The data collected was purely a primary data. Primary data are original observations collected by the researcher for the first time for the investigation. For each timer 10 readings of the timer time cycle was taken at every one hour interval.
IV. SIX SIGMA METHODOLOGY
DMAIC is a structured problem-solving procedure widely used in quality and process improvement. It is an integral part of a Six Sigma initiative. DMAIC is an acronym for five interconnected phases: Define Measure, Analyze, Improve, and Control. In this project six sigma methodologies had been adopted in order to reduce the variations of the timer time cycle. The plastic timer used in this project is an electromechanical timer which has specification limits of ±60 minutes and the target is 60 minutes. Different quality control tools had been used in order to monitor the variations in a process and take appropriate measures to improve it. The phases for implementing the various tasks of the project, and providing test results such as capability, performance analysis of the timers, descriptive statistics, and the variation present in the process and the number of defective timers has been calculated with the help of Minitab statistical software.
A. Define Phase
This is one of the most critical phases of DMAIC Methodology, if required, maximum time and efforts should be allocated to this phase. This phase identifies critical customer requirements and links them to business needs.
Following aspects are covered in this phase on the problems selected.
1) Fixing problem statement to work upon. The problem statement should be SMART (Specific, Measurable, Achievable, Relevant and Time-Bound).
2) Critical to quality (CTQ) tree based on customer’s needs and requirements. For identifying requirements of the customers, the critical to quality tree being the most effective one, is useful. This will help to understand the critical quality requirements of the product. To improve the quality of the product, these CTQ need to be addressed.
Technology (IJRASET)
To improve the process capability of the timers and maintain the sigma capability up to 3σ
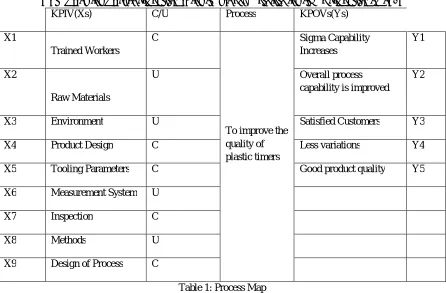
KPIV(Xs) C/U Process KPOVs(Ys)
X1
Trained Workers
C
To improve the quality of plastic timers Sigma Capability Increases Y1 X2 Raw Materials
U Overall process capability is improved
Y2
X3 Environment U Satisfied Customers Y3 X4 Product Design C Less variations Y4
X5 Tooling Parameters C Good product quality Y5
X6 Measurement System U X7 Inspection C
X8 Methods U X9 Design of Process C
Table 1: Process Map
The company desired to increase the capability of the plastic timers with USL value of 65 minutes and LSL value of 55 minutes, whereas the target was about 60 minutes. The goal of the project was to increase the Cp and Cpk values of the plastic timer as well
as to maintain the overall sigma capability of the timer up to 3σ. The project started the Define Phase with the identification of Product Quality as the CTQ.The specification width was 60±5.
B. Measure Phase
The purpose of this step is to objectively establish current baselines as the basis for improvement. This is a data collection step, the purpose of which is to establish process performance baselines. In this phase, the timer time cycle of 52 timers was measured after setting the target time to 60 minutes. The standard deviation i.e. variation, range and other factors were noted using Minitab Statistical Software.10 readings for each timer at an interval of 60 minutes were noted. The deliverables from the Measure phase include:
1) Operational definition -An Operational Definition is a precise definition of the specific output to be measured. The data collected using this definition will be used to baseline the performance. A clear concise operational definition will ensure reliable data collection and reduction in measurement error.
CTQ Measure Data Type Unit Of Measure
Operational Definition
LSL USL Target
Timer Time Cycle
Continuous Minutes The timer time cycle should be between 60±5 minutes
[image:4.612.84.530.82.375.2]55 65 60
Table 2: CTQ Performance Characteristics
Technology (IJRASET)
be involved in the data collection to make sure it is done right and that any anomalies or problems are recorded and understood. This will make the analysis of the data in the Analyse phase easier.
b) Baseline Performance- This is the final step in the Measure phase. The process baseline provides a quantifiable measure of the process performance before any improvement efforts have been initiated. Process baselines are a critical part of any process improvement effort, as they provide the reference point for assertions of benefits attained. There are a variety of metrics that can be used to baseline. These metrics include Sigma Level, Cp & Cpk, Pp & Ppk.
c) Process Capability: Process capability is the long-term performance level of the process after it has been brought under statistical control. In other words process capability is the range over which the natural variation of the process occurs as determined by the system of common causes. There are two primary capability indices used to measure process capability. If Cp>1 process is capable (Product will fit between the customer’s upper and lower specification limit if the process is centered).
i) Cp is the capability index. It measures how well the data fit between the upper and lower specification limits. The higher the value, the better the fit.
ii) Cpk is the centering capability index. It measures how well the data is centered between the specification limits. The higher the value the more centered the data.
2) Data Interpretation for Measure Phase: During this phase the key processes that affected the CTQ was identified and the no of defective timers were noted. The number of capable timers was 45 and the timers that had achieved six sigma capabilities was 11.There were 22 timers that had achieved less than 3 sigma capability. Since this was a long term process overall capability was considered.
Situation 3
[image:5.612.100.510.317.700.2]Defectives 7 Sample 52 Yield 86.54% DPMO 134615 Zlt 1.10 Zst 2.60
Table 1: Defective Data Analysis
Figure 1: Capability Analysis of overall 52 timers
Technology (IJRASET)
[image:6.612.99.513.105.332.2]capability is defined as 1.5 plus the long-term Z.bench value in overall capability, which uses the overall standard deviation of the process. Overall sigma capability=Z bench +1.5=1.82+1.5=3.32σ as shown in Figure 2.
Figure 2: Performance Analysis of 52 timers
C. Analyze Phase
In the analyse step, the objective is to use the data from the measure step to begin to determine the cause-and-effect relationships in the process and to understand the different sources of variability. The tools used in analyze phase were:
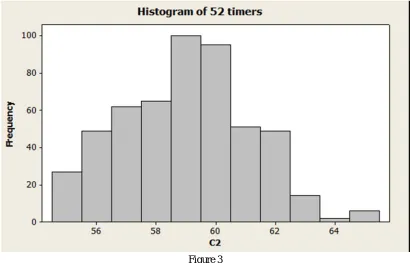
1) Histogram: A histogram is used to graphically summarize and display the distribution of a process data set.
Figure 3
[image:6.612.101.511.404.667.2]Technology (IJRASET)
Figure 4: Pareto Chart
D. Improvement Phase
Thorough Brainstorming sessions was done in order to reduce the variations in the timer time cycle. FMEA was carried out for identifying all possible failures in a design, a manufacturing or assembly process, or the product. Investigation in the sources of materials, supplier quality as well as calibration of the measurement device was checked. Although significant improvements were achieved but defined goals were not met. Further experimentation was done wherein there was modification in the production process and design.
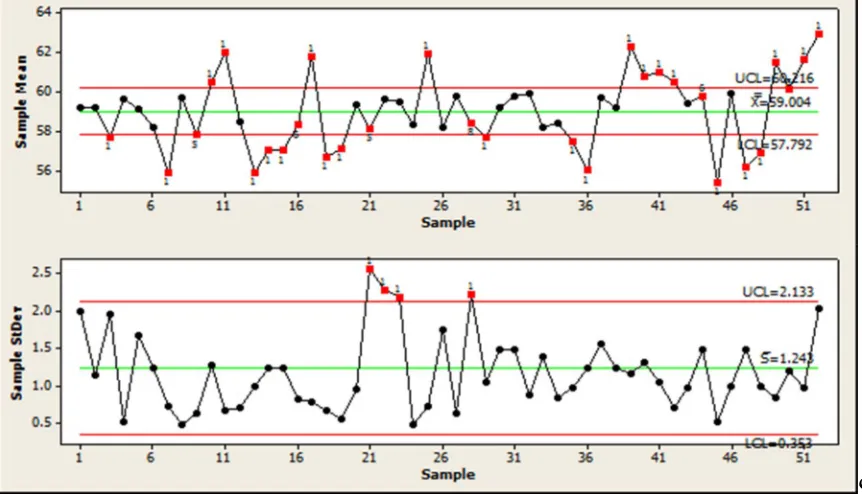
E. Control Phase
In this phase it is possible to detect out of control state and determine the associated special causes so that actions can be taken to correct the problem before non conformances are produced. Control charts display the total variation in process so that it can be monitored and kept in control (within its operating capability). The graph shown below indicates few timers are not stable and in control even though they are capable. The points lying outside the control limits (UCL and LCL) indicate the process is not stable.
[image:7.612.92.523.465.712.2]Technology (IJRASET)
The control chart above shows there are jumps in the process level due to Process parameter changes, Different/new operator, Change in raw material. Discontinuity in the process could be caused by material, new operator etc,
V. CONCLUSION
The overall sigma capability of the timers was 3.32σ where as the process capability was Cp= 0.77.After analysing all the data, it was noted that the timers were still not capable and were not in statistical control. As process value increased from 0 to 6, variation of a process around the mean value decreased. A higher sigma level indicated the process results in fewer defects and zero variations. There was a certain amount of variability in every product; consequently, no two products were ever identical. Sources of this variability include differences in materials, differences in the performance and operation of the manufacturing equipment, and differences in the way the operators perform their tasks. The process will be in the state of statistical control only when the variation is random and stable. By implementing Six Sigma, organizations can improve cycle times, quality and cost and also improve the efficiency and effectiveness of the process.
VI. SUGGESTION AND RECOMMENDATIONS
When the process is centered and well within the specification limits, it is more capable of producing a product that meets customer requirements.QC (Quality Control) requires constant inspection throughout the process in order to detect components that are not up to the required standard. Often, these inspections are also carried out on the completion of the process or product by trained
inspectors. In order to maintain 6σ, the process width should be 50% of the specification limits as provided by the customer. Process Capability Studies are designed to see what the process is “capable” of doing under controlled conditions.
The Process Engineer must keep in mind the following two considerations:
A. Eliminate or minimize special causes of variation, for example using the same operator, same batch of material, same machine and so on.
B. Collect a minimum of 50 consecutive pieces in at least 10 subgroups of 5.
By implementing routine adjustments and replacing worn components, ensure that the equipment is functioning with the highest possible degree of efficiency. In a production environment, the raw materials being turned into products leave residue on the machinery. At least once per eight-hour shift, use an air hose to clear this residue. This minimizes the opportunity for the dusty remains to work their way into the components of your equipment and cause a breakdown over time.
REFERENCES
[1] Introduction to Statistical Quality Control by DOUGLAS C. MONTGOMERY, Arizona State University.
[2] Soković, M., Pavletić, D., and Krulčić, E., “Six Sigma process improvements in automotive parts production”, Journal of Achievements in Materials and Manufacturing Engineering, Vol. 19 No. 1, pp 96-102(2006).
[3] Dr. Rajeshkumar U. Sambhe, “Six Sigma practice for quality improvement – A case study of Indian auto ancillary unit”, IOSR Journal of Mechanical and Civil Engineering (IOSR-JMCE) ISSN: 2278-1684 Volume 4, Issue 4 (Nov-Dec. 2012,PP 26-42.
[4] Neha Gupta,”AN OVERVIEW ON SIX SIGMA: QUALITY IMPROVEMENT PROGRAM “’,(International Journal of Technical Research and Applications e-ISSN: 2320-8163, www.ijtra.com Volume 1, Issue 1 (march-april 2013), PP. 29-39).
[5] Chaczko Z., Rahali E., and Tariq R., “The Application of Six Sigma to Integration of Computer Based Systems”, World Academy of Science, Engineering and Technology 34, pp 332- 337 (2007).
[6] Shrikant S Chohan, Ghanshyam,”Implementation of Six Sigma for Process Improvement-A Review”,(International Journal of Innovative Research in Engineering & Multidisciplinary Physical Sciences (IJIRMPS) Volume 1, Issue 2, December 2013).
[7] Adeoye Akeem.O, Adedoyin,Salami, Alawaye Anthonia,”Process Capability Analysis as a Means of Decision Making in Manufacturing Company “,International Journal of Advanced Research in Computer Science & Technology (IJARCST)).
[8] E.V. Gijo, Shreeranga Bhat, N.A. Jnanesh, “Application of Six Sigma methodology in a small-scale foundry industry”, International Journal of Lean Six Sigma Vol. 5 No. 2,(2014) pp. 193-211.