5
IX
September 2017
Fault Detection and Classification on a High
voltage Transmission Line Using Wavelet
Transforms
Kumar Raja Thokala 1, Baddu Naik B2 1, 2Department of Electrical and Electronics Engineering, Prasad V. Potluri Siddhartha Institute of Technology, Vijayawada, Andhra Pradesh, India
Abstract: Electrical power system consists of many different complex dynamic and interacting elements, which are always prone to disturbance or an electrical fault. Transmission lines are exposed to atmosphere, the faults due to transmission lines are about 50% as compared to different types of faults that occur in the power system. The faults on electrical power system transmission lines are supposed to be first detected and then be classified correctly and should be cleared in least fast as possible time. This paper describes a fault-detection technique of faults in high voltage transmission lines using the wavelet transform. The wavelet transform (WT) has been successfully applied in many fields. The technique is based on using the absolute sum value of coefficients in multi resolution signal decomposition (MSD) based on the discrete wavelet transform (DWT). A fault indicator and fault criteria are then used to detect the faults in the transmission line. Wavelet transform is best suited for fault detection and classification. This paper describes a new fault detection technique which involves capturing the current signals generated in a system under faults. The detection process is based on calculating the absolute sum of the wavelet transform detail coefficients for one period. Wavelet transform is used for the decomposition of signals and feature extraction.
Keywords: Wavelet transforms, Transmission lines, Electrical network parameters
I.INTRODUCTION
Transmission lines are important component in power system because electric energy is transferred through it to a long distance. So the study of fault analysis on transmission line is very important. Conventional relays are designed for transmission line protection is broadly over current, over voltage and distance relays etc. Conventional method of fault detection and classification are unreliable due to large power system.
and signal processing algorithms has led to a wide range of new techniques to identify the waveforms associated with high impedance fallen conductor faults.
In the 1960s, the relays are electromechanical in nature. Such relays utilized flux generated due to fault voltages or currents to produce torque. Positive torque results in forces that tend to close the trip contacts to open the circuit breaker. In conventional methods phase current or voltage or instantaneous values of current or voltage are directly used as relay inputs. In this thesis Wavelet multi resolution analysis is found to be most suitable for extracting the information from transient fault signals. Second and third order harmonics are dominant in the fault signals and are hence chosen for the analysis (d6 coefficients) and Db4 as mother wavelet. Using wavelet MRA technique, the summation of detail coefficients for sixth level are extracted from the current signal. From the magnitude of detail coefficient summations, the presence of fault in a particular phase is detected. A generalised algorithm based on wavelets has been verified for the classification of transmission line faults. The most important of this algorithm is independent of fault location, impedance and inception angle.
II. WAVELETTRANSFORM
The fault current signals are non-stationary in nature. Therefore, conventional Fourier transform and short time Fourier transforms are inadequate to deal with such signals. The Wavelet theory and its applications are rapidly developing fields in applied mathematics and signal analysis. The wavelet transform is a tool that divides up data into different frequency components, and then evaluates each component with a resolution matched to its scale. The wavelet transform is useful in analysing the transient phenomena associated with transmission -line faults and/or switching operations. Wavelet analysis is the breaking up of a signal into shifted and scaled version of the original (or mother) wavelet. Scaling a wavelet means stretching (or compressing) it. Shifting a wavelet simply means delaying its onset [4]. Analogous to the relationship between continuous Fourier transform (FT) and Discrete Fourier Transform (DFT), the continuous wavelet transform (CWT)[11] has a digitally implement able counterpart known as the Discrete Wavelet Transform (DWT).
L1 H1
L2 H2
Fig.1. Channel analysis filter bank
III. FAULTCASESSTUDYANDRESULTS
A 3 phase transmission line rated 400kV and length of line is 300km has been considered. The circuit diagram of the transmission line fault analysis is shown in figure.
The fault analysis of transmission lines involves transient phenomena. Therefore, the positive, negative and zero sequence parameters of the source as well as transmission lines are necessary. The various line parameters pertaining to source as well as transmission line are shown in table. An active load of 500MW and a reactive load of 20MVAR (inductive) are used for the analysis. The fault may appear at any instant of time, and thus voltage or current ranging from 0 to 360 degrees. The angle at which fault occurs is called fault inception angle and it effects the amplitude of fault current. The fault distance changes then corresponding line impedance changes which is going change the fault current. Fault resistance also affects the fault current. Fault resistance increases fault current decreases [3]. Different types of power system faults are created using simulation model as shown, at different fault distances having different fault inception angles with different fault resistance. The wave forms are shown below.
Fig.4 Ia, Ib, Ic for AG Fault at D==100Km, FIA=0, Rf=0.001Ω
Fig.6 Ia, Ib, Ic for AG Fault at D==200Km, FIA=0, Rf=1Ω
Fig.8 Ia, Ib, Ic for ABG Fault at D==200Km, FIA=60, Rf=1Ω
IV. FAULT DETECTION AND CLASSIFICATION ALGORITHM
L-L fault with different fault distances the values of Sa, Sb, Sc with FIA=00
10(km) 30 (km) 50(km) 70(km) 90(km) 100(km) 150(km) 200(km)
Sa 5.5206 3.6877 2.8239 2.3508 2.0473 1.9327 1.5714 1.3852
Sb -5.5007 -3.6679 -2.8041 -2.3310 -2.0275 -1.9129 -1.5514 -1.3652
Sc -0.0199 -0.0197 -0.0197 -0.0198 -0.0198 -0.0198 -0.0199 -0.0199
TABLE II
L-G fault with different fault distances the values of Sa, Sb, Sc with FIA= 00
10(km) 30 (km) 50(km) 70(km) 90(km) 100(km) 150(km) 200(km)
Sa 15.0673 7.3082 4.9285 3.7782 3.0993 2.8547 2.1021 1.7146
Sb -0.0126 0.0073 0.0132 0.0156 0.0168 0.0171 0.0174 0.0193
[image:7.612.54.560.515.687.2]Sc -0.0978 -0.0776 -0.0717 -0.0694 -0.0682 -0.068 -0.0678 -0.0695
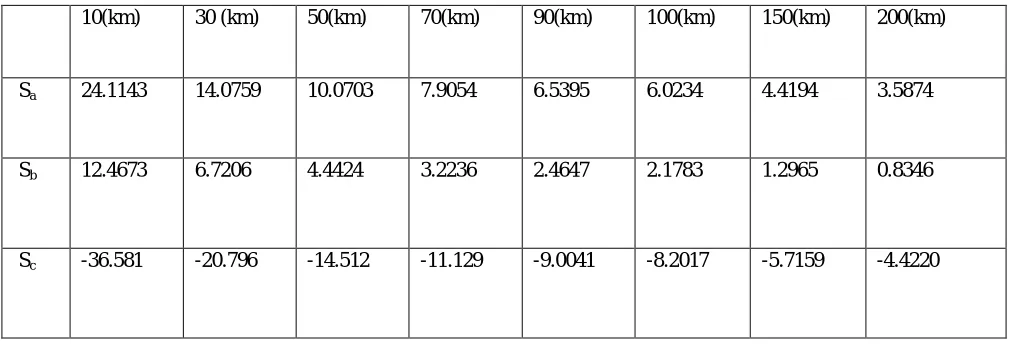
TABLE IIII
L-L-L fault with different fault distances the values of Sa, Sb, Sc with FIA=0
10(km) 30 (km) 50(km) 70(km) 90(km) 100(km) 150(km) 200(km)
Sa 24.1143 14.0759 10.0703 7.9054 6.5395 6.0234 4.4194 3.5874
Sb 12.4673 6.7206 4.4424 3.2236 2.4647 2.1783 1.2965 0.8346
Sc -36.581 -20.796 -14.512 -11.129 -9.0041 -8.2017 -5.7159 -4.4220
Case: 1 Transmission line Fault analysis
Case: 2 High Impedance Fault (HIF) Detection &Classification
Fig.17 Source voltage under HIF
Fig.18 Source current under HIF
Fig.20 V-I Characteristics of HIF
Fig.21 db4 as mother wavelet
Fig.23 Sym5 as mother wavelet
Fig.24 Fault on B phase
Fig.26 Fault on two phases
Fig.27 Comparison of HIF with A-G Fault
VI. CONCLUSION
REFERENCES
[1] Satish Karekar, Tripti Barik “A Modelling of 440 KV EHV Transmission Line Faults identified and Analysis by Using MATLAB Simulation”
International Journal of Advanced Research in Electrical,Electronics and Instrumentation Engineering Vol. 5, Issue 3, March 2016
[2] Raunak Kumar “Three Phase Transmission lines fault Detection,Classification and Location” International Journal of Science and Research Index
Copernicus Value (2013)
[3] M. Jayabharata Reddy, and D.K. Mohanta, “A wavelet- fuzzy combined approach for classification and location of transmission line faults “,International journal of Electrical Power and Energy system, Volume 29, Issue 9, pp 669-678, November 2007.
[4] A.H. OSMAN, O.P. MALIK, "Protection of Parallel Transmission Lines Using Wavelet Transform", IEEE Transactions on Power Delivery .vol. 19, no. 1, pp.
49-55, 2004.
[5] T. B. Littler and d. J. Morrow, "Wavelets for the Analysis and Compression of Power System Disturbances," IEEE Transactions on Power Delivery, vol. 14, pp.
358-364, Apr. 1999
[6] Mark Adamik, Craig Wester, Manish Thaker, “HIF on Distribution Feeder”
[7] Girgis, A.A, Chang W, and Makram, E.B,“Analysis of high impedance fault generated signals using a Kalman filtering approach”, IEEE Trans. On Power
Delivery, Vol. 5, No. 4, pp.1714-1724, July,1990.
[8] Emanuel, A.E, Cyganski, D, Orr, J.A., Shiller, S., and Gulachenski, E.M, “High impedance fault arcing on sandy soil in 15 kV distribution feeders:
contribution to the evaluation of the low frequency spectrum”, IEEE Trans. Power Delivery, Vol. 5, No. 2, pp. 676-686, July, 1990.
[9] Yu, D.C., and Khan, S.H,” An adaptive high and low impedance fault detection method”, IEEE Trans. On Power Delivery, Vol. 9, No. 4, pp. 1812-1821,
October, 1994.
[10] Mamishev, A.V., Russell, B.D., and Benner, C.L, “Analysis of high impedance faults using fractal techniques”, IEEE Trans. Power Syst., Vol. 11, No.1, pp.
435–440, October,1996.