http://dx.doi.org/10.4236/jbise.2015.810063
How to cite this paper: Kim, Y.J., Jeong, J.Y., Nam, S.Y., Kim, M.J., Oh, J.H., Kim, K.G. and Sohn, D.K. (2015) Development of Three Dimensional Automatic Body Fat Measurement Software from CT, and Its Validation and Evaluation. J. Biomedical
Development of Three Dimensional
Automatic Body Fat Measurement Software
from CT, and Its Validation and Evaluation
Young Jae Kim
1,2*, Jun Yong Jeong
3*, Su Youn Nam
4, Min Ju Kim
3, Jae Hwan Oh
5,
Kwang Gi Kim
1#†, Dae Kyung Sohn
1,5†1Biomedical Engineering Branch, Division of Convergence Technology, Research Institute, National Cancer
Center, Goyang, Korea
2Department of Plasma Bio Display, Kwangwoon University, Seoul, Korea 3Department of Radiology, Hospital, National Cancer Center, Goyang, Korea
4Center for Cancer Prevention and Detection, Hospital, National Cancer Center, Goyang, Korea 5Center for Colorectal Cancer, Hospital, National Cancer Center, Goyang, Korea
Email: #[email protected]
Received 2 July 2015; accepted 26 September 2015; published 29 September 2015
Copyright © 2015 by authors and Scientific Research Publishing Inc.
This work is licensed under the Creative Commons Attribution International License (CC BY).
http://creativecommons.org/licenses/by/4.0/
Abstract
Abdominal obesity describes the accumulation of excessive fat in the abdomen. It is known that depending on its distribution, visceral obesity presents a greater danger to health than subcuta-neous obesity. To properly prevent and treat visceral obesity, accurate evaluation methods are necessary, and hence quantitative VAT estimation is extremely important. CT scans are the most accurate method for estimating VAT, but it requires a great deal of time and effort, limiting its use in studying or evaluating obesity in patients. This paper proposed automatic measurement soft-ware that could quickly differentiate between and measure VAT and SAT. The method was verified using a total of 100 abdominal CT data values; this paper measured the SAT and VAT in the entire abdomen using the automatic measurement software. Additionally, through a comparative evalu-ation between the automated measurements and manual measurements such as BMI and waist circumference, clinical reliability and viability were validated and evaluated. Between automated measurements and manual measurements, the TAT (r = 0.995, p = 0.01), SAT (r = 0.987, p = 0.01) and VAT (r = 0.993, p = 0.01) showed high correlation. Using BMI as the main metric, the TAT for automated measurements (r = 0.674, p = 0.01) and the TAT for manual measurements (r = 0.703, p = 0.01) showed the strongest correlation. When using waist circumference, the VAT for automated *Co-first authors. Both authors contributed equally to this work.
#Corresponding author.
†
measurements (r = 0.826, p = 0.01) and the VAT for manual measurements (r = 0.822, p = 0.01) showed the strongest correlation. With these results, the reliability and viability of the automatic measurement software were confirmed. The software is expected to help greatly in reducing the time and in providing objective data of VAT measurements from CT scans for clinical research.
Keywords
Abdominal Obesity, Visceral Adipose Tissue (VAT), Subcutaneous Adipose Tissue (SAT), Computer-Aided Diagnosis (CAD), Computed Tomography (CT)
1. Introduction
Abdominal obesity refers to the excessive accumulation of adipose tissue in the abdomen, and is defined by waist circumferences over 102 cm for Caucasian males and 88 cm for Caucasian females [1]. Depending on the distribution, total adipose tissue (TAT) can be further divided into subcutaneous adipose tissue (SAT) and vis-ceral adipose tissue (VAT). Studies have reported that a high amount of VAT buildup, or visvis-ceral obesity, presents a greater health risk than subcutaneous obesity. Despres et al. reported a high correlation between VAT and hypertension, an increase in neutral fat concentration, a decrease in high-density lipoprotein cholesterol concentration, and an increase in hyperlipidemia, while Fujioka et al. discussed that VAT as the source of insu-lin concentration increased insuinsu-lin resistance and reduced glucose tolerance [2] [3]. Also, though most patients with visceral obesity are aware of their condition, severe cases of VAT accumulation can occur in physically thin patients as well, which are more difficult for the patient to detect, possibly placing them in greater danger [4]. To effectively prevent and treat visceral obesity, it must be precisely evaluated, and this requires a quantita-tive method of estimating VAT.
Current methods capable of estimating VAT clinically are bioelectric impedance analysis (BIA), magnetic resonance imaging (MRI), and computed tomography (CT) scanning. BIA sends a weak current through the body and measures the bioelectric impedance to estimate body fat, and uses an internally developed regression equation to calculate the area of VAT [5]. The method is simple and has accordingly seen widespread clinical practice, but there are few cases supporting that its estimations are accurate. MRI provides tissue cross-section images that can be used to measure VAT without exposure to radiation, but is expensive and time-consuming and has been reported to be less accurate in detecting adipose tissue (AT) than CT, thus decreasing the frequen-cy of its actual use [6] [7]. CT images, much like MRI, are cross-section images of patient tissue, and can clearly discern adipose tissue from the surrounding tissue. CT scans provide the greatest accuracy and are widely used as a standard measurement method [8]. However, they accompany the issue of radiation exposure. Furthermore, since all cross section images must be differentiated, it is difficult to use practically, and is costly and time- consuming [9]. Due to these issues, despite its accuracy, CT scans are used little in practice.
This paper aims to resolve the issue regarding inefficiencies in CT measurement by using computer image processing methods. Novel software which can automatically identify and measure SAT and VAT from CT scan data is developed and its accuracy and reliability are validated by comparing the results with the manual evalua-tion of two experts.
2. Materials and Method
2.1. Research Target
2.2. Body Mass Index (BMI)
BMI is simple to calculate and widely used as a standard for obesity, and it has been reported that there is a cor-relation between CT and simple obesity indicators [11]. Macor et al. established that BMI and TAT (r = 0.86, p
< 0.0001) are related, and Enzi et al. also found links between TAT (r = 0.876, p < 0.001), SAT (r = 0.871, p < 0.001), and VAT (r = 0.503, p < 0.001) [12] [13].
2.3. Waist Circumference (WC)
Waist circumference, another simple indicator of obesity, is used as an indicator of cardiovascular disease [14]. It is also correlated to VAT, and reflects VAT more effectively than the waist-to-hip ratio [15]. This paper measured waist circumference using CT, and following WHO guidelines, performing the measurement between the lowest region of the ribs and the middle of the pelvic iliac crest.
2.4. Manual Measurement
This study used manual measurement results from Nam et al. [10]. Nam et al. used the Extended Brilliance Workspace (Version 3.5, Phillips Medical System, NT) software in making manual measurements. The observer outlined the TAT excluding the skin and spinal regions, and abdominal VAT as areas of interest, from which adipose tissue volume was computed within the attenuation value range. The SAT was defined as the difference between the TAT and VAT volumes.
2.5. Automatic Measurement
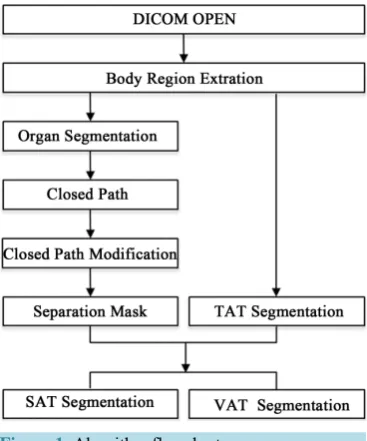
The automatic measurement software which we developed was used to automatically measure the SAT and VAT within the abdomen. Microsoft Visual Studio (Ver. 2005, Microsoft, Redmond, USA) was used for the development of algorithms and software, and ITK (Ver. 3.14.0, Kitware, USA) and VTK (Ver. 5.10.0, Kitware, USA) were used as libraries. This software uses a pre-processing and mask separation method to differentiate the different types of adipose tissue and evaluate them. Figure 1 is a flowchart of the process.
[image:3.595.221.405.491.712.2]This paper, to enhance the processing speed of the algorithm and prevent detection error, pre-processed the CT image such that it only contains the abdomen region of the body. This eliminates unnecessary elements such as the bed or sheets from the search region, thereby increasing accuracy. By limiting the region to be processed, the efficiency of the algorithm also is increased [16]. Within the abdomen region, areas with values less than 1000 HU, which correspond to air, are deemed below the threshold and deleted, while the rest of the region is labeled in 3-dimensions, of which the largest region is labeled as the body [17] [18].
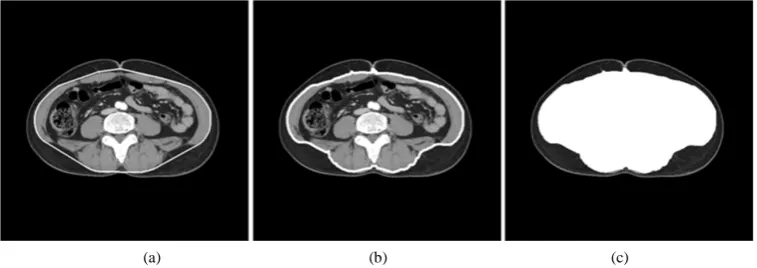
Once the pre-processing stage is completed, the narrowed down region is divided and processed for adipose tissue. Once all of the TAT within the region is detected, a separation mask divides the SAT and VAT. TAT was detected by setting the range threshold between −30 and −190 HU [19]. The separation mask generates TAT within the abdominal region excluding the organs. Anatomically, the abdominal cavity, due to being surrounded by muscle and bone, is the most suitable organ to differentiate SAT and VAT. Additionally, among the organs excluding the adipose tissue, muscle and bone are located near the outer regions, making SAT and VAT diffe-rentiation possible by creating a separation mask using the outermost outline of the organ region. In this study the organ region excluding TAT was detected, and the Convex Hull algorithm was used to obtain the outermost closed path fully encompassing the organ region. The Convex Hull algorithm calculates the smallest possible convex polygon, and the shortest closed path containing this polygon can be found [20]. However, error does occur as the closed path and organ regions do not always match, and this may affect the quantitative results. Closed path adjustments were thus performed by translating the coordinates such that it matched the organ re-gion. All closed path coordinates not close to the organ region were translated laterally or vertically such that they adhered to the organ region. Once all adjustments were completed, any point is taken as the starting point and is sequentially connected to its next closest closed path point. Using this method, once all connections have been completed, an adjusted closed path such as that in Figure 2(b) can be seen, and the closed path’s interior is defined by the separation mask.
In this study a difference operation on the separation mask region of the detected TAT region was used to detect the SAT region, and an operation to detect the VAT region was separately used.
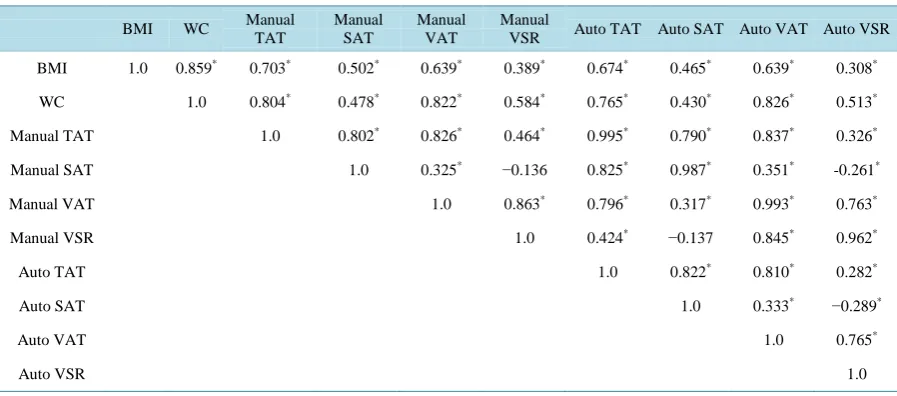
The Pearson’s correlation analysis was conducted using the manual and automatic measurement results and the simple obesity indicators [21]. For the measured results, TAT, SAT, VAT, and VSR, the ratio between VAT and SAT, which is known to have a close relationship with abdominal obesity, were set as the items to be used, while for the simple obesity indicators, BMI and waist circumference were set as items. The level of signific-ance α was set to 0.01.
3. Results
A separation mask was defined based on the organ region of the abdominal CT, and it was used to differentiate and detect SAT and VAT. Figure 3 and Figure 4 show the developed automatic adipose tissue measurement software and its results.
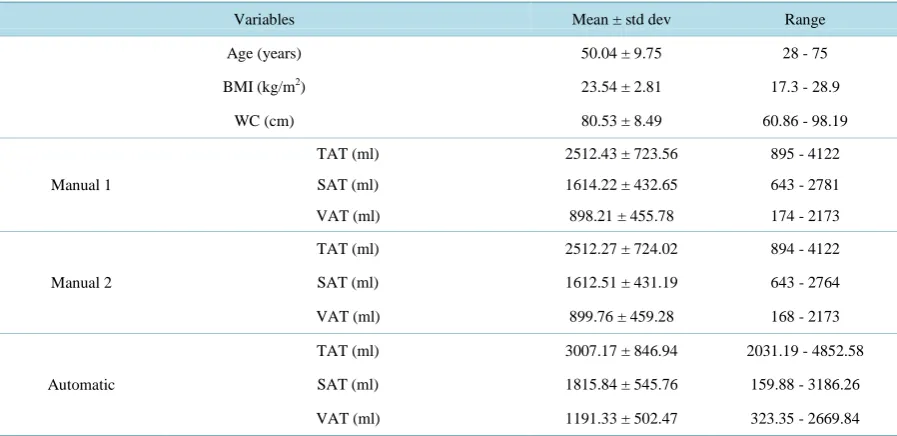
In order to validate the performance of the developed software and evaluate its clinical viability, a correlation analysis and a consistency evaluation were performed using manual measurement results and simple obesity in-dicators as comparisons. The simple obesity inin-dicators used were BMI and waist circumference and the data values used in this experiment are listed in Table 1. The mean BMI was 23.54 ± 2.81 kg/m2, and the mean waist circumference was 80.53 ± 8.49 cm. Also, the first manual measurer’s results were, TAT at 2512.43 ± 723.56 ml, SAT at 1614.22 ± 432.65 ml, and VAT at 898.21 ± 455.78 ml. The second measurer recorded TAT of 2512.27 ± 724.02 ml, SAT of 1612.51 ± 431.19 ml, and VAT of 899.76 ± 459.28 ml. This paper took the means of these values. The automatic measurement software produced the following results: TAT of 3007.17 ± 846.94 ml, SAT of 1815.84 ± 545.76 ml, and VAT of 1191.33 ± 502.47 ml.
[image:4.595.125.504.560.694.2](a) (b) (c)
Figure 2. Process of automatic adipose tissue detection. (a) Result of convex hull; (b) Result of adjusted
Figure 3.Automatic body fat measurement software.
[image:5.595.89.538.456.674.2]Figure 4. Automatic body fat separation and detection results.
Table 1. Obesity indicators measurment values compare with experties and in-house developed software (n = 100).
Variables Mean ± std dev Range
Age (years) 50.04 ± 9.75 28 - 75
BMI (kg/m2) 23.54 ± 2.81 17.3 - 28.9
WC (cm) 80.53 ± 8.49 60.86 - 98.19
Manual 1
TAT (ml) 2512.43 ± 723.56 895 - 4122
SAT (ml) 1614.22 ± 432.65 643 - 2781
VAT (ml) 898.21 ± 455.78 174 - 2173
Manual 2
TAT (ml) 2512.27 ± 724.02 894 - 4122
SAT (ml) 1612.51 ± 431.19 643 - 2764
VAT (ml) 899.76 ± 459.28 168 - 2173
Automatic
TAT (ml) 3007.17 ± 846.94 2031.19 - 4852.58
SAT (ml) 1815.84 ± 545.76 159.88 - 3186.26
VAT (ml) 1191.33 ± 502.47 323.35 - 2669.84
A consistency evaluation of the results were conducted with a Bland-Altman plot analysis for SAT and VAT. Analysis indicated that all data were distributed within a 95% reliability range, and this is illustrated inFigure 5
Figure 5. Assessment of the degree of agreement between automatic
measure-ments and manual measuremeasure-ments using the Bland-Altman plot on SAT.
Figure 6.Assessment of the degree of agreement between automatic
measure-ments and manual measuremeasure-ments using the Bland-Altman plot on VAT.
Using Pearson’s correlation coefficient (Table 2), the correlations between the automated measurements and manual measurements are as follows; TAT (r = 0.995, p = 0.01), SAT (r = 0.987, p = 0.01), VAT (r = 0.993, p = 0.01). The comparison between BMI and manual measurements shows a strong correlation in SAT (r = 0.502, p
= 0.01) and VAT (r = 0.639, p = 0.01). Also, a strong correlation was noticed in SAT (r = 0.465, p = 0.01) and VAT (r = 0.639, p = 0.01) between the BMI and automated measurements. Further analysis was conducted us-ing waist circumference measurement. It was found that waist circumference showed high correlations with the SAT (r = 0.502, p = 0.01) and VAT (r = 0.639, p = 0.01) obtained using the manual measurements. Also, strong correlations were noted between waist circumference and the automatic measurement results, in SAT (r = 0.465,
p = 0.01) and VAT (r = 0.639, p = 0.01).
Also, to further evaluate the performance of the software proposed in this study, the running time of the soft-ware was measured. Only the duration for separating and measuring AT were considered, and it was found that the software required the average of 3 seconds to process 24 CT slices.
4. Discussion
[image:6.595.174.455.85.262.2] [image:6.595.171.457.296.478.2]Table 2.Pearson’s correlation matrix among the manual and automatic measurement results and the simple obesity indica-tors (n = 100).
BMI WC Manual TAT
Manual SAT
Manual VAT
Manual
VSR Auto TAT Auto SAT Auto VAT Auto VSR
BMI 1.0 0.859* 0.703* 0.502* 0.639* 0.389* 0.674* 0.465* 0.639* 0.308*
WC 1.0 0.804* 0.478* 0.822* 0.584* 0.765* 0.430* 0.826* 0.513*
Manual TAT 1.0 0.802* 0.826* 0.464* 0.995* 0.790* 0.837* 0.326*
Manual SAT 1.0 0.325* −0.136 0.825* 0.987* 0.351* -0.261*
Manual VAT 1.0 0.863* 0.796* 0.317* 0.993* 0.763*
Manual VSR 1.0 0.424* −0.137 0.845* 0.962*
Auto TAT 1.0 0.822* 0.810* 0.282*
Auto SAT 1.0 0.333* −0.289*
Auto VAT 1.0 0.765*
Auto VSR 1.0
*
p = 0.01, significant correlation.
researched by numerous teams around the world; an example is the Active Shape Model (ASM) method and Fuzzy affinity applied Automatic Fat Analysis in Computed Tomography (AFACT) method developed by Ban-dekar et al. This method differentiates between SAT and VAT, and was evaluated by comparing accuracy and sensitivity with manual measurements performed by experts. Results show high accuracy for both SAT, at 98.29% ± 0.62%, and VAT, at 97.66% ± 0.98% [25]. Kullberg used histograms of MRI images to create AT masks and SAT masks to differentiate between adipose tissue, and created a pelvis model and vertebra model to establish the range of detected tissue. Applying the algorithm to discharge (L4-L5) volumes, the true positive detection results based on the manual measurement results showed VAT of 90 ± 6.5 and SAT of 96 ± 2.3, from a total of 17 data points [26]. All of the research mentioned above exhibited high accuracy, but Bandekar et al. only per-formed measurements on cross-section images, limiting the reliability of their results. This paper, working from the assumption that the accuracy of adipose tissue measurement of DEXA has been validated, uses CT volume (r = 0.812, p < 0.01) rather than CT cross-sections (r = 0.058, p < 0.01) [27]. It is shown that to achieve high re-liability, measurements must be taken over a discharge volume instead of taking a single image. Additionally, the literature presents only limited experimental data and makes comparisons to manually produced results, li-miting their clinical reliability. This paper developed software that can automatically measure adipose tissue us-ing abdominal CT, and by comparus-ing results with examination results of two different doctors and various ab-dominal adipose tissue measurement guidelines, the software’s performance and clinical viability were eva-luated.
A consistency evaluation using a Bland-Altman plot showed that 95% of the automatic and manual measure-ment results differences were within ±1.96 SD, presenting high consistency. Using Pearson’s correlation to per-form the correlation analysis, TAT (r = 0.995, p = 0.01), SAT (r = 0.987, p = 0.01), VAT (r = 0.993, p = 0.01), VSR (r = 0.962, p = 0.01) all showed significant results. These results indicate that the automatic measurement method produces similar results to measurements taken by professionals, and that the software provides high re-liability.
In comparing automatic measurement results with BMI, TAT (r = 0.674, p = 0.01) showed the highest corre-lation, while SAT (r = 0.465, p = 0.01), VAT (r = 0.639, p = 0.01), VSR (r = 0.308, p = 0.01) also showed nota-ble results. BMI and manual measurement results showed that TAT (r = 0.703, p = 0.01), SAT (r = 0.502, p = 0.01), VAT (r = 0.639, p = 0.01), VSR (r = 0.389, p = 0.01), exhibiting an identical trend to the automatic results. Additionally, the analysis of CT and BMI correlation done by Macor et al. showed correlation for TAT (r = 0.86,
p < 0.0001), while Enzi et al. reported that TAT (r = 0.876, p < 0.001) showed the strongest correlation, which corresponds to the correlation trends between the automated results and BMI [16].
other hand, SAT (r = 0.430, p = 0.01), and VSR (r = 0.513, p = 0.01) showed a comparatively low correlation, and this trend is identical to that of the manual results as follows: TAT (r = 0.804, p = 0.01), VAT (r = 0.822, p
= 0.01), SAT (r = 0.478, p = 0.01), VSR (r = 0.584, p = 0.01). This signifies a close relationship between auto-matic and manual measurement. Also, this coincides with previous research stating that VAT and waist circum-ference are related due to the high correlation exhibited by the VAT values [18].
The time for the automatic measurement software to produce 24 CT slides was only 3 seconds on the average, which is hundreds to thousands of times faster than the current manual method. Comprehensively considering the correlation analysis and consistency evaluation results, as well as the processing time mentioned above, there can be a convincing argument for the clinical viability of automatic measurement. However, it should be noted that the result of the automatic measurement varies with the chosen HU range. In this study, the HU range was set to −30 - −190 HU; many other studies use −25 - −175 HU. In this study, the correlation between the two HU ranges was analyzed. However, additional studies to evaluate the clinical accuracy of the two HU ranges are de-sired.
The speed at which measurements are completed, compared to its performance, also reinforce the superior viability of the automatic measurement software. Before the proposed software is introduced clinically, there are limitations in radiation exposure, cost, and CT filming time that should be considered. However, some of these issues can be resolved by taking measures such as the use of low-dose CT, or reusing CT scans from different examinations. CT scans are considered the gold standard and are used not only in obesity evaluation, but for other research pursuits, and the automatic measurement software is expected to provide a means of rapidly pro-viding objective and reliable data.
5. Conclusion
In conclusion, when to measure abdominal adipose tissue either for research purposes or clinical need, the high-ly viable and reliable automatic measurement software presented in this paper should be useful and can be an effective alternative to previous manual measurement.
Acknowledgements
This study was supported by a grant of the Korea Health technology R&D Project, Ministry of Health & Wel-fare, Republic of Korea (HI13C12830100) and support by NCC grant (1410590-2).
References
[1] Ford, E., Li, C., Zhao, G. and Tsai, J. (2011) Trends in Obesity and Abdominal Obesity among Adults in the United States from 1999-2008. International Journal of Obesity, 35, 736-743. http://dx.doi.org/10.1038/ijo.2010.186
[2] Després, J.P. (1991) Obesity and Lipid Metabolism: Relevance of Body Fat Distribution. Current Opinion in Lipidol-ogy, 2, 5-15. http://dx.doi.org/10.1097/00041433-199102000-00003
[3] Fujioka, S., Matsuzawa, Y., Tokunaga, K. and Tarui, S. (1987) Contribution of Intra-Abdominal Fat Accumulation to the Impairment of Glucose and Lipid Metabolism in Human Obesity. Metabolism-Clinical and Experimental, 36, 54-59. http://dx.doi.org/10.1016/0026-0495(87)90063-1
[4] Zamboni, M., Armellini, F., Sheiban, I., De Marchi, M., Todesco, T., Bergamo-Andreis, I., Cominacini, L. and Bosello, O. (1992) Relation of Body Fat Distribution in Men and Degree of Coronary Narrowings in Coronary Artery Disease.
The American Journal of Cardiology, 70, 1135-1138. http://dx.doi.org/10.1016/0002-9149(92)90043-X
[5] Jackson, A., Pollock, M.L., Graves, J.E. and Mahar, M. (1988) Reliability and Validity of Bioelectrical Impedance in Determining Body Composition. Journal of Applied Physiology, 64, 529-534.
[6] Donnelly, L.F., O’Brien, K.J., Dardzinski, B.J., Poe, S.A., Bean, J.A., Holland, S.K. and Daniels, S.R. (2003) Using a Phantom to Compare MR Techniques for Determining the Ratio of Intra-Abdominal to Subcutaneous Adipose Tissue.
American Journal of Roentgenology, 180, 993-998. http://dx.doi.org/10.2214/ajr.180.4.1800993
[7] Seidell, J.C., Bakker, C. and van der Kooy, K. (1990) Imaging Techniques for Measuring Adipose-Tissue Distribu-tion—A Comparison between Computed Tomography and 1.5-T Magnetic Resonance. The American Journal of
Clin-ical Nutrition, 51, 953-957.
[8] Tokunaga, K., Matsuzawa, Y., Ishikawa, K. and Tarui, S. (1982) A Novel Technique for the Determination of Body Fat by Computed Tomography. International Journal of Obesity, 7, 437-445.
Funa-hashi, T. and Yamashita, S. (1999) Abdominal Fat: Standardized Technique for Measurement at CT1. Radiology, 211, 283-286. http://dx.doi.org/10.1148/radiology.211.1.r99ap15283
[10] Nam, S.Y., Choi, I.J., Ryu, K.H., Park, B.J., Kim, H.B. and Nam, B.H. (2010) Abdominal Visceral Adipose Tissue Volume Is Associated with Increased Risk of Erosive Esophagitis in Men and Women. Gastroenterology, 139, 1902- 1911. http://dx.doi.org/10.1053/j.gastro.2010.08.019
[11] Garrouste-Orgeas, M., Troché, G., Azoulay, E., Caubel, A., Lassence, A., Cheval, C., Montesino, L., Thuong, M., Vincent, F. and Cohen, Y. (2004) Body Mass Index. Intensive Care Medicine, 30, 437-443.
http://dx.doi.org/10.1007/s00134-003-2095-2
[12] Enzi, G., Gasparo, M., Biondetti, P.R., Fiore, D., Semisa, M. and Zurlo, F. (1986) Subcutaneous and Visceral Fat Dis-tribution According to Sex, Age, and Overweight, Evaluated by Computed Tomography. The American Journal of
Clinical Nutrition, 44, 739-746.
[13] Macor, C., Ruggeri, A., Mazzonetto, P., Federspil, G., Cobelli, C. and Vettor, R. (1997) Visceral Adipose Tissue Im-pairs Insulin Secretion and Insulin Sensitivity but Not Energy Expenditure in Obesity. Metabolism: Clinical and
Expe-rimental, 46, 123-129. http://dx.doi.org/10.1016/S0026-0495(97)90288-2
[14] Han, T., Van Leer, E., Seidell, J. and Lean, M. (1995) Waist Circumference Action Levels in the Identification of Car-diovascular Risk Factors: Prevalence Study in a Random Sample. BMJ, 311, 1401-1405.
http://dx.doi.org/10.1136/bmj.311.7017.1401
[15] Ashwell, M., Cole, T.J. and Dixon, A.K. (1985) Obesity: New Insight into the Anthropometric Classification of Fat Distribution Shown by Computed Tomography. British Medical Journal, 290, 1692-1694.
http://dx.doi.org/10.1136/bmj.290.6483.1692
[16] Kim, C.H. and Jung, J.I. (2006) Study for Hounsfield Units in Computed Tomogram with Jaw Lesion. Journal of the
Korean Association of Oral and Maxillofacial Surgeons, 32, 391-396.
[17] Chang, F., Chen, C.J. and Lu, C.J. (2004) A Linear-Time Component-Labeling Algorithm Using Contour Tracing Technique. Computer Vision and Image Understanding, 93, 206-220. http://dx.doi.org/10.1016/j.cviu.2003.09.002
[18] Di Stefano, L. and Bulgarelli, A. (1999) A Simple and Efficient Connected Components Labeling Algorithm. IEEE:
Image Analysis and Processing, Venice, 27-29 September 1999, 322-327. http://dx.doi.org/10.1109/iciap.1999.797615
[19] Bandekar, A.N., Naghavi, M. and Kakadiaris, I.A. (2006) Automated Pericardial Fat Quantification in CT Data.
IEEE-EMBS 2006.28th Annual International Conference of the IEEE, New York, 30 August-3 September 2006, 932-
935. http://dx.doi.org/10.1109/iembs.2006.259259
[20] Graham, R.L. and Frances Yao, F. (1983) Finding the Convex Hull of a Simple Polygon. Journal of Algorithms, 4, 324-331. http://dx.doi.org/10.1016/0196-6774(83)90013-5
[21] Benesty, J., Chen, J., Huang, Y. and Cohen, I. (2009) Pearson Correlation Coefficient. In: Noise Reduction in Speech
Processing, Springer, Heidelberg, 37-40. http://dx.doi.org/10.1007/978-3-642-00296-0_5
[22] Martin Bland, J. and Altman, D. (1986) Statistical Methods for Assessing Agreement between Two Methods of Clini-cal Measurement. The Lancet, 327, 307-310. http://dx.doi.org/10.1016/S0140-6736(86)90837-8
[23] Bland, J.M. and Altman, D.G. (1999) Measuring Agreement in Method Comparison Studies. Statistical Methods in
Medical Research, 8, 135-160. http://dx.doi.org/10.1191/096228099673819272
[24] Doi, K. (2005) Current Status and Future Potential of Computer-Aided Diagnosis in Medical Imaging. British Journal
of Radiology, 78, s3-s19. http://dx.doi.org/10.1259/bjr/82933343
[25] Bandekar, A.N., Naghavi, M. and Kakadiaris, I.A. (2005) Performance Evaluation of Abdominal Fat Burden Quantifi-cation in CT. IEEE-EMBS 2005. 27th Annual International Conference of the IEEE, Shanghai, 17-18 January 2005, 3280-3283. http://dx.doi.org/10.1109/iembs.2005.1617177
[26] Kullberg, J., Ahlström, H., Johansson, L. and Frimmel, H. (2007) Automated and Reproducible Segmentation of Vis-ceral and Subcutaneous Adipose Tissue from Abdominal MRI. International Journal of Obesity, 31, 1806-1817. http://dx.doi.org/10.1038/sj.ijo.0803671
[27] Kim, Y.J., Lee, S.H., Kim, T.Y., Park, J.Y., Choi, S.H. and Kim, K.G. (2013) Body Fat Assessment Method Using CT Images with Separation Mask Algorithm. Journal of Digital Imaging, 26, 155-162.