PSO based PI Controller for the LFC System of an
Interconnected Power System
K. P. Singh Parmar
Assistant Professor National Power Training Institute Faridabad, Haryana, 121003, India
ABSTRACT
In this paper, Particle Swarm Optimization (PSO) based Proportional plus Integral (PI) controller has been presented for the Load Frequency Control (LFC) system of an interconnected power system. The power system comprises multi-source power generation which is more pragmatic. The controller gains have been optimized using an efficient PSO technique. The dynamic responses have been obtained by giving step load perturbation (SLP) in the control area-1. The presented LFC system assists the frequency and tie line power deviations to settle quickly with zero errors at steady state. The dynamic responses further examined by varying the SLP from 1% to 3%. The dynamic responses obtained satisfy the LFC requirements.
General Terms
Control area, Frequency deviation, Tie line power deviation
Keywords
Area Control Error, Load Disturbance, Load Frequency Control
1.
INTRODUCTION
Load Frequency Control (LFC) problem in the power system operation and control has a long history [1-4]. LFC is one of the most important and recent topics of research and analysis in interconnected power systems [5]. Due to load disturbances in control areas, a power system may experience the deviations in frequency and tie line power [2-3]. A good LFC system maintains the control area frequency and tie line power at their nominal and scheduled values [1-4].
LFC problem has been studied by many researchers as it plays an important role in modern Energy Management Systems [5]. Power systems have non linear and time varying nature; however for LFC study mostly simple low order linear models have been used [1-5]. Optimal control theory based controllers are presented for the LFC analysis of interconnected power systems [6-8].
Artificial intelligence (AI) and Evolutionary algorithms based controllers have been presented by many researchers for the LFC study [5, 9-16]. In recent years, the advent and advancement of modern intelligent methods and Evolutionary algorithms, such as Artificial neural networks (ANNs), Fuzzy logic, Genetic algorithms(GAs), Particle swarm optimization (PSO), PSO-hybrids based optimization has solved the LFC problems [5,9-17] to a great extent.
Shayeghi and Shayanfar [9] have introduced the concept of the H∞ robust control technique for training of Radial basis
the fuzzy proportional plus integral (PI) controller is also presented [11, 12]. GA/particle swarm intelligence based optimization has been applied to the automatic generation control [13]. The GA technique faces some deficiencies like premature convergence which degrades its efficiency and reduces the search capability [5, 17]. LFC study of interconnected power systems using type-2 fuzzy approach [14] and Variable structure fuzzy gain scheduling [15] has also been presented. A detailed literature survey [5] recorded that many controllers and optimization techniques have been used by the researchers to solve the LFC problem and each controller presented has its own advantages and disadvantages. PSO is very important and powerful tool to solve the engineering problems [5, 13, 17].
Most of the researchers studied the LFC problem by considering either thermal or hydro units in control area [5-19]. Representing a control area with a combination of variety of sources like hydro, thermal, gas, nuclear etc is more pragmatic [4,17,20-22]. Most probably Ramakrishna and Bhatti [20] were the first who introduced the LFC analysis using multi-source power generation in a control area. Subsequently many researchers have used and extended the concept of multi-source power system models for LFC analysis [21-23].
Challa et al. [22] studied the LFC of two area interconnected power system with hydro, thermal and gas based units in each control area. However they presented the full state feedback controller, which is difficult to implement as it requires the feedback from of all the states. Further, Parmar et al. [23] overcome this difficulty by using output feedback controller (uses a few states for feedback) and implemented in a single area multi-source power system. The LFC systems of similar type of models have been improved with the application of TCPS and AC-DC tie lines [24-25].
In this paper, the concept of multi-source modeling [4,17, 20, 22] is used and extended to present a two area interconnected power system for LFC study using PSO based PI controllers. The presented power system comprises non-reheat thermal, hydro and gas based units in control area-1 and non reheat thermal unit in control area-2. The dynamics of non-reheat thermal, hydro and gas based units are taken from the literature [2, 3, 26-28] which are referred by most of the researchers for LFC study. The model considered for LFC system using PSO technique in this paper is more pragmatic as it comprises multi-source of power generation.
2.
PSO AN OVERVIEW
readers may refer the literature [29-31] for more details and understanding.
The optimization tool PSO [29] provides a population based search technique in which individuals called particles change their position with time. In a PSO system, particles fly around in a multi-dimensional search/solution space. During flight, each particle adjusts its position on the basis of its own experience and the experience of its neighbouring particles, making use of the best fittest position encountered by it and neighbouring particles [29-31]. The swarm direction of a particle is defined by the set of particles neighbouring the particle and its past experience. Each individual in PSO flies in the search space with a velocity which is dynamically adjusted according to its own flying experience and its companions flying experience.
Let p denote a particle’s co-ordinate (position) and v denote its corresponding flight speed (velocity) in a search space [29-31]. Each particle is treated as a volume less particle and
represented as =( , ,…, ) in the -dimensional space.
The best previous position of the particle is recorded and
represented as =( , ,…….. ). The index of the best particle among all the particles is treated as global best particle and represented as . The velocity for
the particle is represented as =( , , ……..., ).
The modified velocity and position of each particle can be computed [29-31] using the current velocity and the distance from to as shown in the following equations:
= *w+ *rand( )*( - )+ *Rand( )*(
) (1)
= +
(2)
In the above equation, and are recognized as the acceleration coefficients that pull each particle towards the
and positions. Rand( ) and rand( ) are the uniform random numbers between 0 and 1. The term rand( )*( -
) is called the cognitive component. The term Rand(
)*( - ) is called the social component. is the inertia weight factor. Low values of acceleration coefficients allow particles to roam far from the target regions before being tugged back and high values result in abrupt movement towards, or past target regions. Hence, the acceleration constants and are usually set to be 2.0 according to past experiences.
A large inertia weight factor enhances global exploration while a low inertia weight factor helps in local search. As originally developed [31], w often decreases linearly from about 0.9 to 0.4 during a run. In general, the inertia weight w is set according to the following equation [29-31]:
w= –[( – )* ]/( ) (3)
Here is the maximum inertia weight, is the
minimum inertia weight, is current no. of iterations, is maximum no. of iterations.
3.
POWER SYSTEM SIMULATION AND
PARAMETER OPTIMIZATION
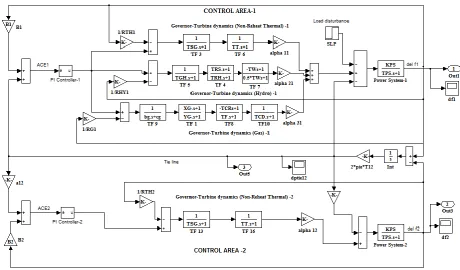
An interconnected power system shown in Fig.1 is presented for LFC system using the PSO based PI controller. The power system comprises non reheat thermal, hydro and gas based units in control area-1 and a non reheat thermal unit in control area-2.
Some important key equations are presented for understanding. However, generalized theory on LFC modeling is contained with more detail in the literature [1-3]. In normal operation, the tie line power flow [1-3] from control area 1 to control area 2 can be given as
1 2
12
(
1 2)
tie
tie
V V
P
Sin
X
(4)
Where,
1 and
2 are the angles of end voltagesV
1 and2
V
, respectively andX
tie is the tie line reactance.Frequency deviations in control area 1 and 2 may be
represented by the variables
f
1and
f
2, respectively. The incremental tie line power flow [1-3] from control area 1 to control area 2 can be given as
12
12 1 2
2
tieT
P
F s
F s
s
(5)
Where,
T
12 is Synchronizing coefficient (MW/rad) of thetie line.
Similarly the incremental tie line power flow from control area 2 to control area 1 can be given as
21
21 2 1
2
tieT
P
F s
F s
s
(6) The signal fed into the proposed PI controller is referred as area control error (ACE). The ACE can be defined [1-3] in terms of frequency and tie line error as
1 tie12 1 1
ACE
P
B f
(7)
2 tie21 2 2
ACE
P
B f
(8) Where, ACE1 and ACE2 are the area control errors of control area-1 and 2, respectively.
The speed changer (Governor) commands for control area 1 and control area 2 will thus become
1 1 12 1 1 1 12 1 1 dt ref p tie i tie
P K P B f K P B f
(9)
2 2 21 2 2 2 21 2 2 dt ref p tie i tie
P K P B f K P B f
(10)Where,
1 p
K
andK
i1 are the proportional and integral gains of the PI controller (area 1), respectively.2 p
K
andK
i2 are the proportional and integral gains of the PI controller (area 2) respectively.1
B
andB
2are the frequency bias parameters of area-1 and 2, respectively.Fig. 1: Interconnected Power System: MATLAB Simulation
frequency error or its tie line power increment is negative [1-3].
The controller gains
K
p1,K
i1K
p2 andK
i2have beenoptimized by minimizing the performance index (J) using the efficient PSO technique as described in previous section.
The main aim of the controller is to minimize the frequency and tie line power deviations and settle them with zero steady state errors as early as possible. The performance index for the PI controller is defined using the Integral square error (ISE) criteria as follow:
2 2 2
1 2 12
0
( )
T
tie
J
f f P dt(11)
Where, T is simulation time.
PSO parameters taken for optimizations are: Population size=40, Maximum number of iterations=100, c1=1.8; c2=1.7, wmax=0.9; wmin=0.4; and simulation time=100s.
The MATLAB code based on PSO algorithm has been run in MATALB Environment [32]. The convergence characteristic of the PSO algorithm is shown in Fig. 2. The minimum value of the J is 0.0003285. The optimized controller gains obtained are: Kp1 = 2.0106, Ki1 = 0.8195, Kp2 = 3.9810 and Ki2 = 1.1659.
4.
SIMULATION RESULTS AND
DISCUSSION
The optimized gains of PI controller obtained have been used in the controller simulation of the LFC system. The power system simulation is run by giving 1% SLP in the control area-1. The power system parameters used are given in
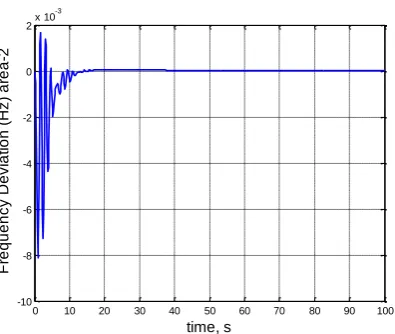
area 1 and 2 are shown in Figs 3 and 4, respectively. It is observed that control area frequency deviations settle quickly and the responses are less oscillatory with low amplitude of peak over shoots. The tie line power deviation is shown in Fig. 5. The tie line power deviation settles with zero steady state error. Therefore, the frequency and tie line power attain their corresponding nominal values.
Fig. 2: Convergence characteristics of PSO technique
The generating units’ responses are shown in the Figs 6 and 7. The generating unit adjusts the power generation as per control commands to match the total generation with the load. In a response to step load disturbance (0.01 pu MW) in the control area-1, the generating units of control area-1 raise their generation level to match the 0.01 pu MW (increased load). The total sum of the generation share of generating units (control area-1) at steady state is equal to the desired value 0.01 pu MW. As there is no local load disturbance in the control area-2, the generator contribution in response to LFC
0 10 20 30 40 50 60 70 80 90 100
3.2 3.3 3.4 3.5 3.6 3.7 3.8 3.9 4 4.1 4.2x 10
-4
No. of iterations
P
e
rf
o
rm
a
n
c
e
I
n
d
e
x
(J
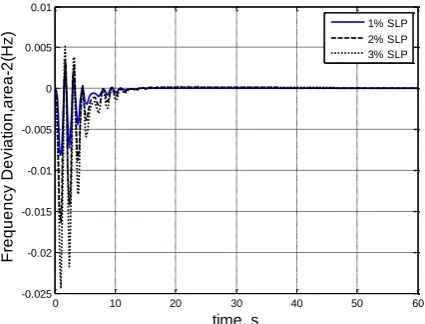
[image:3.595.326.540.458.613.2]work SLP is varied from 1% to 3% to examine the performance of the proposed LFC system. The frequency and tie line power deviation responses are shown in Figs 8-10. It has been found that first over shoot increases with increase in SLP, however settling time remains almost same. The controller performs well for 1% to 3% variation in SLP.
[image:4.595.57.259.151.309.2]Fig. 3: Frequency deviation response, area-1
Fig. 4: Frequency deviation response, area-2
[image:4.595.326.523.269.434.2]Fig. 5: Tie line power deviation response
[image:4.595.66.264.342.509.2]Fig. 6: Power outputs of generating units, area-1
Fig. 7: Power output of generating unit, area-2
Fig. 8: Frequency deviation response, area-1 for 1%-3% SLP variation
0 10 20 30 40 50 60 70 80 90 100 -0.02 -0.015 -0.01 -0.005 0 0.005 0.01 time, s F re q u e n c y D e v ia ti o n ( H z ) a re a -1
0 10 20 30 40 50 60 70 80 90 100 -10 -8 -6 -4 -2 0 2x 10
-3 time, s F re q u e n c y D e v ia ti o n ( H z ) a re a -2
0 10 20 30 40 50 60 70 80 90 100
-2.5 -2 -1.5 -1 -0.5 0 0.5x 10
-3 time, s T ie l in e P o w e r D e v ia ti o n ( p u M W)
0 10 20 30 40 50 60 70 80 90 100 -2 0 2 4 6 8 10 12 14 16x 10
-3 time, s P o w e r o u tp u ts ( p u M W) a re a -1 Hydro Gas Thermal
0 10 20 30 40 50 60 70 80 90 100 -2 -1 0 1 2 3 4 5x 10
-3 time, s P o w e r o u tp u t (p u M W) a re a -2
0 10 20 30 40 50 60
-0.06 -0.05 -0.04 -0.03 -0.02 -0.01 0 0.01 0.02 0.03 time, s F re q u e n c y D e v ia ti o n ,a re a -1 (H z
) 1% SLP2% SLP
[image:4.595.321.542.477.651.2] [image:4.595.63.277.542.725.2]Fig. 9: Frequency deviation response, area-2 for 1%-3% SLP variation
Fig. 10: Tie line power deviation response for 1%-3% SLP variation
5.
CONCLUSION
Particle Swarm Optimization (PSO) based Proportional plus Integral (PI) controller has been presented for the Load Frequency Control (LFC) system of an interconnected power system. The power system comprises multi-source power generation which is more pragmatic. The presented PSO algorithm gives promising convergence characteristics. Area frequency deviations settle quickly and the dynamic responses are less oscillatory with low amplitude of peak over shoots. The tie line power deviation settles with zero steady state errors. The frequency and tie line power attain their corresponding nominal values. The contribution of generating units matches the desired value in response to SLP. The controller performs well for 1% to 3% variation in SLP which shows its robustness. The dynamic responses satisfy the LFC requirements. The PSO based PI controller is efficient to cope up the LFC problem.
APPENDIX A Power System Parameters
0
12
1 1
2000 (Rated capacity of each area) 1740 MW (Nominal load of each area) 60 Hz,
5 MWs/MVA 0.0145 pu MW/Hz,
68.9655 Hz/pu MW, 11.49 s,
0.06 s, 0.3 s, 0.0433,
rt
L
PS
PS
SG T
TH HY
P MW
P f H D K
T
T T
T
R R R
1
2
1 2 12
2.4 Hz/puMW, 2.4 Hz/puMW,
0.4312, 1, 1.1s, 5s,
28.75s,
0.2 s, 0.6 sec, 1s,
1, 0.05s, 0.23s, 0.01s, 0.2s
G
TH
W RS
RH
GH G
G
g g F
CR CD
R
B B a
T T
T
T X
Y
c b T
T T
6.
REFERENCES
[1] Kothari DP, Nagrath IJ. Modern power system analysis. 4th ed. New Delhi: Tata McGraw Hill; 2011.
[2] Elgerd OI. Electric energy system theory: an introduction. 2nd ed. New York: McGraw Hill; 1983.
[3] Kundur P. Power system stability and control. 5th reprint. New Delhi: Tata McGraw Hill; 2008.
[4] Bevrani H. Robust power system frequency control. New York: Springer; 2009.
[5] Ibraheem, Kumar P, Kothari DP. Recent philosophies of automatic generation control strategies in power systems. IEEE Trans Power Syst 2005;20(1):346–57.
[6] Parmar KPS, Majhi S, Kothari DP. Automatic generation control of an interconnected hydrothermal power system. In: IEEE conference on proceedings, INDICON. Kolkata, India; 2010.
[7] Parmar KPS, Majhi S, Kothari DP. Multi-area load frequency control in a power system using optimal output feedback method. In: IEEE conference on proceedings, PEDES. New Delhi, India; 2010.
[8] Yazdizadeh A, Ramezani MH, Hamedrahmat E. Decentralized load frequency control using a new robust optimal MISO PID controller. Int J Electr Power Energy Syst 2012; 35:57–65.
[9] H. Shayeghi, H. A. Shayanfar. Application of ANN technique for interconnected power system load frequency control. Int J Eng., vol. 16, no. 3, pp. 247 – 254, 2003.
[10]S. Ramesh, A. Krishnan. Fuzzy rule based load frequency control in a parallel AC-DC interconnected power systems through HVDC link. International Journal of Computer Applications, vol. 1, no. 4, 2010.
[11]C. S. Chang, W. Fu. Area load frequency control using fuzzy gain scheduling of PI controllers. Electr Power
0 10 20 30 40 50 60
-0.025 -0.02 -0.015 -0.01 -0.005 0 0.005 0.01
time, s
F
re
q
u
e
n
c
y
D
e
v
ia
ti
o
n
,a
re
a
-2
(H
z
) 1% SLP2% SLP
3% SLP
0 10 20 30 40 50 60
-7 -6 -5 -4 -3 -2 -1 0 1x 10
-3
time, s
T
ie
l
in
e
P
o
w
e
r
D
e
v
ia
ti
o
n
(
p
u
M
W)
[12]E. Cam, I. Kocaarslan. Load frequency control in two area power system using fuzzy logic controller. J. Energy Conversion and Management, vol. 45, pp. 233 – 245, 2005.
[13]P. Bhatt, R. Roy, S. Ghoshal. GA/particle swarm intelligence based optimization of two specific varieties of controller devices applied to two-area multi-units automatic generation control. Int. Journal of Electrical Power and Energy Syst., vol. 32, no. 4, pp. 299 – 310, May 2010.
[14]Sudha KR, Santhi RV. Robust decentralized load frequency control of interconnected power system with generation rate constraint using type-2 fuzzy approach. Int J Electr Power Energy Syst 2011;33:699–707.
[15]Chandrakala KRMV, Balamurugan S, Sankaranarayanan K. Variable structure fuzzy gain scheduling based load frequency controller for multi-source multi-area hydro thermal system. Int J Electr Power Energy Syst 2013;53:375–81.
[16]Panda S, Yegireddy NK. Automatic generation control of multi-area power system using multi-objective non-dominated sorting genetic algorithm-II. Int J Electr Power Energy Syst 2013;53:54–63.
[17]Bevrani H, Hiyama T. Intelligent automatic generation control. New York: CRC Press; 2011.
[18]Tyagi B, Srivastava SC. A decentralized automatic generation control scheme for competitive electricity markets. IEEE Trans Power Syst 2006;21(1):312–20.
[19]Tyagi B, Srivastava SC. A LQG based load frequency controller in a competitive electricity environment. Int J Emerging Elect Power Syst (online) 2005:2. <http://www.bepress.com/ijeeps/vol2/iss2/art1044>.
[20]Ramakrishna KSS, Bhatti TS. Automatic generation control of single area power system with multi-source power generation. Proc IMechE: J Power Energy 2008;222(A):1–11.
[21]Ramakrishna KSS, Sharma P, Bhatti TS. Automatic generation control of interconnected power system with diverse sources of power generation. Int J Eng Sci Technol 2010;2(5):51–65.
[22]Challa KK, Rao PSN. Analysis and design of controller for two area thermal-hydro- gas AGC system. In: IEEE conference on proceedings, PEDES. New Delhi, India; 2010.
[23]Parmar KPS, Majhi S, Kothari DP. Load frequency control of a realistic power system with multi-source power generation. Int J Electr Power Energy Syst 2012;42:426–33.
[24]Parmar KPS, Majhi S, Kothari DP. LFC of an interconnected power system with thyristor controlled phase shifter in the tie line. Int J Comput Appl 2012;41(9):27–30.
[25]Parmar KPS, Majhi S, Kothari DP. Improvement of dynamic performance of LFC of the two area power system: an analysis using MATLAB. Int J Comput Appl 2012;40(10):28–32.
[26]IEEE power engineering systems committee report. Dynamic models for steam and hydro turbines for power systems studies. IEEE Trans Power App Syst 1973;PAS-92.
[27]IEEE power engineering systems committee report. Hydraulic turbine and turbine control models for system dynamics. IEEE Trans Power Syst 1992;PWRS-7.
[28]Working group on prime mover and energy supply models for system dynamic performance studies. Dynamic models for combined cycle plants in power system studies. IEEE Trans Power Syst 1994; 9(3):1698– 708.
[29]J. Kennedy, R. Eberhart. Particle swarm optimization. Proceedings of IEEE Int. Conf. on Neural Networks, vol. 4, pp. 1942-1948, 1995
[30]Y. Shi, R. Eberhart. A modified particle swarm optimizer. Proceedings of IEEE Int. Conf. on Evol. Comput., pp. 69-73, 1998
[31]Y. Shi, R. Eberhart. Empirical study of particle swarm optimization. Proceedings Congr. Evol. Comput., NJ, pp. 1945-1950, 1999.