Published Online January 2014 (http://www.scirp.org/journal/eng) http://dx.doi.org/10.4236/eng.2014.61002
Injection Scheme Optimization of Foam Profile
Control on Block S103
Hongjun Yin1,2, Chuan Liu1,2, Meinan Wang1,2 1
Accumulation and Development of Unconventional Oil and Gas, State Key Laboratory Cultivation Base Jointly-Constructed by Heilongjiang Province and the Ministry of Science and Technology, Northeast Petroleum University, Daqing, China
2
Key Laboratory of Ministry of Education PRC, Northeast Petroleum University, Daqing, China Email: [email protected]
Received September 12, 2013; revised October 12, 2013; accepted October 19, 2013
Copyright © 2014 Hongjun Yin et al. This is an open access article distributed under the Creative Commons Attribution License, which permits unrestricted use, distribution, and reproduction in any medium, provided the original work is properly cited. In accor-dance of the Creative Commons Attribution License all Copyrights © 2014 are reserved for SCIRP and the owner of the intellectual property Hongjun Yin et al. All Copyright © 2014 are guarded by law and by SCIRP as a guardian.
ABSTRACT
Facing problems with oil production decreasing quickly and water content increasing gradually in S103 well area, the Foam Profile Control was studied on the basis of its confirmed agent formula. The facies-controlled geological model of S103 well area was generated using random model based on Petrel software and using nu-merical simulation based on CMG software. Gas liquid alternating injection pattern was optimized as the optim-al solution through the simulation optimization. Two months are optimized as the optimoptim-al solution through the simulation optimization. The cumulative oil production is 0.933 × 10⁷ kg which is higher than the value of sub-sequent water flooding and the other three. Finally, it reaches the goals of slowing down the production decline and controlling the water rising.
KEYWORDS
Foam Profile Control; Numerical Simulation; Injection Pattern; Injection Cycle
1. Introduction
The technology of foam depth profile control has more than 30 years of history. Overseas, a research done by Marsden and Khan [1] concluded: Foam can slow down or even cut off the flow of high permeability zone, thus solving the problem of fluid injection displacement in the heterogeneous reservoir. The effect of CO2 foam
flood-ing is studied by Owette [2]. Alexandrov [3] et al. stu-died the rule of foam filtration at porous medium. In our country, Li Zhengquan [4] verified that the foam based on polymer aqueous solution can improve the sweep ef-ficiency of foam flooding; Du Qingjun [5]set up multi-component mathematical seepage model of polymer; Pei
et al. [6] analyzed the influence of gas fluid ratio, slug size, viscosity of crude oil on polymer aqueous based foam displacement efficiency. Nowadays, oil fields are in high water cut or in extremely high water cut; thus, water flooding problem is more and more complicated. Stabi-lizing oil water control technology, such as, profile con-trol, is more and more difficult. The traditional small
radius of profile control can no longer meet the require-mentsof stabilizing oil water [7,8]. The situation pro-motes the innovation and development of technology, especially in the application of the deep profile control liquid flow and improvement of the high water cut oil-field water injection [9].
to increase the sweep volume injection and change the underground flow field. The injection of medium can influence high oil saturation area, which can help to de-velop crude oil, slow down production decline, control water cut rising and improve oil recovery.
2. Block S103 Numerical Simulation
Research
The P oil layer is the main mining of S103 block, oil- bearing area is 2.56 × 10⁶ m2, geological reserves is 99.54 × 10⁷ kg, recoverable reserves is 23.25 × 10⁷ kg, air permeability is 47.3 × 10⁻¹⁵ m2 on average, the poros-ity is 22.7%, crude oil densporos-ity on the ground is 0.859 × 10³ kg/m3, average single well effective thickness of S103 block was 11.6 m, the number of well there is 108, of which the number of oil well is 81 and the number of water well is 27. By using Petrel and S103 block’s actual geological data, we established a phased geological modeling which based on the method of random model-ing. By CMG, we also establish a numerical model and tried to match the history in order to predict further de-velopment.
On the basis of establish fracture system, we divided S103 block into 137 × 144 = 19728 non-uniform angular point grid. By combining stratigraphic dip data, geologi-cal understanding and fracture system, we establish a reasonable structure model, which edge was based on the location of three major faults, and closed boundary was determined by strike. In order to guarantee the accuracy of the prediction scheme of initial conditions, we did mining history matching first, the fitting time was August 2000 to June 2011.
After forming initialization parameter field, in combi-nation of geological, well logging and reservoir engi-neering analysis data, we revised the porosity, effective thickness and other uncertain parameters, after many pretreatment check, pre-processing, iterative fitting, the initialization of the reserves calculation is accordance with geological reserves, fitting reserves was 194.55 × 10⁷ kg. As shown inTable 1.
Fitting to June 2012, the actual integrated moisture content was 17.56%, which the fitting of integrated moisture content was 17.98%, the error was 2.4%. The moisture content of producing fluid volume and fitting are shown in Figures 1 and 2.
3. Research of Profile Control Agent
Injection Solution in P Oil Layer of Block
S103
3.1. The Determination of Profile Control Well Group
There were 77 wells drilled in P oil layer in block S103, 21 of them were water wells, which the rest were oil wells. Among them, the number of wells that are high in water cut oil is 14 (see Table 2), which mainly distri-buted in the center of block S103.
[image:2.595.310.537.327.478.2]The blocks in high water cut wells were controlled by 7 water wells, they were S103, S58-44, S60-44, S61-43,
[image:2.595.310.537.533.573.2]Figure 1. Fitting curve of fluid withdrawal rate in S103 wellblock.
Table 1. Reserves fitting results. Geological reserves
(107 kg)
Fitting of reserves (107 kg)
The relative error (%)
193.54 194.55 0.52
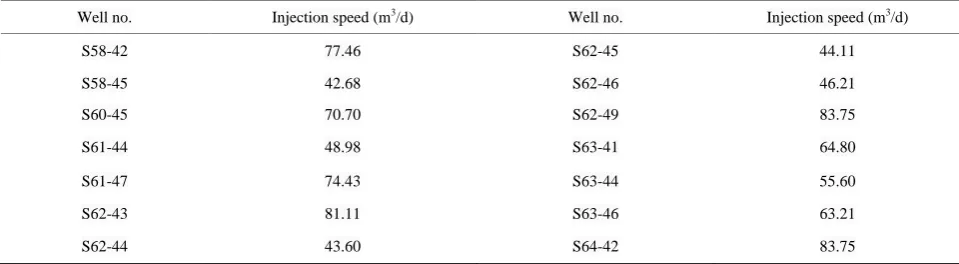
Table 2. High water cut oil wells in P reservoir of block S103.
Well no. Injection speed (m3/d) Well no. Injection speed (m3/d)
S58-42 77.46 S62-45 44.11
S58-45 42.68 S62-46 46.21
S60-45 70.70 S62-49 83.75
S61-44 48.98 S63-41 64.80
S61-47 74.43 S63-44 55.60
S62-43 81.11 S63-46 63.21
S62-44 43.60 S64-42 83.75
[image:2.595.57.537.603.735.2]9
Figure 2. Fitting curve of the composite water cut in S103 wellblock.
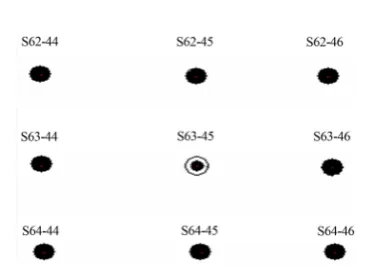
S61-45, S63-43, S63-45. We selected S63-45, a high water cut wells, as the research object. Wells S63-45 is connected by 8 oil wells, they were S62-44, S62-45, S62-46, S63-44, S63-46, S64-44, S64-45, S64-46, as shown in Figure 3.
3.2. Reasonable Injection Pattern Optimization
There are two ways of foam profile control agent injec-tion: gas-liquid mixing injection and gas-liquid alternat-ing injection. We design three kinds of profile control scheme to optimizating of the above two kinds of injec-tion way,for using the foam profile control agent formu-la system is: the polymer molecuformu-lar weight is 8 million, polymer concentration of 1 kg/m3, the surfactant concen-tration is 0.25wt%, gas liquid ratio of 1:1. Profile control scheme as follows:
Solution 1: since July 1, 2012 used the method of wa-ter flooding until the wawa-ter cut reaches to 98%.
Solution 2: since July 1st in 2012, the foam profile control agent was maxing injected; the injection rate was
1.273 × 10⁻⁴ m3/s, and then used the method of water flooding until the water cut reaches up to 98%.
Solution 3: since July 1st in 2012, the foam profile control agent had been alternating injected. CO2 was
jected after the foaming agent solution was firstly in-jected with the two month injection cycle and the injec-tion rate of 1.273 × 10⁻⁴ m3/s, and the subsequent water flooding ends until the water cut reaches up to 98%.
Three profile control schemes were studied by numer-ical simulation method using CMG software in well group S63-45 of reservoir P in S103 block. According to simulation results, we draw out moisture content and oil content curve which changing with time, as shown in
Figures 4and 5.
[image:3.595.330.513.70.203.2]Through Figures 4and5, we can see that after profile control by different injection ways, after a period of time, moisture content will continue to rise, oil production will continue to fall, which means profile control measures is
Figure 3. Location map of Well group S63-45.
Figure 4. Test well group comprehensive water cut curve over time under different injection modes.
Figure 5. Oil production changing with time curve under different injection modes.
not work, then the moisture content decline, oil produc-tion rising, which shows that profile control measures work. We concluded that about nine months after the mixed way would be effective, about 3 months after the alternating injection way would be effective. Alternating injection decreases the moisture content and increases the oil content, which shows that the effect of alternating injection profile control is better than mixing injection.
Table 3 shows oil production and the change of mois-ture content after the profile control measures are adopted by profile control well group under the different injection ways.
We can see from the Table 3, oil wells with the high-est cumulative oil production is alternating injection mode in research block, 13.750 × 10⁷ kg, 0.933 × 10⁷ kg
20 40 60 80 100
2012-7-1 2016-7-1 2020-7-1 2024-7-1 2028-7-1 2032-7-1
Time
T
he
m
oi
st
ur
e
c
ont
e
nt
(
%
)
Water drive Alternating injection Mixed injection
0 1 2 3 4 5 6 7 8 9
2012-7-1 2016-7-1 2020-7-1 2024-7-1 2028-7-1 2032-7-1
Time
D
a
ily
o
il p
ro
d
u
c
tio
n
(t/d
[image:3.595.59.287.87.238.2] [image:3.595.312.536.231.350.2] [image:3.595.309.534.386.512.2]Table 3. Profile control simulation results by different injection ways.
Solution Injection pat-tern
Cumulative oil production
(107 kg)
Than water flooding on oil increase (107 kg)
The highest rising
oil (kg/s)
Within the profile control measures the average
growing oil (103 kg)
High moisture content value (%)
Profile control measures average moisture content decreases in value (%)
1 Water drive 12.817 — — — — —
2 Mixed injection 13.583 0.767 100 0.57 9.16 4.50
3 Alternating
injection 13.750 0.933 174.59 1.39 15.94 10.97
higher than to water drive, 0.167 × 10⁷ kg higher than mixed injection; during July 1, 2012 and July 1, 2015 the decline of average growing oil and average daily mois-ture content in profile control measures are higher than in mixed injection, which shows that alternating injection profile control effect is better than mixed injection.
3.3. Reasonable Injection Cycle
Foam profile control effect is not the same under differ-ent injection cycles. In determining the injection pattern of alternating injection, there are four design solutions for injection cycle, profile control scheme as follows:
Solution 4: foam profile control agent was injected in the form of alternating injection since July 1, 2012, the injection cycle is 2 months, the injection rate is 11 m3/d, the time profile control is 3 years, then water flooding to 98% water cut.
Solution 5: foam profile control agent was injected in the form of alternating injection since July 1, 2012, the injection cycle is 4 months, the injection rate is 1.273 × 10⁻⁴ m3/s, the time of profile control is 3 years, then wa-ter flooding to 98% wawa-ter cut.
Solution 6: foam profile control agent was injected in the form of alternating injection since July 1, 2012, the injection cycle is 6 months, the injection rate is 1.273 × 10⁻⁴ m3/s, the time of profile control is 3 years, then wa-ter flooding to 98% wawa-ter cut.
Solution 7: foam profile control agent was injected in the form of alternating injection since July 1, 2012, the injection cycle is 12 months, the injection rate is 1.273 × 10⁻⁴ m3/s, the time of profile control is 3 years, then wa-ter flooding to 98% wawa-ter cut.
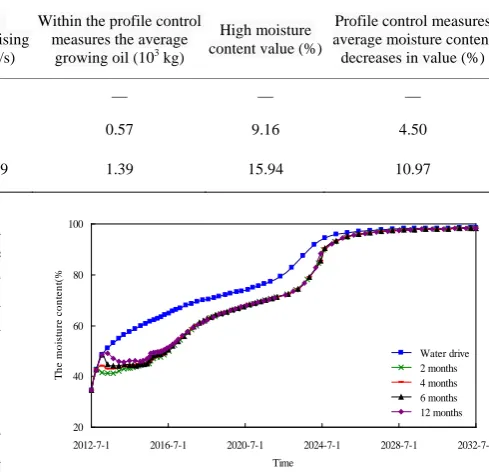
According to the results of the simulation output, we drew curves to show the change of moisture content and oil content with time (as shown inFigures 6 and7).
We can see from Figures 6and 7, when taking differ-ent injection cycles for profile control after a period of time, moisture content will continue to rise, and oil pro-duction continues to fall, profile control measures is not effective in this period of time, then the moisture content decreases, the oil production increases, which show that profile control measures are effective. When the injection cycle is 2 months, the result is shown earliest; however,
Figure 6. Comprehensive water cut curve of change over time of test well group under different injection cycle.
Figure 7. The curves of daily oil production over time of test well group under different injection cycles.
when injection cycle is 1 year, the result is shown latest. Thus we can conclude that the shorter the injection cycle, the more obvious of the increase of the moisture content and oil production rate.
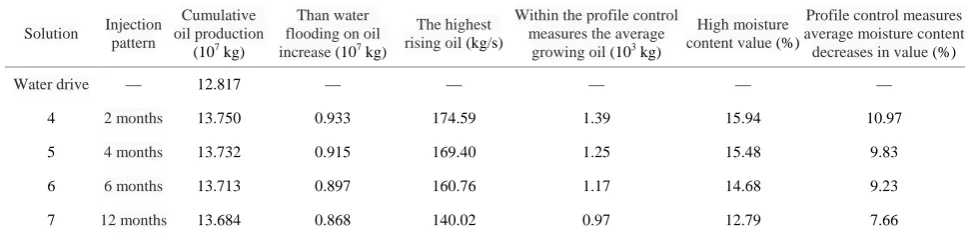
Table 4 shows cut oil production after the profile con-trol well group profile concon-trol measures and the change of moisture content under the different injection cycle.
We can see from the Table 4, the shorter the injection cycle, the higher cumulative oil production of oil wells in block, the average oil increases, daily average moisture content decreases under the profile control measures. The best effect of profile control can be seen when the injec-tion cycle is 2 months, the cumulative oil producinjec-tion of 13.750 × 10⁷ kg, higher than to water drive by 0.933 × 10⁷ kg, and also higher than other injection cycle. That indicates that the injection cycle of foam profile control agent is 2 months in P oil layer.
20 40 60 80 100
2012-7-1 2016-7-1 2020-7-1 2024-7-1 2028-7-1 2032-7-1 Time
T
he
m
oi
st
ur
e
c
ont
e
nt
(%
Water drive 2 months 4 months 6 months 12 months
0 1 2 3 4 5 6 7 8 9
2012-7-1 2016-7-1 2020-7-1 2024-7-1 2028-7-1 2032-7-1 Time
D
ai
ly oi
l pr
oduc
tion(
t
/d
)
[image:4.595.312.533.378.494.2]11
Table 4. Profile control simulation results of different injection cycles.
Solution Injection pattern
Cumulative oil production
(107 kg)
Than water flooding on oil increase (107 kg)
The highest rising oil (kg/s)
Within the profile control measures the average
growing oil (103 kg)
High moisture content value (%)
Profile control measures average moisture content decreases in value (%)
Water drive — 12.817 — — — — —
4 2 months 13.750 0.933 174.59 1.39 15.94 10.97
5 4 months 13.732 0.915 169.40 1.25 15.48 9.83
6 6 months 13.713 0.897 160.76 1.17 14.68 9.23
7 12 months 13.684 0.868 140.02 0.97 12.79 7.66
4. Conclusion
1) According to the production characters of P reser-voir of S103 block, we determine 14 high water cut oil wells and 7 water wells connected with them, and apply the profile control measures to water wells S63-45.
2) When it comes to the selection of the injection mode, the effects of alternating profile control injection work are six months earlier than the mixed injection; the cumulative oil production of alternating profile control injection is higher than mixed injection by 0.167 × 10⁷ kg; the value of the average water cut is lower than mixed injection by 6.47%. These data show that alternating in-jection is better than mixed inin-jection.
3) On the injection cycle, when the injection cycle is 2 months, cumulative oil production is 13.75 × 10⁷ kg, and the water cut decreases by 10.97%. The scheme is better than others, so the reasonable injection cycle of foam profile control agent is 2 months in layer P of block S103.
REFERENCES
[1] Z. L. Khatib, G. J. Hirasaki and A. H. Falls, “Effects of Capillary Pressure on Coalescence and Phase Mobilities in Foams Flowing Through Porous Media,” SPE Reser-voir Engineering, Vol. 3, No. 3, 1988, pp. 919-926. http://dx.doi.org/10.2118/15442-PA
[2] A. W. Fisher, R. W. S. Fouiser and S. G. Goodyear, “Mathematical Modeling of Foam Flooding,” SPE/DOE
Enhanced Oil Recovery Symposium, Tulsa, 22-25 April 1990, pp. 231-240.http://dx.doi.org/10.2118/20195-MS [3] E. M. Ozbayoglu, S. Akin and T. Eren, “Foam
Characte-rization Using Image processing Techniques,” SPE West-ern Regional Meeting, Irvine, 30 March-1 April 2005, pp. 1-8.
[4] Z. Q. Li, G. H. Zhou and Z. M. Zhou, “The Feasibility Studies of Polymer Foam Flooding in Gudao Oilfield,” SPE Asia Pacific Oil & Gas Conference and Exhibition, Adelaide, 11-13 September 2006, pp. 1-8.
[5] Q. J. Du, J. Hou, Z. Q. Li, Y. D. Wang and Y. M. Chen, “A Mathematical Model of Polymer Enhanced Foam Flooding,” Chinese Journal of Computational Physics, Vol. 26, No. 6, 2009, pp. 872-878.
[6] H. Pei, G. Zhang, J. Ge, J. Wang, B. Ding and X. Liu, “Investigation of Polymer-Enhanced Foam Flooding with Low Gas/Liquid Ratio for Improving Heavy Oil Recov- ery,” Canadian Unconventional Resources and Interna-tional Petroleum Conference, Calgary, 19-21 October 2010, pp. 1-11.http://dx.doi.org/10.2118/137171-MS [7] Q. L. Gang, “High Water Cut Stage Oilfield New
Tech-nologies to Improve Water Flooding Effect (on),” 1st Edition, Petroleum Industry Press, Beijing, 1999. [8] J. E. Smith, “Quantative Evaluation of Polyacrylamide
Crosslinked Gels for Use in Enhanced Oil Recovery,” In-ternational ACS Symposium, Anahemi, September, 1986, pp. 9-12.