© 2018, IRJET | Impact Factor value: 6.171 | ISO 9001:2008 Certified Journal | Page 4312
A CASE STUDY FOR THE APPLICATION OF THE EMPIRICAL METHODS
TO ESTIMATE A ROCK FILL DAM SEISMIC BEHAVIOR
Sobhi Al Mawla
1, Fadi Hage Chehade
2, Fouad Kaddah
31
Lebanese University
,Lebanon
2Saint-Joseph University, Lebanon
---***---Abstract -
The rock fill dams have shown good resistance to earthquake incidents all over the world, minor damages were observed on the dam body after a seismic excitation. The geotechnical domain has known a notable progress in the last decades, especially for the dynamic problems, through powerful software allowing for a numerical analysis able to predict the soil response to several types of loads. As being agreed, the numerical analysis requires specific knowledge about the simulation and the modeling process as well as time consumption. The empirical methods, despite their limited capacity to predict the real reaction of soils to variable loads, still are simplified tools, helping to estimate the general features of the material response. In this work, a concrete face rock fill dam is studied to evaluate its response and deformations according to the widespread empirical approaches. First of all, the design earthquakes recommended by the international committee on large dams (ICOLD) are assigned based on the dam site and the existing fault system. The attenuation of ground motions between the seismic source and the location considered is quantified, then the settlement at the crest is computed with various methods available in the literature as well as the ground motion amplification along the dam body.Key Words: dam, earthquake, fault, response, settlement, deformation, stability.
1. INTRODUCTION
The construction of the dams causes rational changes on the ground, the large mass of the reservoir and the body of the dam brings additional constraints, thus modifying the static state. At the same time, the infiltration of the water from the reservoir to the deep layers of the earth, taking place whatever is the waterproofing system used, may cause the lubrication of the tectonic plates. As a consequence, these changes in areas of high seismic activity or close to faults can certainly contribute to the occurrence of an earthquake or at least minimize the return period. Noting that in the case of a dam, the damage caused by an earthquake is catastrophic and much more threatening than that resulting from a building struck by dynamic action, the collapse of a dam and the release of water from reservoir, are capable of destroying agricultural, industrial and residential areas and
zones. Over here, the engineers take care of dam construction in a deep way.
The location of the dam with reference to the active faults and the fault rupture length are the main factors to be assigned for the earthquake impact assessment. Mark (1977) has remarked the dependency of the magnitude to the average rupture length, and proposed a logarithmic relation between the two parameters. Housner &Jennings (1982) have classified the magnitudes, they defined the local Ml, surface wave Ms, body wave Mb, and moment Mw magnitudes. They proposed an estimation of the earthquake generated by a fault according to its rupture length through a chart. Bonilla et al (1984) have repeated the work and elaborated another version of the chart by combining all previous seismic cases recorded in the history.
The magnitude and the corresponding fault being determined; another specific feature of the seismic excitation is the peak ground acceleration. Davenport (1972) has presented an acceleration attenuation curves after working on the existing records of the ground motions, his study adopted the regression law. Schnabel and Seed (1973), focused on the site at the western United States, and suggested another concept for the attenuation of ground acceleration. Seed and Idriss (1982) continued in the same context to characterize the ground motion during earthquakes for highest magnitudes.
© 2018, IRJET | Impact Factor value: 6.171 | ISO 9001:2008 Certified Journal | Page 4313 the dam base up to the crest level. After observing previous
amplification magnitude along the past dams’ reactions, he proposed a graph assembling measured accelerations for rock fill dams.
1.1
Problem under consideration
Despite the evolution of the numerical analysis well widespread in the geotechnical field, we still have the opportunity to estimate a response of rock fill dam using the empirical approaches, in order to obtain a general idea about the tendency of behavior. The case we are dealing with, is a rock fill dam of 61m height, the Qaraoun dam in Lebanon constructed at the Beqaa valley. The Lebanese land is subjected to a high seismic activity, through the past years, strong earthquakes have occurred and the damages were not negligible at all. Based on the empirical methods, the closest fault was detected from the Lebanese restraining bend map, and the position of the dam regarding this fault was assigned. The magnitude of the earthquake that could be generated by this fault was treated by the attenuation law to identify the possible peak ground acceleration at the dam zone. Then, the empirical methods are applied for the case, the response of the dam was evaluated, as well as the crest settlement, the maximum displacement and the acceleration amplification along the dam body.
2. SEISMIC HAZARD
2. 1 Maximum credible earthquake MCE
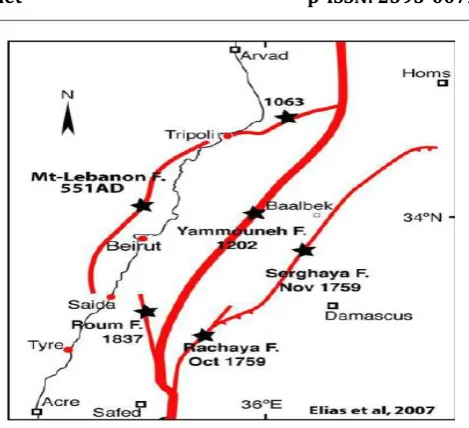
According to the dam site, the Yammouneh fault is the closest one, it’s about 2.5 Km to the west (Fig.1). the empirical study of this fault starts by characterizing the earthquake that could be liberated from this fault, the rupture length being 160 Km, by applying the Bonita method, the expected earthquake to be generated is of magnitude 8 (Fig.2). As for the method of Housner and Jennings, the corresponding chart gives a magnitude of 7.6. those values are the magnitudes of the maximum credible earthquake, for the rest of the work the MCE is adopted 7.8, as being the worst case scenario.
[image:2.595.319.554.61.275.2]Fig-1
:
Lebanese fault systemFig-2: magnitude of the seismby Bonilla’s method (1984).
[image:2.595.321.548.319.505.2] [image:2.595.330.537.545.716.2]© 2018, IRJET | Impact Factor value: 6.171 | ISO 9001:2008 Certified Journal | Page 4314
2.2 Maximum Design Earthquake MDE and
Operating Basis Earthquake OBE
The MDE and the OBE can be determined from probabilistic methods. The return period of these events is obtained through the following relation:
Tm=[1–(1 – P) 1/Td]-1
(1)
Where P is the probability of occurrence (assumed as 10% for MDE and 50% for OBE), and Td is the life duration of the dam (100 years). The MDE average return period is 950 years and the OBE average return period is 145 years. The relationships proposed for the Dead Sea fault system in the Earthquake Hazard of Lebanon are adopted for the estimation of the MDE and OBE earthquakes as per the Gutenberg-Richter equations:
Ms < 7.2: LOG (N ≥ Ms) = 3 – 0.73 Ms (2) Ms ≥ 7.2: LOG (N ≥ Ms) = 14.8 - 2.73 Ms(3)
Where N is the number of earthquakes with magnitude ≥ Ms per year.
=> MDE = 7.50 and OBE = 7.07
2.3 The peak ground acceleration
In order to define the PGA resulting from each earthquake, the empirical research of Seed & Idriss (1982), is reconsidered. The figure 4 shows the following findings:
MCE=7.8 ===
PGA = 0.69g MDE = 7,50 ===
PGA =0,68 g. OBE = 7,07 ===
PGA= 0,66 g.Fig-4: Estimation of Peak Ground Acceleration (SEED & IDRISS- 1982)
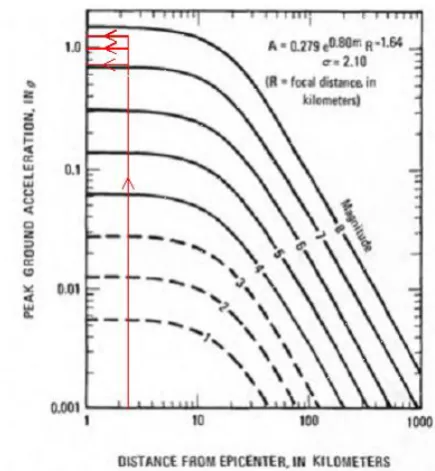
The Davenport’s graph is used as well (Fig.5), the PGA of each earthquake is as follows:
MCE : 1.2g MDE : 1.0g
[image:3.595.323.541.104.340.2] [image:3.595.297.560.545.733.2]OBE : 0.7g
Fig-5: Estimation of Peak Ground Acceleration (Davenport 1972)
At the following segments, the Seed-Idriss method is considered only for it has been more adopted in all similar works due to its detailed and validated values.
3. DAM RESPONSE EVALUATION
3.1 Swaisgood’s method (1993)
As per the graph illustrated in figure 5, the MCE leads to a settlement of 2.44m (4% of the dam height which is 61m), the MDE causes a settlement of 1.83m, and the OBE causes a settlement of 1.22m.
© 2018, IRJET | Impact Factor value: 6.171 | ISO 9001:2008 Certified Journal | Page 4315
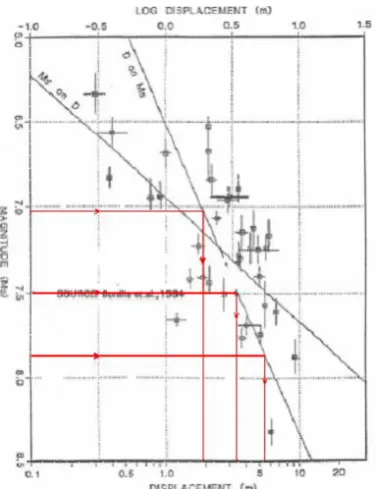
3.2 Bonilla’s (1984)
The maximum displacements induced in the dam according to Bonita et al (1984) are extracted from figure 6. The MCE leads to 5.5m, the MDE leads to 3.5, the OBE leads to 1.8m displacement.
Fig-6: Estimation of maximum displacement by Bonita’s method (1984)
3.3 Bureau’s method (1997)
The rock fill of the Qaraoun dam was investigated by Makdessi (2012), the average value of the internal friction angle is about 47. This value is implemented in Bureau’s graph in figure 7, where each of the previously defined earthquakes are applied by their earthquake severity index ESI, which is defined by:
[image:4.595.318.547.136.212.2](4)
Fig-6: Estimation of maximum displacement by Bonita’s method (1984)
[image:4.595.67.257.168.413.2]The table 1 summarizes the results of the Bureau approach
Table -1: application of the Bureau’s method on the Qaraoun dam
earthquake PGA(g) ESI RCS Net Settlement
(m)
OBE 0.66 11.2 0.25 0.15
MDE 0.68 18.36 0.6 0.54
MCE 0.69 26 1.2 1.09
3.4 Jansen’s method (1994)
The peak ground accelerations of the design earthquakes are not properly illustrated in the margin of Jansen graph, but based on the pace of the curve, an amplification ratio between 1 and 1.4 is expected for the dam.
Fig-7 :Jansen 1994-unpublished(ICOLD)
[image:4.595.340.502.296.423.2]3.5 Comparison of the empirical methods’ findings
regarding the settlement of the crest
Table -2: main results of the empirical methods
SWAISGOOD BONITA BUREAU
MCE 2.44 5.5 1.09
MDE 1.83 3.5 0.54
OBE 1.22 1.8 0.15
The table 2, shows a notable difference of the induced crest settlement at the Qaraoun dam between the considered 3 methods. The displacement increases with the PGA for the 3 methods.
3. CONCLUSIONS
[image:4.595.50.282.555.734.2]© 2018, IRJET | Impact Factor value: 6.171 | ISO 9001:2008 Certified Journal | Page 4316 modelled in 2012 by Makdessi using the finite difference
software Flac, the applied earthquake signal was the Tabas earthquake of magnitude 7.4 and PGA=0.8g. The simulation results were in good agreement with the Bureau method, the findings of Bonita and Swaisgood methods were exaggerated. The amplification ratio extracted from Jansen approach was also close to the result of the numerical simulation.
4. REFERENCES
[1] Mark.R. K, application of linear statistical models of
earthquakes magnitudes versus fault length in estimating maximum expectable earthquakes, Geology, p 465,1977.
[2] Housner G. W. & Jennings P. C, Earthquake Design
Criteria.,EERI Monograph Series, Earthquake Engineering Research Institute, Oakland, C.A,1982.
[3] Bonilla.M.G, Statistical Relations Among Earthquake
Magnitude, Surface Rupture Length, and Surface Fault Displacement. US Geological Survey Open-File Report 84-256, 1984.
[4] Davenport, A. J, A statistical relationship between shock
amplitude, magnitude, and epicentral distance and its application to seismic zoning: Western Ontario University, Eng. Sci. Research Rept. BLWT-4-72, 19 p.1972.
[5] Seed, H. B., & Idriss, I. M, Ground motions and soil
liquefaction during earthquakes, Berkeley, CA: Earthquake Engineering Research Institute, p. 134,1982.
[6] Swaisgood J.R, estimating deformation of embankment
dams caused by earthquakes, presented at the association of state dam safety officials Western region conference, Montana, 1995.
[7] Bureau, G. Evaluation methods and acceptability of
seismic deformations in embankment dams. Proc. 19th Cong. on Large Dams Florence, Italy, pp. 500-510,1997.
[8] Jansen, unpublished plot, Measured ratios of crest and
base accelerations at embankment dams in response to earthquake, 1994.
[9] The Litani river authority, www.litani.gov.lb.
[10]Interim report on Qaraoun dam site, volume 1&2, Litani
river basin development staff, Lebanon, June 1953.
[11]Amer Elnashai & Ramy Elkhoury, earthquake Hazard in
Lebanon,2004.
[12]Faiz Makdessi, seismic deformations of the Qaraoun