Journal of Chemical and Pharmaceutical Research, 2014, 6(6):1600-1608
Research Article
CODEN(USA) : JCPRC5
ISSN : 0975-7384
The study of methods to get irregular surfacetopography and its
impact on friction performance
Wang Jing
1,2, Zhou Jie
1*and Zhang Jiansheng
11
College of Materials Science and Engineering, Chongqing University, Chongqing, China
2
Chongqing Technology & Business Institute, Chongqing, China
____________________________________________________________________________________________
ABSTRACT
To get irregular surface topography efficiently, various processing methods were compared and the chemical etching method, which is simple to operate and cheap to use was chosen to process the irregular surface topography of cold work die steel Cr12. Then the relationship between the surface topography and the corrosive agents as well as the corrosion time was analyzed. Different kinds of corrosive agents resulted in different surface topography under the same corrosion time and the stronger the corrosivity was, the shorter time it took to get corrosion pits, which enhanced the sensibility to corrosion time. To research the impact of irregular surface topography on the friction performance of die surface, wear tests of samples with both smooth surface and irregular surface topography was performed under starved-oil lubrication. After analyzing the friction coefficient of twelve specimens, conclusions can be drawn as follows: irregular surface topography can reduce the friction coefficient of die surface effectively; the value of friction coefficient has a strong relationship with the density of contact peaks and, under certain surface topography, the denser the contact peaks are, the smaller the friction coefficient is; the friction coefficient increases first, and then decreases when the corrosion pits get bigger and deeper.
Keywords: irregular surface topography; corrosion pits; starved-oil lubrication; friction coefficient.
____________________________________________________________________________________________
INTRODUCTION
tape by laser surface texturing the cylindrical guides[6].Yang Li and Xiaojun Liu from HefeiUniversityofTechnology used Laser Surface Texturing technology to produce samples with various shapes, depth, spacing and area share and studied the impact of micro-texturing on the friction coefficient under different rotation rate and load cases[7]. Chemical reaction or physical bumps are used in chemical etching technology to remove the materials. The chemical etching technology is often applied in solar battery preparation process to get fluffy surface which can enhance the reflection areas. It is also used in frictional performance research to produce surface pits of different shapes. There are plenty of advantages of chemical etching method which include lower facilityrequest, simpler operating process and faster acquisition of micron-sized rough structure. A case in point can be that Jinfeng Li and Xiaolei used chemical etching method to produce surface micro-texturing and researched the impact of micro-texturing on the friction coefficient under water lubrication [8]. Zhengguo Wang and Jiliang Mo from the Tractive power National key Laboratory studied the impact of the size and distribution of grooved type micro-texturing on the friction and noise by producing grooves of different width and spacing on brake disks [9]. The electrochemical machining technology is a kind of non-traditional machining method which is based on the anodic dissolution theory and the metal anode will dissolve to certain shapes in electrolytic solution. Jung Won Byun from Seoul National University adopted micro ECM method to produce micro features for friction reduction [10]. This method has also been used to produce surface micro-texturing by Zhanhe Wang, Yongwei Zhu from YangzhouUniversity and Wei Liu from Nanjing University of Aeronautics and Astronautics [11-12]. Some other ways can also be used to get surface topography: Rendi Kurniawan et al. found that surface texturing can be produced by applying piezoelectric tool holder actuator on conventional CNC turning[13]; Micro ball end milling method was used by Eldon Graham et al. from University of Calgary to get Micro-Dimpled surfaces[14].
The processing methods mentioned above can meet the requirement of the surface texture machining of various materials on the whole. However, the special equipment, high machining cost or restricted dimension of finished surface etc. render these methods unbefitting. In this paper, the immersion corrosion method was adopted to get irregular surface topography due to its simple operation, low cost and unrestricted dimension of finished surface.
EXPERIMENTAL SECTION
Materials and processes
For the subsequent research of frictional performance of samples’ surface, cold work die steel Cr12 was chosen as the sample materials and the dimension of samples is 30mm×10mm×5mm. There are three kinds of corrosive agents: A(aquaregia), B(mixed solution of ferric chloride, nitric acid and distilled water and their ration is 20g:30ml:10ml ), C(supersaturated solution of ferric chloride in hydrochloric acid). Before our tests, the specimens were polished by abrasivepaperformetallograph 400#、600#、1000#、1200#、2000# in sequence and then they were polished on polishingmachine to get the surface roughness about 0.08. After polishing process, the specimens were cleaned by the ultrasoniccleaner and the cleaning reagent used was anhydrous ethanol. At last, the corrosionprocess was done in the thermostatwaterbath at 30℃(Fig.1)and the specimens were immersed in different corrosive agents for different soaking time.
Fig1. Corrosion process
Testing principles
______________________________________________________________________________
The reactionequation of samples in corrosive agent A:
3 e e 3 3 2
4
HNO
F F NO
= (
)
2
H O NO
+
The reactionequation of samples in corrosive agent B:
e
2
el =3
3 el
2F
F C
F C
e 2 3 e 3 e 3 3 2
3
F C
l +4
HNO
2
F C
l
F NO
(
)
NO
2
H O
The reactionequation of samples in corrosive agent C:
e
2
el
33
el
2F
F C
F C
e
2
l
el
2 2F
HC
F C
H
RESULTS AND DISCUSSION
The impact of corrosive agents and corrosion time on the surfacetopography of samples
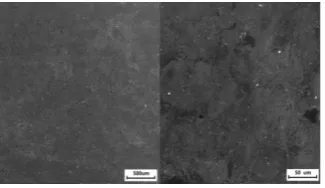
Figure 2-5 show the scanning electron microscopic image of samples’ surfacetopography. Figure 2 shows the surfacetopography of sample0# which was grinded smooth and done no corrosion process; Figure 3 shows the surfacetopography of sample A1#、A2#、A3# which were corroded in corrosive agent A for 10mins、15mins and 20mins,respectively;Figure 4 shows the surfacetopography of sample B1#、B2#、B3#、B4#、B5# which were corroded in corrosive agent B for 5mins、10mins、15mins、20mins and 25mins,respectively; Figure 5 shows the surfacetopography of sample C1#、C2#、C3# which were corroded in corrosive agent C for 20mins、30mins and 60mins,respectively;Figure5 shows the cutting height of each sample along vertical direction after filteringprocessing, which indicates the depth of corrosion pits on the samples surface.
From Fig.3 we can see that, because of the corrosion pits of uneven size which result from chemical reaction between sample surface and corrosive agent A, the surfacetopography of sample A1#、A2#、A3# is not smooth enough. Meanwhile, the size of corrosion pits experiences an incline from A1#toA3#, which demonstrates that the size of corrosion pits and the corrosion time are directlyproportional in corrosive agent A. Compared to Fig.3, the corrosion pits in Fig.4 tends to be much bigger and evenly distributed.
The corrosion pits on sampleB1#、B2#、B3#、B4#、B5#are of uneven size, which indicates the coherence of corrosion pits’ size and corrosion time. However, the size of corrosion pits experiences a larger fluctuation rather than growing continually with the corrosive time increasing. In particular, the corrosion pits after 10mins’corrosion are much bigger than that of 5mins’ but they tend to be less obvious when the corrosion time is 15mins. The reason for this phenomenon can be that the chemical reaction on sample surface is almost full, which makes the surface smoother. When the corrosion time increases to 20mins, the corrosion pits appear to be obvious and uniformly distributed again and then they tend to be smooth once again at 25mins.
[image:3.595.225.388.652.746.2]Fig.5 shows the corrosion processing done in corrosive agent C, which lasts longer time than that in corrosive agent A and B. From Fig.5 we can see that the corrosion pits are shallow and elliptic and their size tends to be homogeneous, which proves the independence of corrosion time and corrosion pits’ size in corrosive agent C. The strongest chemical reaction can be found in corrosive agent B which is followed by A and C and it takes less time for corrosion processing in B. What is more, the corrosion pits got from corrosive agent B and C tend to have relatively more regular shape than A.
(a) (b) (c) (a)surface topography of sampleA1#
(b)surface topography of sampleA2# (c)surface topography of sampleA3#
Fig.3 surface topography of samples corroded in corrosive agent A
(a) (b) (c)
(d) (e) (a)surface topography of sampleB1# (b)surface topography of sampleB2#
(c)surface topography of sampleB3# (d)surface topography of sampleB4# (e)surface topography of sampleB5#
Fig.4 surface topography of samples corroded in corrosive agent B
(a) (b) (c) (a)surface topography of sampleC1#
(b)surface topography of sampleC2# (c)surface topography of sampleC3#
______________________________________________________________________________
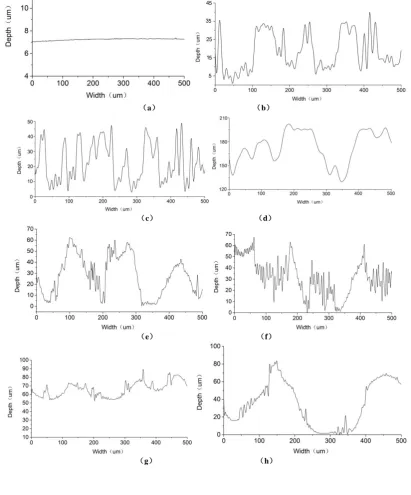
[image:5.595.99.511.252.748.2]Fig.6 shows the two-dimensional profile of certain cross section of each sample along its longitudinal direction and Table 1 shows the height values and the average friction coefficient of each profile in Fig.6. Fig.6 and Table1 indicate that the height values of sample 0# are much smaller than that of any other samples. Meanwhile, because of the smoother surface of sample 1#, the height values of it are basically the same while some deeper corrosion pits can be found in other samples. After comparing the depth of corrosion pits in three groups’ samples, we found the strong and weak relationship among corrosive agents: B>A>C. Therefore, corrosive agent B can be employed to get bigger and deeper corrosion pits and due to the less impact of corrosive agent C on corrosion pits, using corrosive agent C is of more convenience to control the corrosion time in our experiment.
Fig.7 shows the relationship between the depth of corrosion pits and the corrosion time. From Fig.7 we can see that both the corrosion time and the categories of corrosive agents have influence on the depth of corrosion pits. Within certain corrosion time, the longer time the samples are corroded in the corrosive agent A or C, the deeper the corrosion pits are. However, the depth of corrosion pits in corrosive agent B shares a tendency as follows: increasing→decreasing→increasing→decreasing, which can be explained by the same reason for the size of corrosion pits changing with corrosion time.
(a) (b)
(c) (d)
(e) (f)
(i) (j)
(k) (l) (a)sample 0#
(b)two-dimensional profile of A1# (c)two-dimensional profile of A2# (d)two-dimensional profile of A3#
(e)two-dimensional profile of B1# (f)two-dimensional profile of B2# (g)two-dimensional profile of B3#
(h)two-dimensional profile of B4# (i)two-dimensional profile of B5# (j)two-dimensional profile of C1#
(k)two-dimensional profile of C2# (l)two-dimensional profile ofC3#
Fig.6 two-dimensional profile of each sample along its longitudinal direction
Table1 the height values and the average friction coefficient of each profile in Fig.6
No. the maximum height
the minimum height
differenc e
the average friction coefficient
0# 7.36894 7.03686 0.33208 0.199
A1
# 34.69 0.04 34.65 0.146
A2
# 48.31 0.03 48.28 0.086
A3
# 200.78 130.05 70.73 0.099
B1# 62.40824 0.21419 62.19405 0.089 B2# 67.49212 1.21897 66.27315 0.112 B3# 89.52051 52.62589 36.89462 0.113
B4# 83.60765 0.26541 83.34224 0.201 B5# 38.97605 0.91158 38.06447 0.095 C1# 8.54264 5.25557 3.28707 0.152 C2# 10.68644 3.26561 7.42083 0.151
______________________________________________________________________________
(a) (b) (c) (a)in corrosive agent A
(b)in corrosive agent B (c)in corrosive agent C
Fig.7the relationship between the depth of corrosion pits and the corrosion time
The impact of surfacetopography on frictional coefficient
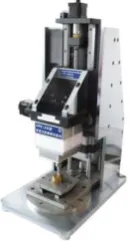
[image:7.595.273.338.221.342.2]Our experiment was done on HSR-2M high-speed reciprocating friction test machine(shown in Fig.8) and the two testspecimens used were GCr15(Ф6,sphere,HRC65) and Cr12(30mm×10mm×5mm,cuboid). The upper specimen moves in a straight line relative to the lower one twice in each round of the motor and starved-oil lubrication was adapted, which means that we only coat a very thin oil film (5#engineoil from Hasitai Lubricatingoil Co. Limited) on the lower specimen surface at the very beginning. Other parameters are as follows: the friction load is 150N; the motor speed is 300r/min; the grindingcrack length is 10mm; the friction time is 5mins.
Fig .8 HSR-2M high speed reciprocating friction test machine
Fig.9 shows that how the friction coefficient changes as a function of friction time. From Fig.9 we can see that the friction coefficient of all samples surface, except for B4#, is lower than that of 0# after corrosion processing. What is more, the friction coefficient of sample 0# increases considerably with corrosion time arising while that of other samples which were corroded keeps relatively stable. Therefore, a surface with certain topography can reduce much more friction coefficient than a smooth surface under starved-oil lubrication. The friction coefficient curve of samples corroded in corrosive agent C experiences a much greater fluctuation than that in corrosive agent A and B. In addition, Table 1 indicates that the average friction coefficient in corrosive agent C is also bigger than that in A and B. The equation of reductionrate of friction coefficient is as below:
n 1
1
f -f
=
100%
f
(1)
n
f
——sample n’s friction coefficient(n=2、3、4);
1
f
——sample 1#’s friction coefficient.The friction coefficient is related to the surfacetopography of samples. The friction coefficient of samples with irregular surfacetopography all tends to be smaller than that of samples with smooth surface, except for B4#, which proves the effectiveness of irregular surface topography of reducing the frictional wear and lowering the friction coefficient. The reason for this phenomenon can be that the corrosion pits in the irregular surface topography can not only store more lubricatingoil for boundarylubrication or start-up friction surface but also store the wear debris to alleviate ploughing wear and to reduce frictionalresistance.
lubricating oil will be stored with the pits getting deeper. However, the deeper the pits are, the longer distance the lubricating oil has to flow from bottom to the contact surface, which weakens the fluidity of the lubricating oil and the beneficial influence of corrosion pits.
Sample A2# sees the best friction coefficient reduction rate (56.8%) and its corrosion pits’ depth is within the optimal range we recommend (36—70um). The shape of sample A2# is relatively uniform and the number of contact peak per unite area is bigger than other samples, which makes A2# more effective on anti-friction performance.
(a) (b)
(c)
Fig.9the changing curve of friction coefficient with friction time
______________________________________________________________________________
(c)
(a) samples corroded in corrosive agent A (b)samples corroded in corrosive agent B (c)samples corroded in corrosive agent C
Fig.10 the relationship between the friction coefficient as well as its reductionrate and the depth of corrosion pits
CONCLUSION
1) The chemical corrosion method can be adapted to get irregular surface topography of samples
2) The irregular surface topography can reduce the friction coefficient effectively in starved-oil lubrication and the friction coefficient reduction rate can be as high as 56.8% compared to smooth surface.
3) The friction coefficient of certain sample surface has a close relation with the density of surface contact peak. When the lubrication and surface topography are definite parameters, the denser the contact peak is, the less load each contact peak has to bear. Therefore, the frictional resistance, the friction coefficient and the wear mass loss all decrease. 4) The friction coefficient is related to the size and depth of corrosion pits and it declines first, and then increases when the corrosion pits get bigger or deeper.
REFERENCES
[1] China Die & MouldIndustry Association (CDMIA),"12th Five-Year" mould industry planning,Die & Mould Industry, 2011, 37(1),1-8.
[2] NakanoMiki, KorenagaAtsuko, Korenaga Atsushi,et al. Academic J.Tribology Letters, 2007,2(28),131-137. [3] J. Keller, V. Fridrici , Ph. Kapsa ,et al. Academic J.Advanced Tribology, 2010,447-448.
[4] P.L. Menezes Kishore, S.V. Kailas. Academic J.Tribology Letters, 2006,24(3),265-273.
[5] Shuting Lei, Sasikumar Devarajan, Zenghu Chang, Academic J.Journal of materials processing technology ,
2009,(209),1612–1620.
[6] Bart Raeymaekers, Izhak Etsion,and Frank E. Talke. Academic J.Tribology Letters, 2007,1(27),89-95. [7] Li Yang, Liu Xiaoju, Academic J. Tribology ,2013,4(33),349-355.
[8] Li, J., F. Zhou , X. Wang. Academic J.Meccanica, 2011, 46(3), 499-507.
[9] Wang Zhengguo, Mo Jiliang, Chen Guangxiong, Zhu Minhao, Academic J.Tribology,2013,5(33),304-310. [10] Jung Won Byun, Hong Shik Shin, Min Ho Kwon, Bo Hyun Kim, Chong Nam Chu. Academic J.International Journal of Precision Engineering and Manufacturing,2010,5(11),747-753
[11] Wang Zhanhe, Zhu Yongwei, Fan Zhongjun, Yun Naizhang. Experiments Study of Thrasonical Combined Electrical Micro-machining Micro-structures on Working Surface of Friction Units,IET Conference Publications, v 2009, n 556 CP, 2009, International Technology and Innovation Conference 2009, ITIC 2009.
[12]Liu Wei, Model Experiment and Finite Element Simulation of surface texture on piston skirt, ,NanjingUniversityofAeronauticsandAstronautics, Master'sthesis,2009.
[13] Rendi Kurniawan, Tae Jo Ko. Academic J. International Journal of Precision Engineering and Manufacturing,2013,2(14), 199-206.