Journal of Chemical and Pharmaceutical Research, 2015, 7(4):1308-1315
Research Article
CODEN(USA) : JCPRC5
ISSN : 0975-7384
Development and validation of a stability indicating RP-UPLC method for the
determination of paracetamol and ibuprofen in tablet
Sheetal Makwana
1, 3, Madhavi Patel
1, 2, Bhawani Singh
2, 4, Jatin Upadhyay
3and Anamik
Shah
1, 2*
1National Facility for Drug Discovery through NCE’s Development & Instrumentation Support to SMPE’s,
Department of Chemistry, Saurashtra University, Rajkot, Gujarat, India
2Department of Chemistry, Banasthali Vidyapith, Rajasthan, India 3Matushri Virbaima Mahila Science & Home Science College, Rajkot 4Department of Pure & Applied Chemistry, University of Kota, Kota, Rajasthan, India
_____________________________________________________________________________________________
ABSTRACT
The proposed work describes the development and validation of a simple, precise and accurate method for the combination tablet formulation of Paracetamol and Ibuprofen by UPLC. Efficient separations of the Paracetamol and Ibuprofen were achieved in < 3 min by an isocratic elution with 20mM potassium dihydrogen phosphate buffer (pH 7.35 with dilute ortho phosphoric acid): acetonitrile (35:65 v/v) mobile phase at a flow rate of 0.25ml/min at 225 nm using a PDA detector. In UPLC, all of the analytes were resolved very well the resolution between Paracetamol and Ibuprofen was 5.4. The method was developed using different columns like UPLC @ BEH C8, C18; phenyl and HSS T3 with different length of the columns had studied under RP conditions. The final column chosen for the analysis was HSS T3 (100mm ×2.1, 1.8 µm) column which provided much stronger retention and resolution with good peak shape. The retention time of Paracetamol and Ibuprofen were 1.09 and 1.88 min, respectively. The linearity was obtained in the concentration range of 6.66-59.94 µg/ml and 8.0-72.0 µg/ml for Paracetamol and Ibuprofen with 0.9999 of correlation coefficients respectively. The specificity of the method was analyzed by the stress degradation study in acidic, alkaline, oxidative, thermal and photolytic conditions. The LOD for Paracetamol and Ibuprofen was found 0.84 and 0.52 µg/ml respectively. The LOQ was found 2.81 and 1.73 µg/ml for Paracetamol and Ibuprofen respectively. The validation follows the International Conference on Harmonization (ICH) guidelines.
Key words: Reversed phase; Isocratic elution; Stability indicating; UPLC-PDA; Method validation
_____________________________________________________________________________________________
INTRODUCTION
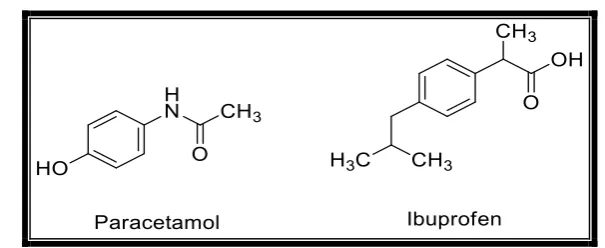
Figure 1: Chemical Structure of Paracetamol and Ibuprofen
The several analysis of Paracetamol and Ibuprofen in single or in combination dosage form were carried out by HPLC which containing the long period of run time, that minimizes their applications by throughput analysis. The recent approach is to develop a method by a new generation UPLC instrument which has very shorter run time and high throughput analysis. Simultaneous quantification of both the drugs; Paracetamol and Ibuprofen were performed and they were eluted out before 3.0 min., which shows a great advantage of shorter run time for the utilization in laboratories for the purpose of quality control as compared to conventional LC method.
Reviews of literature appurtenant to analytical methods indicate that there is no any isocratic UPLC-PDA method is available for simultaneous quantification of Paracetamol and Ibuprofen in combination dosage form. The various methods were revealed for pharmaceutical dosage form, single or combined and biological fluids by HPLC [13-15], HPTLC [16], UV[17],FT-IR [18].
The analytical method for the determination of Paracetamol and Ibuprofen in combination in tablet dosage form was validated according to guideline of ICH Q2 (R1) [19].
EXPERIMENTAL SECTION
Materials and methods:
Working standards of Paracetamol and Ibuprofen were gifted by HETERO drugs Limited (Hyderabad, India) and combination tablet was purchased from the market. Analytical-grade hydrochloric acid, ortho-phosphoric acid, hydrogen peroxide (30 % v/v) and sodium hydroxide pellets were from Ranbaxy Fine Chemicals (New Delhi, India). Acetonitrile HPLC-grade and potassium dihydrogen phosphate were from Spectrochem Pvt. Ltd. (Mumbai, India), and HPLC grade water was prepared using Milli-Q Elix-3 water purification system. Nylon syringe filters (0.45 µm) were purchased from Millex-HN, Millipore (Mumbai, India).
Instrumentation:
The Waters AcquityTM UPLC chromatographic system used to perform development and validation (Waters,
Milford, MA, USA). This system consists of a binary solvent manager (BMS), photodiode array detector, sample manager (SM) and column oven connected to a multi-instrument data acquisition and processing system Empower 2.1 version. A Sartorius CPA2P analytical microbalance (Gottingen, Germany), an ultra sonic bath SONICA Spinco used for degassing purpose from Spincotech Pvt. Ltd. (Mumbai, India). Milli-Q, Elix-3 water purification system (Millipore, Milford, USA) used as an HPLC grade water source.
Chromatography:
Chromatographic analysis was performed on HSS T3 (100 mm×2.1, 1.8μm) column. The mobile phase consists of 20mM potassium dihydrogen phosphate buffer: acetonitrile (pH 7.35 by ortho-phosphoric acid) in the ratio of (35:65 v/v) was used throughout the analysis. The flow rate was 0.25 ml/min, the injection volume was 1.2 µL, column temperature was 30ºC and detection was performed at 225 nm using a PDA detector.
Preparation of Phosphate buffer:
To prepare 20mM potassium dihydrogen phosphate buffer, 3.496gm was weighed and dissolved in 1 liter HPLC grade water and pH adjusted to 7.35 with ortho-phosphoric acid. It was filtered by 0.45µm filter and sonicated with an ultrasonic bath.
Mobile phase composition:
Preparation of Diluents:
Mixer of water and acetonitrile in proportion of 50:50 v/v.
Preparation of Standard solution:
Standard stock solution of Paracetamol (333µg/ml) and Ibuprofen (400µg/ml) was prepared by transferring accurately weighed, 16.65 mg and 20 mg, of working standards into a 100 ml of volumetric flask, respectively. The 20 ml of mobile phase was added and the mixture was sonicated then the solution was diluted up to the 100 ml. Standard solutions were prepared by accurately transferring 2.5 ml of stock solution into 25 ml of volumetric flask to furnish the final concentration of Paracetamol (33.3µg/ml) and Ibuprofen (40µg/ml) and diluted with mobile phase up to mark.
Preparation of Sample solution:
To prepare a stock solution, 20 tablets were crushed and powdered and equivalent weight was taken to furnish the final concentration of Paracetamol (333µg/ml) and Ibuprofen (400µg/ml). Test solutions were prepared by accurately transferring 2.5 ml of stock solution and dilute with mobile phase up to 25 ml to obtain a final concentration of Paracetamol (33.3µg/ml) and Ibuprofen (40µg/ml). The mixture was further sonicated.
RESULTS AND DISCUSSION Method development:
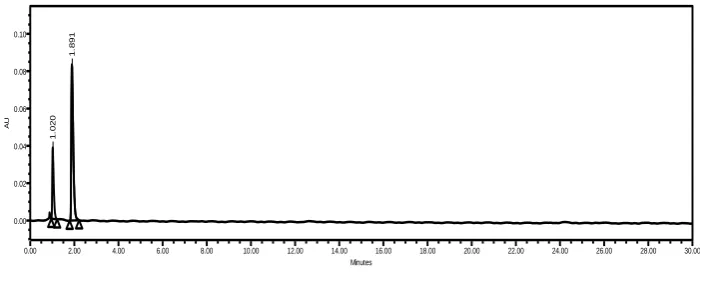
Selection of the chromatographic parameters was depended upon the chemical and physical nature of the compounds. The analytical method was decided after several exploratory trials with different condition effecting UPLC analysis, for example diluents and mobile phase composition, organic solvent in the mobile phase, flow rate, detection wavelength and other chromatographic conditions. Preliminary trials with mobile phase comprising mixtures of water with methanol did not give good peak shape. The best peak shape was obtained by use of 20mM potassium dihydrogen phosphate buffer, adjusted to pH 7.35 with ortho-phosphoric acid and acetonitrile, mobile phase composition 35:65 (v/v). Acetonitrile was selected as an organic constituent of the mobile phase to reduce the retention time and buffer was preferred to reduce peak asymmetry and to achieve good peak shape. The optimized mobile phase enabled good resolution of Paracetamol and Ibuprofen and of compounds generated during force degradation. The final chromatographic condition was optimized and used for the further validation of the method; standard chromatogram obtains using the conditions are given in figure 2, where Paracetamol and Ibuprofen were eluted at 1.09 and 1.88 min., respectively. The three dimensional view of the chromatogram is shown in figure 3. The newly developed analytical method was validated according to the ICH guidelines[21], USP[22] and AOAC international[23].
1.
09
1
1.
88
2
AU
0.00 0.02 0.04 0.06 0.08 0.10 0.12 0.14 0.16 0.18
Minutes
0.00 0.50 1.00 1.50 2.00 2.50 3.00 3.50 4.00 4.50 5.00
Figure 2: chromatogram of standard solution of Paracetamol and Ibuprofen
Solution stability:
Stability of the solution is the most significant parameter to get the reliable result throughout the validation. The solution stability study was performed using aged solution with compare to freshly prepared standard solution stored at room temperature and at 3-5oC. To confirm the stability of the solution, percentage assay was calculated at
different time interval such as initial, 6 h, 12 h, 24 h, 36 h and for 48 h. The results found satisfactory for 36 h, because at 48 h solution start degrading with % assay value less than 98% and % RSD found < 2.0 % for all the intervals except 48 h.
Forced Degradation
Figure 3: (3D) chromatogram of Paracetamol and Ibuprofen
Acidic degradation:
Equivalent weight of powdered of Paracetamol and Ibuprofen was taken and 3 ml 1N HCl were added in a 50 ml volumetric flask; it was put for degradation in water bath for 1 hour at 800 C, then it was neutralized with 3 ml, 1N
NaOH and diluted up to mark with diluents. The concentration obtained was about 333.34 μg/ml of Paracetamol and 400.09 μg/ml of Ibuprofen. Then the solution was further diluted to furnish the final concentration of 33.34 μg/ml of Paracetamol and 40.09 μg/ml of Ibuprofen.
1
.0
2
0
1
.8
9
1
AU
0.00 0.02 0.04 0.06 0.08 0.10
Minutes
[image:4.595.97.544.69.224.2]0.00 2.00 4.00 6.00 8.00 10.00 12.00 14.00 16.00 18.00 20.00 22.00 24.00 26.00 28.00 30.00
Figure 4: chromatogram of acidic degradation
Alkaline degradation:
Equivalent weight of powdered of Paracetamol and Ibuprofen was taken and 3 ml 0.1N NaOH were added in a 50 ml volumetric flask; It was put for degradation in water bath for 1 hour at 800 C, then it was neutralized with 0.1 N
HCl, diluted up to the mark with diluents. The concentration obtained from that, was about 333.34 μg/ml of Paracetamol and 400.09 μg/ml of Ibuprofen.Then the solution was further diluted to furnish the final concentration of 33.34 μg/ml of Paracetamol and 40.09 μg/ml of Ibuprofen.
Oxidative degradation:
Equivalent weight of powdered of Paracetamol and Ibuprofen was taken and 3% 3 ml v/v H2O2, were added in a 50
ml volumetric flask and sonicated about 15 minutes in ultrasonic bath and the mixture was refluxed at 80°C for 1 hour. Then, the mixture was cooled to room temperature. The concentration obtained was about 332 μg/ml of Paracetamol and 399.80 μg/ml of Ibuprofen and 1 ml of this solution was taken into the 10 ml of volumetric flask and dilute up to the mark with diluents. The concentration obtained is about 32.3 μg/ml of Paracetamol and 39.80 μg/ml of Ibuprofen.
Thermal degradation:
The powdered drugs were kept at 80° C for 48 hours. Then Equivalent weight of powdered of Paracetamol and Ibuprofen was taken and dissolved in a 50 ml of volumetric flask with diluents and sonicated with ultrasonic bath then the mixture was cooled to room temperature and diluted up to the mark. The concentration obtained was about 333.34 μg/ml of Paracetamol and 400.04 μg/ml of Ibuprofen and was taken 1 ml of this solution and transferred into 10ml volumetric flask and diluted up to the mark with diluents. The concentration obtained was about 33.34 μg/ml of Paracetamol and 40.04 μg/ml of Ibuprofen.
0.00 0.02 0.04 0.06 0.08 0.10 0.12 0.14 0.16 0.18
AU
0.00 0.50 1.00 1.50 2.00 2.50 3.00 3.50 4.00 4.50 5.00
Minutes
[image:4.595.134.488.334.476.2]Photolytic degradation:
The powdered of Paracetamol Ibuprofen was exposed to sunlight for 48 hours. Then Equivalent weight of powdered of Paracetamol and Ibuprofen was taken and dissolved in a 50 ml of volumetric flask with diluents and sonicated then the mixture was cooled to room temperature and diluted up to the mark. The concentration obtained was about 332.6 μg/ml of Paracetamol and 400.04 μg/ml of Ibuprofen and from that 1 ml of solution was taken into 10 ml of volumetric flask and diluted up to the mark with diluents. The concentration obtained was about 32.36 μg/ml of Paracetamol and 40.04 μg/ml of Ibuprofen. The chromatogram obtain from the study is shown in figure 5. The results of degradation study are shown in table 1.
0
.9
9
3
1
.7
3
3
AU
0.00 0.02 0.04 0.06 0.08 0.10 0.12 0.14 0.16
Minutes
[image:5.595.135.487.176.310.2]0.00 1.00 2.00 3.00 4.00 5.00 6.00 7.00 8.00 9.00 10.00 11.00 12.00 13.00 14.00 15.00
[image:5.595.115.499.353.423.2]Figure 5: chromatogram of photolytic degradation.
Table 1: Summary of degradation study
Sr. No Condition Paracetamol Ibuprofen
Peak area Total Degradation % Peak area Total Degradation % 1 Acidic (1N HCl) 387484 58.41 1096667 9.52 2 Alkaline (0.1N NaOH) 295845 5.21 974525 47.89 3 Oxidative (3% H2O2) 792274 37.01 1617443 38.11
4 Thermal (80° C) 549671 30.82 929660 34.44 5 Photolytic (sunlight,48h) 574835 18.3 954082 38.4
Specificity:
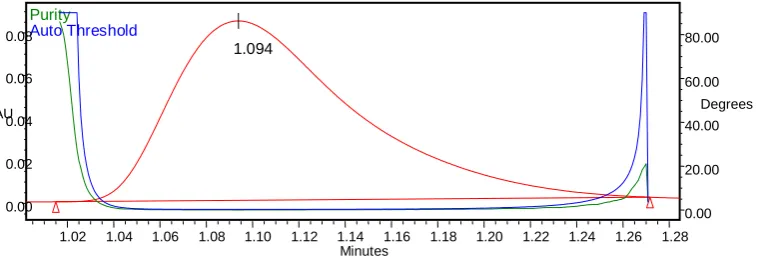
[image:5.595.123.509.505.638.2]The specificity of the method was determined by checking for interference with the analytes from placebo, diluents, mobile phase and degradation products. The specificity of the components was confirmed by measuring peak purity for Paracetamol and Ibuprofen during the force degradation study. There was no interference from any degradation product peak with the drug peaks. Figure (6 and 7) shows the peak purity chromatographs of Paracetamol and Ibuprofen, respectively for tablet solution.
Figure 6: Peak purity chromatogram of Paracetamol
1.094
Purity
Auto Threshold
AU Degrees
0.00 0.02 0.04 0.06 0.08
0.00 20.00 40.00 60.00 80.00
Minutes
Figure 7: Peak purity chromatogram of Ibuprofen
Accuracy:
[image:6.595.187.427.333.406.2]Accuracy was performed by using three different amounts (corresponding to 50, 100 and 150% of the test preparation concentrations) of Paracetamol and Ibuprofen to the placebo preparation and comparing the actual and measured concentrations. For each level, three solutions were prepared and each was injected in duplicate. Accuracy was calculated for Paracetamol for three different % set, 100.24-100.90 and 99.79-99.93 for Ibuprofen. The results of accuracy study are shown in table 2.
Table 2: Results of Accuracy study
Sample Level % Peak area* % Recovery* % RSD
Paracetamol
50 201367 100.9 0.92 100 402727 100.24 0.63 150 595720 100.45 0.57
Ibuprofen
50 513114 99.93 0.02 100 1025935 98.84 1.15 150 1538626 99.79 0.13
(*Mean of three set of each % level concentration)
Precision:
The % RSD value for Paracetamol and Ibuprofen drugs peak area for different sets of precision (method precision and Intermediate precision) were 0.481 and 0.256 respectively.
Hence the value of %RSD for each set of precision was not more than 2.0 that proved the method is highly precise and % assay value was found between the 98.0% to 102 %.
Figure 7: Linearity curve of Paracetamol
1.888
Purity
Auto Threshold
AU Degrees
0.00 0.05 0.10 0.15
0.00 20.00 40.00 60.00 80.00
Minutes
[image:6.595.161.452.504.686.2]Figure 8: Linearity curve of Ibuprofen
Linearity:
Paracetamol and Ibuprofen showed linearity in the range of 6.66-59.94 µg/ml and 8-72 µg/ml respectively. The linear regression equation were y=12043.35x+564.92 and y= 25564.51x+4318.56, correlation coefficient 0.9999for both the drug (figure 7 and 8), where x axis is the concentration in µg/ml and y axis is the peak area in absorbance units.
Limit of detection (LOD) and limit of quantification (LOQ):
The limits of detection and quantification were evaluated based on the comparison of standard deviation of the peak area and the slope of calibration curve of Paracetamol and Ibuprofen. However, the equations used for the LOD and LOQ were 3σ/S and 10σ/S, respectively. LOD for Paracetamol and Ibuprofen were 0.84 ppm and 0.52 ppm, respectively; the LOQ were 2.81 ppm and 1.73 ppm, respectively.
Robustness:
The analytical method validation parameter of robustness was carried out by several changes in flow (±0.01mL/min), mobile phase proportions (±2.0), the pH of the mobile phase (±0.01), wavelength (±3.0 nm), column temperature (±2.0ºC) and different column lot. There was no significance change observed in % assay and retention time. Furthermore it was confirmed by the variations in theoretical plates, asymmetry and % RSD. Results derived from the study were within the criteria of acceptance. So the method is highly robust.
System suitability:
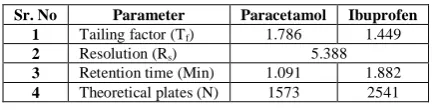
System suitability study was verified by measurement of peak asymmetry (A < 2.0), resolution (Rs > 3.0) and number of theoretical plates (N > 1500) after chromatography of standard solution. The values of these properties were in accordance with in-house limits (table 3).
Table 3: System suitability results
Sr. No Parameter Paracetamol Ibuprofen 1 Tailing factor (Tf) 1.786 1.449
2 Resolution (Rs) 5.388
3 Retention time (Min) 1.091 1.882 4 Theoretical plates (N) 1573 2541
CONCLUSION
[image:7.595.198.417.575.630.2]Acknowledgements
The authors are thankful to the Hetero drugs Limited (Hyderabad, India) for the gifted samples of reference standard (Paracetamol and Ibuprofen), Department of Chemistry, Saurashtra University (UGC-SAP Sponsored and DST-FIST Funded) Rajkot, for providing instrumental facilities. Special thanks to “National Facility for Drug Discovery through New Chemicals Entities (NCE’s) Development and Instrumentation Support to Small Manufacturing Pharma Entities” program under Drug and Pharma Research Support (DPR) jointly funded by Department of Science & Technology, New Delhi, Government of Gujarat, Industries Commissionerate and Saurashtra University, Rajkot.
REFERENCES
[1]A Bertolini; A Ferrari; A Ottani; S Guerzoni; R Tacchi; S Leone. CNS Drug Rev., 2006, 12(3-4), 250-275. [2]United States Pharmacopeia (2007), National Formulary 25, Rockville, MD, 30: 1267,
[3]RV Aghababian. Essentials of Emergency Medicine, 2nd Edition, Jones & Bartlett Publishers, Sudbury,
Massachusetts, 2010, 814-816.
[4]A Jawad. Hepatology and Transplant Hepatology: A Case Based Approach, Springer Science & Business Media, New York, 2010, 194.
[5]P Macintyre; D Rowbotham; S Walker. Clinical Pain Management Second Edition: Acute Pain, CRC Press, USA, 2008, 85
[6]Acetaminophen. The American Society of Health-System Pharmacists. Retrieved 3 April 2011.
[7]AE Van; SA Van; EW Steyerberg; M Offringa; JD Habbema; G Derksen-Lubsen. Arch. Pediatr. Adolesc. Med.,
1995, 149(6), 632-637.
[8]A Brayfield. Martindale: The Complete Drug Reference, 36th Edition, Pharmaceutical Press, London SEI 7N,
UK, 2009, 132.
[9]B Hinz; O Cheremina; K Brune. FASEB J.,2008, 22(2), 383-390. [10]P Rao; EE Knaus. J. Pharm. Pharm. Sci., 2008, 11(2), 81-110.
[11]DA Perrott; T Piira; B Goodenough; GD Champion. Arch. Pediatr. Adolesc. Med, 2004, 158(6), 521-526. [12]DR Mehlisch; MDS Aspley; SE Daniels; DP Bandy. Cli. Ther., 2010, 32(5), 882-895.
[13]BG Tsvetkova; IP Pencheva; AB Zlatkov; PT Peikov. Int. J. Pharm. Sci. Rev. Res.2012, 16(1), 13-16.
[14]R Gopinath; S Rajan; SN Meyyanathan; N Krishnaveni; B Suresh. Indian. J. Pharm. Sci., 2007, 69(1), 137-140. [15]NS Lakka; N Goswami; P Balakrishna. Int. J. Res. Pharm. Sci., 2011, 2(3), 331-337.
[16]N Dubey; DK Jain; S Jadhawani. JPC- J. Planar. Chromat.2012, 25(2), 162-167. [17]R Gondalia; R Mashru; P Savaliya. Int. J. ChemTech Res., 2010, 2(4), 1881-1885.