Journal of Chemical and Pharmaceutical Research, 2014, 6(10):415-425
Research Article
CODEN(USA) : JCPRC5ISSN : 0975-7384Empirical analysis of new urbanization development path Selection in Jiangxi
based on factor analysis method
Liu Wei
1,2and Bao Yongan
11Hohai University, School of Business, Nanjing, Jiangsu Province, China 2
East China Jiao tong University, School of Civil Engineer and Architecture, Nanchang, Jiangxi Province, China
_____________________________________________________________________________________________
ABSTRACT
Since the reform and opening up, China's urbanization has made great achievements, and the process of urbanization has also significantly accelerated with an average annual urbanization rate of more than 1%. The rapid development of China's urbanization has important significance in promoting China's economic and rural development, optimizing industrial structure, and transforming the economic growth mode. However, the level of China's urbanization still lags behind other developed countries in the world. There are many problems given the low urbanization quality. In the context of new historical conditions, it has been a great concern of the whole society that how Chinese urbanization can continue to advance. In this regard, China clearly put forward the adherence to the new urbanization path after the 18th CPC National Congress. What kind of path should Chinese new urbanization choose? It becomes particularly urgent and necessary to conduct an in-depth study on this problem. By using the factor analysis method and the establishing the identification indicator system for influence factors, this paper took Jiangxi Province as the research object and performed an empirical analysis based on the data in Jiangxi Statistical Yearbook. According to the analysis, the conclusion on the new urbanization path selection in Jiangxi was thus drawn out.
Key words: Factor analysis method; Jiangxi; new urbanization; development path; selection
_____________________________________________________________________________________________
INTRODUCTION
The report of 18th CPC National Congress put forward that “We should keep to the Chinese-style path of carrying out industrialization in a new way and advancing IT application, urbanization and agricultural modernization. We should promote integration of IT application and industrialization, interaction between industrialization and urbanization, and coordination between urbanization and agricultural modernization, thus promoting harmonized development of industrialization, IT application, urbanization and agricultural modernization.” The proposition and effective implementation of “new four modernizations” has a great practical significance in promoting agricultural development, farmers' income and rural stability, accelerating the pace of socialist new countryside construction, completely changing rural landscape for urban and rural development, fully completing the goal of moderately prosperous society in rural areas, and stimulating the endogenous driving force of economic growth. Especially in order to achieve Chinese-style new urbanization, the adherence to an intensive, intelligent, green and low-carbon new urbanization path will be a strategic fulcrum for China's future economic development as well as an important engine for all rural work, thus playing a great traction role in rural industrialization, informatization and modernization. Therefore, it is necessary to accurately understand and grasp the scientific connotation of new urbanization, summarize successful cases in the new urbanization construction, and explore an effective path to advance the new urbanization development [1].
FACTOR ANALYSIS METHOD
2.1 Introduction to the principles of factor analysis [2]
In 1931, Scholar Thurston mentioned “factor analysis”, which was originated from the statistical analysis of intelligence tests by twentieth-century scholars Karl Pearson, Charles Spearmen, etc. With the improvement of computer technology in recent years, the application of factor statistical analysis at various levels becomes more extensive, and its related theories also become richer accordingly.
Factor analysis is to give a description of the correlation between large amounts of variables using few factors. The described variables are the random variables obtained from practical observations, while those factors are unobservable latent variables. Factor statistical method is one of such approaches to analyze the measured variables based on the essential attributes of such public factors.
The essential idea of factor statistical analysis is to classify the variables with high degree of association into one class, and different classes of variables are featured with low degree of association between each other. Variables in the same class can be regarded as those with close association due to the impact of a certain basic factor, and this common factor will be deemed as the latent public factor that is difficult to observe. Factor statistical analysis is a reflection of the idea of dimensionality reduction, which will aggregate variables with high degree of association to better facilitate the acquisition of easily analyzed characteristics. As a result, the number investigation and problem exploration of most variables will become less complicated.
The principle nature of factor analysis is based on the foundation of correlations. Most of the changes in the covariance matrix or in the correlation matrix are summarized as the consequence of individual public factors; the remaining variables act as characteristic factors. Consequently, each variable in every class thus serves as a characteristic representation of the basic public factor. Factor statistical analysis is to explore those basic attributes and to establish patterns. It is generally believed that much important information will not be lost if the accumulative variance contribution rate is greater than 85% [2].
2.2 Basic steps of factor analysis [2]
Set the ensemble as '
1 2
( , ,... P)
X = X X X ,and its mean vectorE x( )=u and covariance matrixV =(σij)p p× exist.
(1) The general form of factor model
In the public factors, some information is not covered. Separate measured variables are not included in the content of public factor analysis; those variables that are left and cannot be analyzed are taken as characteristic factors of their corresponding variables.
The factor statistical analysis model is usually marked as follows:
1 1 11 1 12 2 1m m 1 X −µ =α F +α F +L L +α F +ε
2 2 21 1 22 2 2m m 2
X −µ =α F +α F +L L +α F +ε
…………
1 1 2 2 m p
p p p p pm
X −µ =α F +α F +L L +α F +ε
If m is smaller than p, then F1, F2 ...Fm are the public factors of initial variables, andε1is the characteristic factor of
variableX1. If the factor model is in orthogonal form, then the non-association between public factors should be explored, and the characteristic factors and public factors are also not related with each other.
Demarcate
11 12 1
21 22 2
1 2
m
m
p p pm
A
α α α
α α α
α α α
= L L
M M M M
L , ' 1 2 ' 1 2 ( , ) ( , , , ) m p
F F F F
ε ε ε ε
= = r L r L , ,
, then the matrix form of factor model will be:
-xr
µ
r=AFr+ε
r.Matrix A will be a component matrix, and the constant αijwill be the loading of variable Xiin factorF . If the j
ensemble is in the standard form ofαij =ρ(Xi,Fj), then the loading αijof variable
i
X in factorF will be marked as j
(2) Estimation of loading matrix
Principal component analysis is a method to estimate factor loading matrix. Since the difference between its estimation result and the principal component of initial variable is a constant multiple, it is thus named as principal component analysis. It is the default method used by SPSS. In addition, the commonly used methods also include maximum likelihood method, factor analysis method, weighted least square method, impact factor analysis method, minimum residual method, etc.
(3)Factor cross-rotation
As the established factor model is now an initial model, the reflection of those resulting factors for problem's essential attributes is uncertain and the analysis on represented entity meaning is relatively complicated, factor cross-rotation is an improvement in processing method.
Factor cross-rotation is a non-unique attribute dependent on the factor model. Set T as an orthogonal matrix; since
TT′ =I , the factor model x− =
µ
AF+ε
r r r r
is equivalent to x− =
µ
(AT T F)( ′ )+ε
r r r r
, wherein the loading matrix of
( )( )
xr− =
µ
r AT T F′r +ε
r is B=AT , with a formula factor of Gr =T F′r. If the model x− =µ
AF+ε
r r r r
is not suitable for analysis, then operate the orthogonal switching T and convert the model intorx− =µr (AT′)(TF)+ =εr BGr+εr; the appropriate factor analysis can be found in the newly established model. In factor cross-rotation, the most commonly applied approach is the varix orthogonal rotation.
(4) Estimation of factor score function
In the established factor model, the origin variables in the ensemble are made into linear integrations
1 1 2 2 ... , 1, 2, ...
i i i im m i
X = =α F +α F + +α F +ε i= pwith public factors and characteristic factors; of course, separate public factors can also be made into a linear integration with origin variables Fj =b Xj1 1+b Xj2 2+ +... b Xjp p,j=1, 2,...,m , which is called as factor score function.
1 1 2 2 ... , 1, 2, ...
i i i im m i
X = =α F +α F + +α F +ε i= p; Fj =b Xj1 1+b Xj2 2+ +... b Xjp p,j=1, 2,...,m,) This function can be used to calculate and record the public factor scores and to handle the problem of unmeasurable public factors. It
needs to perform estimate 1 2 '
ˆ ˆ ˆ ˆ
( , ,..., ) j j j jp
br = b b b to obtain the function value of factor scores, where the method
proposed by Thompson is one of the options for estimation.
(5) Result analysis and applications
After obtaining the public factors reflected by original estimated data characteristics, appropriate factor cross-rotation should be done to perform the analysis and provide practical meaning. The adequacy of factor analysis is closely related with data representation properties, professional recognition of inquirers, and factor analysis skills.
Factor scores are also a critical output item and their role is to locate the projection values or coordinate values of explored objects in public factors. Factor scores are also a critical output item and their role is to gain the projection values or coordinate values of explored objects in public factors, build a coordinate system based on public factors, and then mark the scores of object factors on the corresponding positions in the coordinate system, thus obtaining the structural information of the related original attributes. In addition, factors scores can also be used to perform a dimensionality reduction or simple operation to origin data, thus realizing a better implementation of cluster analysis, discriminant analysis or other methods in statistical analysis.
CONSTRUCTION OF INDICATOR SYSTEM FOR INFLUENCE FACTORS
Table1. Indicator System for Influence Factors of New Urbanization Development Path Selection from the Perspective of Two-oriented Society
System Indicator Description Indicator Meaning
Economic
development Per capita GDP X1 (RMB)
Indicate the support of national economic development to new urbanization path selection
Industrial development
The proportion of tertiary industry output value in the total value of out-put X2 (%).
Indicate the impact of tertiary industry employment structure on new urbanization path selection
The proportion of employees number of the secondary industry in total employment X3 (%).
Indicate the impact of secondary industry employment structure on new urbanization path selection
The proportion of employees number of the tertiary industry in total employment X4 (%)
Indicate the impact of tertiary industry employment structure on new urbanization path selection
Population transfer
The income gap between urban and rural residents X5 (RMB)
Characterize the direct motivation and pressure of rural surplus labor transfer
The registered urban unemployment rate X6 (%) Characterize the impact of urban employment status on new
urbanization path selection
Scientific and
technological innovation
College student number per ten thousand people X7 (People)
Reflect the human capital stock and the potential to improve urban competitiveness
The proportion of expenses for education, science, culture and health undertakings in local financial expenditures X8
Comprehensively reflect the support of education, scientific and technological, culture, health and other social undertakings to new urbanization path selection
Infrastructure
Investment per capita in social fixed assets X9 (RMB)
Characterize the impact of infrastructure investment on new urbanization path selection
Highway mileage X10 (KM) Reflect the development situation of road infrastructure and the
convenience status of rural-urban linkages
Institutional environment
Ratio of commercialization rates of urban and rural agricultural products X11
Reflect the impact of market mechanisms on new urbanization path selection
The deviation degree of non-agricultural industrial
structure from non-agricultural employment
structure X12
Characterize the impact of household registration system and employment policies on new urbanization path selection
(1) Economic development
Economic development is the fundamental motivation and material basis for new urbanization path selection and without a certain level of economic development, urbanization would be water without a source and a tree without roots. Based on this, from the perspective of economic development, factors of new urbanization path selection that need to be considered are: per capita GDP (RMB). The higher the level of economic development, the higher the urbanization rate. Specifically, the proportion of the urban social output value in the rural social output value and the proportion of national income in rural national income are also important variables affecting new urbanization development. They reflect the initial conditions and the size of urban economy respectively. However, given the lack of statistical information on urban economy, it cannot be included in the economic model.
(2) Industrial development
Industrial development is an important carrier for new urbanization path selection, which plays an important role in guiding population transfer and promoting economic development. In the selection process of the new urbanization path, the connotation of industrial development has been changed from one particular type of industry playing as the leading role in the past to industrial cluster, industrial upgrading and transformation and industrial convergence of urban and rural industry. Therefore, this article intends to select the following variables as the main influence factors of industrial development on the new urbanization path selection:
① The proportion of tertiary industry output value in the total value of output (%). With the continual further
adjustment of industrial structure, the tertiary industry will eventually become the dominant force for new urbanization path selection. The proportion of tertiary industry output value is an important indicator of measuring the degree of optimization of industrial structure and the larger the value, the more reasonable the industrial structure.
② The proportion of employees number of the secondary industry in total employment (%).
③ The proportion of employees number of the tertiary industry in total employment (%).
(3) Population transfer
① The income gap between urban and rural residents (RMB). It reflects the motivation or pressure for the
migration of surplus rural labors to urban areas. Higher disposable income of urban residents and relatively smaller rate of farmers' income growth promote together the transfer of rural surplus labors to the modern town.
② Registered urban unemployment rate. The transfer of surplus rural labors to urban areas also depends on whether
cities and towns can provide stable non-farm employment opportunities and a higher level of wage income. The lower registered urban unemployment rate means higher employment rate of surplus rural labors in urban areas, thus increasing urbanization rate. In addition, Social security coverage rate is an important factor affecting the new urbanization path selection and it is very valuable in theory. However, it has to be ignored due to the very lack of relevant data in statistics practice.
(4) Scientific and technological innovation.
Scientific and technological innovation is an important driving force for new urbanization path selection and such innovation is based on education. So, the higher of the education and training level received by labors and the greater of the contribution of technological progress, the stronger market competitiveness and the higher the level of economic development and urbanization. Therefore, this article intends to select the following variables as the main influence factors of scientific and technological innovation on the new urbanization path selection:
①This factor refers to college student number per ten thousand people. Such factor reflects regional manpower
capital stock and increase potential of urban competitiveness.
②This factor refers to proportion (%) of expenses for education, science, culture and health undertakings in local
financial expenditures. Such factor reflects situations about governmental supporting to education, science, culture and health undertakings, wherein education, science, culture and health undertakings will be more developed and new urbanization path selection is promoted to a greater extent when governments make more investments in them.
(5) Infrastructures
Infrastructures form a necessary premise of the new urbanization path selection. Whether the infrastructures are perfect decides whether layouts and functions of cities and towns are reasonable and whether the comprehensive bearing ability is sufficient, influencing whether urban and rural resource elements can realize bidirectional flow smoothly. Hence, the paper intends to select the following variables as main factors for influences of infrastructures on the new urbanization path selection:
①This factor refers to investment per capita in social fixed assets (yuan). As one of three drives in economic
development, investment can obviously promote construction of infrastructures in cities and towns.
②This factor refers to highway mileage (km). This variable reflects development conditions of road facilities and
traffic convenience degree of urban and rural relations.
(6) Institutional environment
The institutional environment of establishing free flowing of urban and rural elements is a power source of the new urbanization path selection. With acceleration in innovation of systems such as household registration, land transfer, social security and rural finance, the institutional environment of the new urbanization path selection is better when reform contents tend to be thorough. However, relevant data of the institutional environment can hardly be found, so the paper intends to select the following variables as main factors for influences of the institutional environment on the new urbanization path selection:
①This factor refers to ratio of commercialization rates of urban and rural agricultural products. The
commercialization rate of agricultural products can reflect circulation situations and marketization degree of agricultural products to a certain extent. The bigger rate indicates that circulation of agricultural products is smoother, so reduction of an urban-rural gap is promoted and urbanization development is boosted; the bigger ratio of commercialization rates of urban and rural agricultural products indicates that differences are bigger in circulation conditions of urban and rural agricultural products, hindering reduction of the urban-rural gap and urbanization boosting.
②This factor refers to deviation degree of a non-agricultural industrial structure from a non-agricultural industrial
EMPIRICAL ANALYSIS
The paper selects Jiangxi Province as the research object in order to take Jiangxi into comprehensive account and analyze uniform control and analysis of policies about new urbanization development by Jiangxi Province, including analysis of new urbanization development and path selection in Jiangxi Province.
(1) Data sources and processing of influence factors
Data in the paper is mainly derived from or directly obtained through computation of the Statistical Yearbook of
Jiangxi over the years [4]. The paper takes the duration from 1998 to 2012 as the time scope of an influence factor
system of selection of a new urbanization development path under the perspective of “two-oriented society”, including 15 samples. In the system, above 12 factors constitute explanatory variables or independent variables. Meanwhile, the proportion of population in cities and towns in permanent population – urbanization level (Y) is an explained variable or an independent variable. Original data of the explained variable and explanatory variables is shown in Table 2.
Table2 Original Data Matrix of Influence Factors of New Urbanization Development under “Two-oriented Society” Perspective
Year Y (%) X1 (yuan) X2(%) X3(%) X4(%) X5(yuan) X6(%) X7(person) X8(%) X9(yuan) X10(10,000 km) X11(%) X12
2012 47.51 28800 34.64 31 36.1 13320.8 3 194.57 30.26 23921.31 15.06 69.02 1.32
2011 45.7 26150 33.51 30.1 35.5 11764.9 3 189.93 28.87 20248.66 14.66 68.21 1.34
2010 44.06 21253 33.03 29.6 34.8 10769.4 3.3 187.98 25.69 19660.02 14.06 66.7 1.35
2009 43.18 17335 34.45 29 34.5 9972.2 3.4 185.04 26.17 14989.03 13.7 67.53 1.35
2008 41.36 15900 33.79 28.1 34.5 8766.4 3.4 182.09 25.92 10785.07 13.38 66.68 1.35
2007 39.8 13322 33.08 28 34 7939.3 3.4 177.15 28.33 7559.39 13.05 66.8 1.36
2006 38.68 11145 33.5 27.5 33.4 6555.1 3.6 35.29 22.03 6184.77 12.82 66.93 1.37
2005 37.1 9440 34.8 27.2 32.9 5913.6 3.5 149.86 22.41 5048.94 6.23 66.92 1.37
2004 35.58 8097 35.46 27 32 5089.9 3.6 114.36 23.01 3999.07 6.19 66.92 1.37
2003 34.02 6624 37.15 26.2 31.8 4696.2 3.6 85.64 23.73 3063.52 6.12 66.98 1.38
2002 32.2 5829 39.7 22.7 32 4214.8 3.4 64.04 23.98 2105.73 6.07 66.83 1.43
2001 30.41 5221 40.61 23.5 30.3 3314.08 3.3 47.35 24.52 1509.41 6.03 65.73 1.43
2000 27.69 4851 40.8 24.4 29 2994.22 2.9 35.29 24.67 1243.87 3.71 65.3 1.42
1999 26.79 4402 39.94 25.4 28.2 2616.79 2.6 26.58 23.03 1074.03 3.69 63.81 1.4
1998 26.05 4124 38.45 26.2 27.2 2226.28 2.5 22.76 24.48 955.81 3.69 63.67 1.38
Data source: arranged by author of the Statistical Yearbook of Jiangxi (2012).
Table3 Converted Data Matrix of Influence Factors of New Urbanization Development under “Two-oriented Society” Perspective
Year lny lnx1 lnx2 lnx3 lnx4 lnx5 lnx6 lnx7 lnx8 lnx9 lnx10 lnx11 lnx12
1998 3.260 8.325 3.649 3.266 3.303 7.708 0.916 3.125 3.198 6.863 1.306 4.154 0.322
1999 3.288 8.390 3.687 3.235 3.339 7.870 0.956 3.280 3.137 6.979 1.306 4.156 0.336
2000 3.321 8.487 3.709 3.195 3.367 8.004 1.065 3.564 3.206 7.126 1.311 4.179 0.351
2001 3.415 8.560 3.704 3.157 3.411 8.106 1.194 3.858 3.199 7.319 1.797 4.186 0.358
2002 3.472 8.671 3.681 3.122 3.466 8.346 1.224 4.160 3.177 7.652 1.803 4.202 0.358
2003 3.527 8.798 3.615 3.266 3.459 8.455 1.281 4.450 3.167 8.027 1.812 4.204 0.322
2004 3.572 8.999 3.568 3.296 3.466 8.535 1.281 4.739 3.136 8.294 1.823 4.203 0.315
2005 3.614 9.153 3.550 3.303 3.493 8.685 1.253 5.010 3.110 8.527 1.829 4.203 0.315
2006 3.655 9.319 3.512 3.314 3.509 8.788 1.281 3.564 3.092 8.730 2.551 4.204 0.315
2007 3.684 9.497 3.499 3.332 3.526 8.980 1.224 5.177 3.344 8.931 2.569 4.202 0.307
2008 3.722 9.674 3.520 3.336 3.541 9.079 1.224 5.205 3.255 9.286 2.594 4.200 0.300
2009 3.765 9.760 3.540 3.367 3.541 9.208 1.224 5.221 3.265 9.615 2.617 4.213 0.300
2010 3.786 9.964 3.497 3.388 3.550 9.284 1.194 5.236 3.246 9.886 2.643 4.200 0.300
2011 3.822 10.172 3.512 3.405 3.570 9.373 1.099 5.247 3.363 9.916 2.685 4.223 0.293
2012 3.861 10.268 3.545 3.434 3.586 9.497 1.099 5.271 3.410 10.083 2.712 4.234 0.278
According to Table 2, factors influencing new urbanization path selection in Jiangxi do not have a uniform unit, and absolute values of the values are greatly different. Regression coefficients obtained by a simple linear regression model may be greatly different and do not have great comparability, so promotion or restriction effect of each factor on new urbanization path selection in Jiangxi cannot be analyzed deeply. On this basis, the research will adopt the following log-linear model [3]:
12
0 1
ln t j ln jt t j
y β β x ε
=
= +
∑
⋅ +Where: regression cumulate β0 is a constant term; βj (j=1, 2,L12) is an elastic coefficient of a factor
( 1, 2, 12) j
x j= L to the urbanization level x , namely that growth rate of 0 βj%of urbanization level is caused when
j
x is increased by 1% each time; εtis a random error term, which indicates influences from other random factors
is basically at the unit-digit order of magnitudes and much smoother than original data, eliminating influences from different units of regression variables and making effects of the factors on path selection of new urbanization in Jiangxi comparable.
(2) Analysis of empirical results
According to the theoretical model of influence factors of new urbanization path selection in Jiangxi and in combination with regression analysis of principal components, the paper obtains empirical results through compatibility test and parameter estimation of variables in order and discusses the results.
① Variable test
Before factor analysis of ln , lnY X1,L lnX12 with the SPSS Statistics 18.0 software, economic measurement tests such as compatibility test and Bartlett’s Test of Sphericity shall be firstly conducted to independent variables. Test results are shown in Table 4.
Table 4 Tests of KMO and Bartlett
Kaiser-Meyer-Olkin measurement of sufficiency degree of sampling 0.623
Bartlett’s Test of Sphericity
Approximate chi-square 402.666
df 78
Sig. 0.000
It is shown in Table 4 that the measured appropriateness value of KMO test is 0.623, indicating that the data is applicable in factor analysis; the chi-square statistical value of Bartlett’s Test of Sphericity is 402.666 and the significance level under the freedom degree of 78 is 0.000, reaching the significant level and also indicating that a factor analysis method can be applied to data.
②Parameter estimation
Based on completion of above relevant tests, influence factors of new urbanization path selection in Jiangxi are extracted through principal component analysis with SPSS Statistics 18.0 [1] software, and contribution rates of rotated factor variances are obtained (as shown in Table5).
Table5 Characteristic Root and Factor Variance Contribution Rate
Component Initial Characteristic Value Extract Square and Load
Total Variance % Accumulation % Total Variance % Accumulation %
1 10.201 78.468 78.468 10.201 78.468 78.468
2 1.483 11.407 89.876 1.483 11.407 89.876
3 .712 5.478 95.353
4 .246 1.889 97.243
5 .190 1.463 98.706
6 .108 .830 99.536
7 .034 .263 99.799
8 .017 .132 99.931
9 .004 .031 99.963
10 .003 .020 99.983
11 .002 .013 99.996
12 .000 .003 99.999
13 6.628E-5 .001 100.000
Extraction method: principal component analysis.
Fig. 1 Scree Extraction of Principal Components
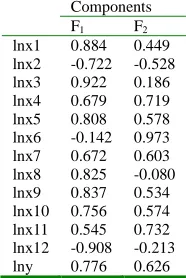
Table6 Rotated Factor Load Matrix a
Components
F1 F2
lnx1 0.884 0.449
lnx2 -0.722 -0.528
lnx3 0.922 0.186
lnx4 0.679 0.719
lnx5 0.808 0.578
lnx6 -0.142 0.973
lnx7 0.672 0.603
lnx8 0.825 -0.080
lnx9 0.837 0.534
lnx10 0.756 0.574
lnx11 0.545 0.732
lnx12 -0.908 -0.213
lny 0.776 0.626
Extraction method: principal component analysis.
Rotation method: orthogonal rotation method with Kaiser Standardization. a. Rotation is converged after iteration for three times.
It is shown in Table 6 that the rotated factor F1 has relatively big loads on variables X1, X3, X4, X5, X7, X8, X9, X10,
X11 and Y and the factor explains 78.468% of overall information. Among these explanatory variables, the factor has
the biggest load on X3 (proportion of employees number of the secondary industry in total employment) and the
secondary biggest load on X1 (per capita GDP); the factor also has relatively high loads on X9 (investment per capita
in social fixed assets), X8 (proportion of expenses for education, science, culture and health undertakings in local
financial expenditures) as well as X5 (income gap between urban and rural residents), Y (urbanization rate), X10
(highway mileage), X4 (proportion of employees number of the tertiary industry in total employment), X7 (number of
college students among ten thousand people) and X11 (ratio of commercialization rates of urban and rural
agricultural products). Information about the first factor F1 shows that it is urgent to increase proportion of
employees number of the secondary industry in total employment and per capita GDP during new urbanization path selection in Jiangxi; it is basically required in Jiangxi and during new urbanization path selection in Jiangxi to promote and strengthen supporting to education, science, culture and health undertakings, accelerate structural transformation, shorten urban and rural differences and realize sustainable development of national economy. Increase of economic benefits shall become an important strategy in new urbanization path selection in Jiangxi; meanwhile, labor force employment and construction of infrastructures in cities and towns shall not be ignored as well. The second factor F2 has big loads on X6, X4, X7, X5, X10 and X9, indicating that F2 mainly reflects influences
of registered urban unemployment rate, proportion of employees number of the tertiary industry in total employment, Scree Figure
C
h
ar
ac
te
ris
tic
V
al
u
e
college student number per ten thousand people, income gap between urban and rural residents, highway mileage and investment per capita in social fixed assets and so forth, and explains 11.407% of overall information. Information about the second factor F2 indicates that it is of important realistic significance to promote employment
of labor force in non-agricultural industries, strengthen supporting to education, science, culture and health undertakings, improve urban and rural infrastructures and improve urban market integration degree in Jiangxi and during new urbanization path selection in Jiangxi. This result conforms to expectations. In order to analyze elasticity of each factor in new urbanization path selection in Jiangxi, the score coefficient of each factor is obtained. Results are shown in table7.
Table 7 Matrix of Factor Score Coefficients
Components
1 2
lnx1 .129 -.018
lnx2 -.062 -.065
lnx3 .210 -.157
lnx4 -.002 .170
lnx5 .073 .066
lnx6 -.301 .515
lnx7 .028 .115
lnx8 .254 -.261
lnx9 .093 .037
lnx10 .059 .078
lnx11 -.043 .212
lnx12 -.199 .139
lny .051 .098
Extraction method: principal component analysis.
Rotation method: orthogonal rotation method with Kaiser Standardization.
Values of two principal factors are computed for regression with lnY. The following results are obtained with Eviews 6.0:
LNY = 0.0771LNX9 - 0.1582LNX8 + 0.03585LNX7 - 0.0711LNX6 - 0.1952LNX5 + 1.02817677301*LNX4 + 0.4734LNX3 + 0.0786LNX2 + 0.5852LNX12 + 1.4566*LNX11 + 0.1041*LNX10 + 0.0351*LNX1 - 7.2028
R2=0.999859, Adjusted-R2=0.999012, F-statistic=1181.081, DW=2.782303
It is shown by checking the DW distribution table that dL = 0.861, du =1.562 and du<DW<4-dL under the significance level of 5% and no self-correlation exists. This result is very ideal and passes all the econometrics tests.
③Results and discussion
According to above regression results, the sort of absolute values of elastic coefficients of the explanatory variables in new urbanization path selection in Jiangxi is (as shown in Table8). As for affecting orientations of the explanatory variables, income gap between urban and rural residents (X5), registered urban unemployment rate (X6) and proportion of expenses for education, science, and culture and health undertakings in local financial expenditures (X8) bring negative influences to new urbanization path selection in Jiangxi.
Table8 Estimation of Elastic Values of Each Influence Factor of New Urbanization Development in Jiangxi
Regression coefficient β0 β1 β2 β3 β4 β5 β6
Estimated value -7.2028 0.03514 0.07865 0.47336 1.02818 -0.19516 -0.07108
i
β sort 9 6 4 2 10 12
Regression coefficient β7 β8 β9 β10 β11 β12
Estimated value 0.03585 -0.15818 0.07706 0.10415 1.45660 0.58516
i
β sort 8 11 7 5 1 3
industry in total employment, and proportion of employees number of the tertiary industry in total employment as well as the maximum or relatively big positive elastic coefficients of new urbanization path selection in Jiangxi. Secondly, it is very important to develop economy, shorten income gap between urban and rural residents, improve labor force quality and improve urban and rural infrastructure in order to boost new urbanization path selection in Jiangxi. These aspects can be reflected in variables such as per capita GDP, income gap between urban and rural residents, college student number per ten thousand people, investment per capita in social fixed assets and highway mileage as well as relatively small positive elastic coefficients of new urbanization path selection in Jiangxi. Thirdly, the urban-rural separated household system, employment policies, market system, unbalanced development of economy and society and so forth have become important barriers of new urbanization path selection in Jiangxi, which can be reflected in variables such as deviation degree of a non-agricultural industrial employment structure, ratio of commercialization rates of urban and rural agricultural products, and proportion of expenses for education, science, culture and health undertakings in local financial expenditures as well as the maximum or relatively big negative elastic coefficients of new urbanization path selection in Jiangxi. Among other variables with positive effect, per capita GDP (Xl), college student number per ten thousand people (X7) and investment per capita in social
fixed assets (X9) may hinder new urbanization path selection in Jiangxi to a certain extent.
CONCLUSION
Through deep analysis of above empirical results, we can further obtain the following acquaintances:
(1) Sustainable and stable development of economy is a basic condition for new urbanization path selection in Jiangxi;
(2) Optimization and upgrading of the industrial structure are basic channels for new urbanization path selection in Jiangxi;
(3) Strengthening of infrastructure construction is a necessary premise for new urbanization path selection in Jiangxi;
(4) Cultivation of technological innovation atmosphere and capability is an important motivation for new urbanization path selection in Jiangxi;
(5) Reasonable system arrangement is an important guarantee for new urbanization path selection in Jiangxi.
As a systematical project, new urbanization path selection is a course with mutual conjunction and actions of multiple factors. According to theoretical bases and actual situations in Jiangxi and in conformation with basic principles of scientificity, comprehensiveness and comprehensiveness, principal influence factors of new urbanization path selection in Jiangxi are characterized by coexisting of new and traditional factors: on one side, factors such as information, knowledge, technology, ecology and culture have shown increasingly prominent influences on new urbanization path selection in Jiangxi; on the other side, factors such as economic development, industrial development, infrastructures and institutional environment still stay at decisive or foundational positions to a certain extent, wherein three pairs of contradictions including contradictions between fairness and efficiency, between government and market, between cities and villages shall be handled from beginning to end. By selecting the theoretical model and the empirical method and applying the SPSSStatistics 18.0 [1] and Eviews 6.0 [5] software, the paper conducts measurement researches such as compatibility test and parameter estimation to main influence factors of new urbanization path section in Jiangxi. It is shown in results that industrial improvement, and sufficient and stable non-agricultural industrial employment chances are important conditions and guarantees for new urbanization path selection in Jiangxi; it is very important to develop economy, shorten income gap between urban and rural residents, improve labor force quality and improve urban and rural infrastructure in order to boost new urbanization path selection in Jiangxi; the urban-rural separated household system, employment policies, market system, unbalanced development of economy and society and so forth have become important barriers of new urbanization path selection in Jiangxi and may hinder new urbanization path selection in Jiangxi to a certain extent.
REFERENCES
[1] Wen Huizhong. Research on New Urbanization Development Paths in Our Country [J]. Business Economy. p.1-8, 2013 (6).
[2] Du Qiang, Jia Liyan. From Entry to Master of SPSS Statistical Analysis [M]. Beijing: Posts and Telecom Press. p.248-305, 2011.
[3] Wu Jiang. Research on New Urbanization Propulsion Path in Chongqing [D]. Chongqing: Southwest University. June, 2010.
[4] Editorial Department of Chinese Statistical Yearbook. Statistical Yearbook of Jiangxi [M].Beijing: China Statistics Press.