Journal of Chemical and Pharmaceutical Research, 2017, 9(12):1-8
Research Article
CODEN(USA) : JCPRC5
ISSN : 0975-7384
1
Analytical Method Development and Validation of Entacapone Drug by
Modern LC-MS/MS Method to Quantify the Genotoxic Impurity
Murali Krishna Prasad Vallabhaneni
1,2*, Anjaneyulu Yerramilli
1, Rajendiran
Chinnapillai
2and Yesu Babu Nalamolu
21
Department of Chemistry, JNTU University, Hyderabad, India
2Research and Development Centre, Suven Life Sciences Ltd., Jeedimetla, Hyderabad, India
_____________________________________________________________________________
ABSTRACT
A new high sensitive and specific LC-MS/MS (Liquid chromatography coupled with tandem mass spectrometric detection) method was developed and validated for the determination of 2-Chloro-N,N’-diethylacetamide (CDEA), a genotoxic impurity, in Entacapone drug substance. Hitherto there is a method known for identification of DECA in Entacapone. The successful separation of Entacapone and 2-Chloro-N,N’-diethylacetamide (CDEA) was achieved using Zorbax SB Aq column (Size: 4.6 × 250 mm, 5 µm particle size) with mobile phase consisting of 0.1% formic acid in water (50:50 v/v) as Mobile phase-A and Acetonitrile (100% v/v) as Mobile phase-B. High sensitive detection was achieved with “Applied Biosystems, Sciex, API-4000” Mass spectrometer and “API 4000, MDS Sciex, Toronto/Canada” Mass Detectors. As part of the method validation, system suitability, specificity, limit of detection (LOD), limit of quantification (LOQ), linearity, accuracy, precision, and stability of stock solutions were determined.
Keywords: Entacapone; Genotoxic impurity identification; Validation; LC-MS method
_____________________________________________________________________________
INTRODUCTION
Entacapone is a catechol-O-methyltransferase inhibitor (COMT inhibitor), used for the treatment of Parkinson’s disease in combination with other medications like carbidopa and levodopa. Entacapone is also used for the treatment of end-of-dose “wearing-off” in patients with parkinson’s disease in combination with carbidopa and levodopa. It is a nitrocatechol-structured compound. Entacapone is chemically known as (E)-2-cyano-3-(3,4-dihydroxy-5-nitrophenyl)-N,N’-diethyl-2-propenamide. Its empirical formula is C14H15N3O5 and its molecular
2
Figure 1: Chemical structure of Entacapone
Several synthetic methods were reported for the preparation of Entacapone [11-18]. Recently Veerareddy A and Reddy GS reported a new synthetic method for the preparation of Entacapone from methoxy-4-iodophenol and 2-cyano-N,N-diethylacrylamide [19]. Since, Entacapone exists in high dose levels (200 mg) in commercial formulation, there is a need for identifying all the potential impurities which originates from different synthetic routes and their quantification with advance instrumental analytical methods. 2-Chloro-N,N’-diethylacetamide (CDEA) is the starting material for manufacture of N,N’-diethyl-2-cyano acetamide (DECA) which is used as key intermediate in the preparation of Entacapone drug substance [19]. CDEA is considered as potential genotoxic impurity based on structurally altering functional groups. There is a chance of carryover of CDEA into the final Entacapone drug substance and hence it is required to quantify the levels of CDEA in final Entacapone drug substance. None of the prior art references discloses method for the quantification of CDEA in Entacapone drug substance.
Different analytical methods were reported for determination of Entacapone [7-10,20-23]. The reported methods describe about the characterization of Entacapone, degradation studies, estimation of assay and impurity profile for both drug substance and drug product as well in the combination drug product. But quantification of Genotoxic impurity i.e., CDEA was not reported. Hence, the objective of the present work was to develop and validate a new LC-MS method for quantification of CDEA in Entacapone and validate the method according to ICH guidelines [24-27] and US FDA guidance [28]. The chemical name and structure of CDEA is given in Figure 2.
Figure 2: Chemical structure of 2-chloro-N,N’-diethylacetamide (CDEA)
EXPERIMENTAL SECTION
Standards and Reagents
Entacapone and 2-Chloro-N,N-diethylacetamide (CDEA) were obtained from Suven Life sciences Ltd., Hyderabad, India. In addition, analytical reagent grade Formic acid, Methanol and Acetonitrile was purchased from Merck. HPLC grade water was used from Milli-Q water purification system. The chemical names of the Entacapone and CDEA were given in Figures 1 and 2.
Instrumentation and Software
[image:2.612.227.387.449.554.2]3
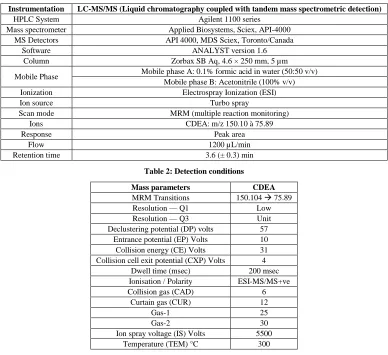
Table 1: LC-MS/MS conditions
Instrumentation LC-MS/MS (Liquid chromatography coupled with tandem mass spectrometric detection)
HPLC System Agilent 1100 series
Mass spectrometer Applied Biosystems, Sciex, API-4000
MS Detectors API 4000, MDS Sciex, Toronto/Canada
Software ANALYST version 1.6
Column Zorbax SB Aq, 4.6 × 250 mm, 5 µm
Mobile Phase Mobile phase A: 0.1% formic acid in water (50:50 v/v)
Mobile phase B: Acetonitrile (100% v/v)
Ionization Electrospray Ionization (ESI)
Ion source Turbo spray
Scan mode MRM (multiple reaction monitoring)
Ions CDEA: m/z 150.10 à 75.89
Response Peak area
Flow 1200 µL/min
[image:3.612.112.500.84.439.2]Retention time 3.6 (± 0.3) min
Table 2: Detection conditions
Mass parameters CDEA
MRM Transitions 150.104 75.89
Resolution — Q1 Low
Resolution — Q3 Unit
Declustering potential (DP) volts 57
Entrance potential (EP) Volts 10
Collision energy (CE) Volts 31
Collision cell exit potential (CXP) Volts 4
Dwell time (msec) 200 msec
Ionisation / Polarity ESI-MS/MS+ve
Collision gas (CAD) 6
Curtain gas (CUR) 12
Gas-1 25
Gas-2 30
Ion spray voltage (IS) Volts 5500
Temperature (TEM) °C 300
Preparation of Solvents and Reagents
Diluent: Water / Acetonitrile solution (50:50, v/v). Mobile phase A: 0.1% Formic acid in water v/v. Mobile phase B: Acetonitrile (100% v/v). Injector Wash Solvent: Methanol (100% v/v).
CDEA stock solution (Solution A: 1 mg/mL): Weighed accurately about 50 mg of CDEA, dissolved in 10 mL of diluent and made up the volume to 50 mL.
CDEA Stock solution (A-1: 10 µg/mL): Pipetted 1 mL of solution A into 100 mL volumetric flask and made up the volume with diluent.
CDEA Stock solution (A-2: 100 ng/mL): Pipetted 1.0 mL of solution A-1 into 100 mL volumetric flask and made up the volume with diluent.
CDEA Stock solution (A-3: 20 ng/mL): Pipetted 2.0 mL of solution A-2 into 10 mL volumetric flask and made up the volume with diluent.
Entacapone stock solution (B: 1 mg/mL): Weighed accurately about 50 mg of Entacapone, dissolved in 10 mL of diluents and made up the Volume to 50 mL.
4
RESULTS AND DISCUSSION
HPLC Method Development and Transfer to LC-MS/MS Method
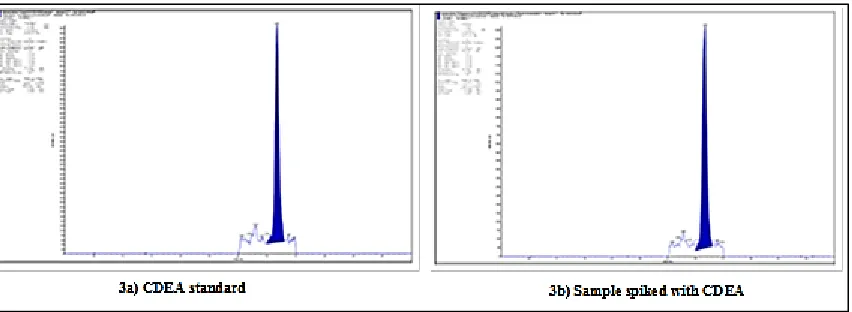
The method reported by D Purnachand et al. [23] was verified for detection of CDEA in Entacapone drug substance by HPLC method as all reported impurities were well quantified in single method. Similar chromatographic conditions were adopted for initial method verification. The peak for CDEA was identified at RT 9.150 min and well separated from Entacapone drug substance peak. However, limit of quantification (LOQ) for CDEA impurity using this method was 24 ppm. Since, CDEA is a genotoxic impurity and considering the maximum daily dose of the Entacapone, LOQ for CDEA should be less than 1.25 ppm. Hence it was concluded that, by using HPLC, CDEA cannot be quantified below 24 ppm. Hence, an alternative method shall be developed with higher sensitivity. Since, the HPLC method was unable to detect the CDEA to an acceptable level, decided to develop the new method with high sensitive detector like LC-MS/MS (Liquid chromatography coupled with tandem mass spectrometric detection). Several experimentations were conducted to optimize the method parameters and finally optimized the conditions provided at Tables 1 and 2. The chromatograms obtained for CDEA standard and Sample was shown in Figure 3.
Figure 3: Chromatogram of CDEA standard and sample
Method Validation System suitability:
[image:4.612.96.522.246.402.2]A system suitability test (SST) was performed as routine at the beginning of each day with six replicate injections of CDEA at a concentration of 100% standard level (0.750 ng/mL) solution. The purpose of the SST was to check the chromatographic conditions by evaluation of the retention time of analyte, the peak shape. The fluctuation of the retention time was evaluated as RSD for each batch considering all analyzed samples. The RSD values for area response and retention time were within the acceptance criteria of NMT 5% for peak Retention Time and NMT 10% for peak area. The system suitability test (SST) results were given in Table 3.
Table 3: System suitability results
Day of analysis Mean peak area response RSD for peak area response Mean retention time RSD for retention time
Day 1 6152.833 2.735 3.631 0.516
Day 2 4575.167 6.295 3.656 0.17
Specificity/selectivity:
5
Table 4: Specificity results
S.
No Sample name
Peak area response of CDEA
Retention time of CDEA for Peak identification
1 Diluent-1 0
3.6
2 Entacapone Sample-01 3844
3 Entacapone Sample-02 3828
4 Entacapone Sample-03 3623
5 Entacapone Sample-01 (Spiked with CDEA, 0.750 ppm
Concentration) 9515
6 Entacapone Sample -02 (Spiked with CDEA, 0.750 ppm
Concentration) 8767
7 Entacapone Sample -03 (Spiked with CDEA, 0.750 ppm
Concentration) 8880
8 CDEA standard-01 5845
9 CDEA standard -02 5496
10 CDEA standard -03 5735
Limit of detection (LOD) and Limit of quantitation (LOQ):
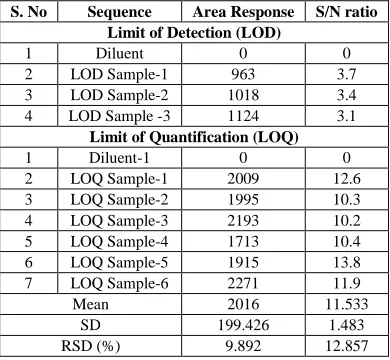
In order to determine the limit of detection, a standard solution containing CDEA equivalent to 0.083 ng/mL was analyzed in triplicate. The Signal-to-Noise ratio (S/N ratio) calculated were more than 3 for each injection and the peaks were well detected. The theoretically calculated LOD value (from the signal to noise ratio method) for S/N=3 was 0.073 ng/mL. In order to determine the limit of quantitation, a LOQ standard solution containing CDEA equivalent to 0.250 ng/mL was analyzed in six replicates. The S/N ratio calculated was more than 10 for each injection and the RSD of the peak areas was 9.892%. The theoretically calculated LOQ value (from the signal to noise ratio method) for S/N=10 was 0.217 ng/mL, LOD and LOQ results for CDEA was given in Table 5.
Table 5: Limit of detection (LOD) and Limit of quantification (LOQ) results
S. No Sequence Area Response S/N ratio
Limit of Detection (LOD)
1 Diluent 0 0
2 LOD Sample-1 963 3.7
3 LOD Sample-2 1018 3.4
4 LOD Sample -3 1124 3.1
Limit of Quantification (LOQ)
1 Diluent-1 0 0
2 LOQ Sample-1 2009 12.6
3 LOQ Sample-2 1995 10.3
4 LOQ Sample-3 2193 10.2
5 LOQ Sample-4 1713 10.4
6 LOQ Sample-5 1915 13.8
7 LOQ Sample-6 2271 11.9
Mean 2016 11.533
SD 199.426 1.483
RSD (%) 9.892 12.857
Accuracy (% recovery):
[image:5.612.209.404.361.541.2]6
Table 6: Accuracy (%recovery) results
Sample No.
Entacapone sample LOQ Solution 100% Solution 200% Solution
NA 0.250 ng/mL 0.750 ng/mL 1.501 ng/mL
Estimated Conc.
% Recovery
Estimated Conc.
% Recovery
Estimated Conc.
% Recovery
Estimated Conc.
%Recove ry
Solution-1 0.581 NA 0.805 113.467 1.257 98.089 1.876 90.251
Solution-2 0.447 NA 0.759 95.067 1.305 104.489 1.983 97.38
Solution-3 0.536 NA 0.753 92.667 1.211 91.956 1.879 90.451
Mean 0.521 NA 0.772 100.4 1.258 98.178 1.913 92.694
SD 0.068 0.028 0.047 0.061
RSD (%) 13.081 3.683 3.737 3.186
Linearity and range:
For the CDEA profiles in Entacapone, a minimum 0.250 ng/mL (LOQ) to 1.500 ng/mL (200% of the specified limits) was considered as the range. A linear relationship for CDEA was evaluated across the range of analytical procedure containing seven non-zero standards. Linearity and range results were given in Table 7 and linearity graph is given in Figure 4.
Table 7: Linearity and range results
Level Number
Linearity and Range-1 Linearity and Range-2
(Series-1) (Series-2)
Concentration Area % Accuracy Concentration (ng/mL) Area % Accuracy
Level 1 0.25 2176 109.95 0.251 2004 90.528
Level 2 0.4 3231 110.699 0.401 3207 101.816
Level 3 0.5 3569 99.32 0.501 3467 89.3
Level 4 0.749 4831 93.118 0.752 6017 110.559
Level 5 0.999 6422 95.172 1.003 7549 105.891
Level 6 1.249 7995 96.178 1.254 8458 95.601
Level 7 1.499 10388 105.553 1.504 10396 99.12
Regression coefficient (R2) 0.9872 0.9874
Slope 6281.268 6641.634
[image:6.612.86.518.290.631.2]Intercept 449.709 495.215
Figure 4: Linearity curve in the range of LOQ to 200% of the specification limit
System precision:
7
Method precision:
To evaluate the method precision, six different solutions were prepared by spiking CDEA into Entacapone at specification limit concentration and injected. CDEA peak area of each preparation was calculated individually. The % RSD of area response of CDEA was 3.920%. Hence, the method was precise.
Stability of system suitability solution and CDEA stock solution:
The stability of the system suitability solution and CDEA stock solution (solution A) over the time were evaluated up to 25 hours at room temperature. The test was performed by fresh preparation of system suitability solution. The percent (%) change for system suitability solution and CDEA stock solution (solution A) after 25 hours when compared with freshly prepared solutions were -3.529% and +7.771% respectively. Hence, the system suitability solution and CDEA stock solution (solution A) can be used up to 25 hours after preparation.
CONCLUSION
The method validated in this study was suitable for its intended purpose, which is the quantification of CDEA in Entacapone using Liquid Chromatography with Tandem Mass Spectrometric detection. The method was validated in the range of 0.250 - 1.500 ng/mL (0.250 - 1.500 ppm) for CDEA in Entacapone. The method was specific, accurate, linear and precise over the range. The stock solutions were stable up to 25 hours at room temperature. The proposed method can be successfully applied for the quantification of CDEA in Entacapone in routine analysis in quality control.
ACKNOWLEDGMENTS
The authors would like to acknowledge Suven Life Sciences Limited, Hyderabad, India, for providing necessary facilities and support in completing this work.
REFERENCES
[1] https://en.wikipedia.org/wiki/Entacapone [2] https://www.drugbank.ca/drugs/DB00494 [3] https://www.drugs.com/cdi/entacapone.html
[4] https://pubchem.ncbi.nlm.nih.gov/compound/entacapone [5] http://www.rxlist.com/comtan-drug.htm
[6] http://www.sigmaaldrich.com/catalog/product/aldrich/250996?lang=en
[7] Entacapone monograph; European Pharmacopoeia, 9th Edition. EDQM Council of Europe, F67081, Strasbourg, France, 2017, 2535-2537.
[8] Entacapone monograph; British Pharmacopoeia, BP 2017. British Pharmacopoeia Commission, London, United Kingdom, 2017, 864-865.
[9] Entacapone monograph; The United States Pharmacopoeia and National Formulary, USP40-NF35. US pharmacopoeial convention, Rockville, USA, 2017, 3987-3988.
[10] Entacapone monograph; Indian Pharmacopoeia, IP 2014. The Indian Pharmacopoeia Commission, Ghaziabad, India, 2014, 1662-1663
[11] MJM Siddiqui, ARK Rashid and PY Ram. US Patent, US2007/0004935 A1, 2007.
[12] BD Pandurang, KL Parven, KP Anand and RD Dharmesh. US Patent, US2006/0258877 A1, 2006. [13] BD Pandurang, KL Parven, KP Anand and RD Dharmesh. WTO Patent, WO2007113845 A1, 2007. [14] BD Pandurang, KP Anand, RD Dharmesh, RD Bhimsing and KL Parven. US Patent, US 2010/0234632
A1, 2010.
[15] BD Pandurang, KP Anand, RD Dharmesh, RD Bhimsing and KL Parven. WTO Patent, WO2008062432 A2, 2008.
[16] A Veerareddy, C Rajendiran, MSM Qadeeruddin and J Venkat. WTO Patent, WO2005063693 A1, 2005. [17] C Rajendiran, AVeerareddy, K Indrasenareddy and J Venkat. WTO Patent, WO2007094007 A1, 2007. [18] G Srikanth; KR Uttam; DVN Srinivasrao; GP Badarinadh; P Lavanya; I Aminul. Synthetic
Communications. 2012, 42, 1359-1366.
[19] A Veerareddy; G Surendrareddy. Synthetic Communications. 2014, 44, 1274-1278.
8
[21] N Soukhova; Z Kassymbek; S Bradby; A Martin-Esker; P White; S Wahab. J Pharm Biomed Analysis. 2011, 54(4), 860-865.
[22] YM Issa; MEM Hassoun; AG Zayed. J Liquid Chromatographic Related Technol. 2011, 34(19), 2433-2447.
[23] D Purnachand; AVeerareddy; B Ramadevi; ChVSL Kameswarrao; B Madhusudhanreddy. J Chromatographic Sci.2016, 54(8), 1310-1323.
[24] ICH Q1A(R2): Stability testing of new drug substances and products. Geneva, Switzerland, 2003.
[25] ICH Q1B: Stability Testing: Photostability Testing of New Drug Substances and Products. Geneva, Switzerland, 1996.
[26] ICH Q2(R1): Validation of Analytical Procedures: Text and Methodology. Geneva, Switzerland, 2005. [27] ICH Q3A(R2): Impurities in New Drug Substances. Geneva, Switzerland, 2006.