Journal of Chemical and Pharmaceutical Research, 2015, 7(6):855-862
Research Article
ISSN : 0975-7384
CODEN(USA) : JCPRC5
Evaluation of electrocoagulation process performance with anionic
polyelectrolit in the removal of Mn (II) and Fe (II) from surface water
-application of response surface methodology (RSM)
Zeinab Jafari Motlagh
a, Jamshid Derayat
b, Meghdad Pirsaheb
b٭, Ali Akbar Lorestani
Zinatizadeh
c, Amir Mohammad Mansouri
d, Kiomars Sharafi
b,eand Reza Jafari Motlagh
faSocial Development & Health Promotion Research Center, Kermanshah University of Medical Sciences,
Kermanshah, Iran
b
Department of Environmental Health Engineering, School of Public Health, Kermanshah University of Medical Sciences, Kermanshah, Iran
cWater and Wastewater Research Center (WWRC), Razi University, Kermanshah, Iran dDepartment of Analytical Chemistry, Faculty of Chemistry, Razi University, Kermanshah, Iran eEnvironmental Health Engineering Department, Tehran University of Medical Sciences, Tehran, Iran
f
Department of Chemistry, Institute for Advanced Studies in Basic Sciences (IASBS), Zanjan, Iran
_____________________________________________________________________________________________
ABSTRACT
Electrocoagulation is an electrochemical method for treatment of water and wastewater. The present study has been evaluated the performance of electrocoagulation method with anionic polyelectrolit in batch mode for removal of iron and manganese from surface water. Soleymanshah dam of sonqor located in the northeastern part of Kermanshah Province, Iran. The water of this dam contains high level manganese. The design of experiments was based on a central composite design (CCD), and the analyze of data carried out using response surface methodology (RSM). According to the analyze of the process, the effects of significant variables such as voltage (5-25), reaction time (20-60), temperature (10-30), anionic polyelectrolit (0.1-0.3 mg/L) on the removal efficiency of iron and manganese from surface water were investigated, using aluminium electrodes at natural pH. Iron and manganese concentrations and aluminum residual in the treated water were measured using inductively coupled plasma. The results of the ANOVA analysis showed that the model fitted well with manganese and iron reduction. At the optimum conditions (voltage of 5 volt, reaction time of 20 min, temperature of 10 °C and anionic polyelectrolit 0.3 mg/L). In this condition, manganese and iron removal were 77.5%, 75% respectively and aluminum residual in treated sample was 0.154 mg/L. The results showed that electrocoagulation process with anionic polyelectrolit is an effected method for manganese and iron removal from surface water.
Key words: electrocoagulation, anionic polyelectrolit, surface water, manganese, iron, aluminum electrode,
response surface method.
_____________________________________________________________________________________________
INTRODUCTION
______________________________________________________________________________
water will contain some impurities. Therefore, the quality of surface waters will depend on the environment of the catchment [1].
Among the inorganic elements entered naturally and artificially into water resources, iron and manganese are very important [2]. Iron and manganese, which are the most abundant metals in the earth’s crust, occur naturally in water resources. Water penetration through soil can dissolve minerals containing manganese and iron [3]. Iron and manganese compounds are in the water as sulfates, carbonates, chloride, phosphates and also in the form of humic compounds [4]. These elements are usually present in water as divalent ions (Fe+2 and Mn+2) [5]. According to the Safe Drinking Water Act (SDWA), drinking water standards for iron and manganese are 0.3 mg/L and 0.05 mg/L, respectively [6]. At values higher than standard levels of iron and manganese, water quality problems such as metallic taste, odor and brown color, stain and deposition of iron and manganese precipitates in the water distribution systems will be created [7, 8]. These compounds in wastewater cause colouration and also represent a serious risk to aquatic life. In addition, their presence in drinking water constitutes a potential human health hazard Physicochemical methods such as lime softening, ion exchange and oxidation followed by filtration with different agents have been successfully tested for the elimination of these metals from water [2, 9]. However, these methods often lead to secondary products that are not significantly eliminated by the same technique and can be more hazardous than the original compound. The oxidation of manganese by aeration is a slow process in natural pH [10]. Therefore, manganese oxidation is conventionally done by a strong oxidant such as chlorine, hypochlorite, potassium permanganate, chlorine dioxide or ozone [11]. Disadvantages of chemical treatments are high costs, neutralization of the effluent and problems of sludge disposal [12]. The need to disinfect and safe drinking water and also disadvantages of mentioned methods has encouraged both researchers and engineers to develop new and cost-effective methods for Mn and Fe removal [13].
Among the different techniques presented to eliminate heavy metals from water solutions, the coagulation procedure has proved to be very efficient. The coagulation usually follows a precipitation step occurring after an increase of pH obtained by addition of NaOH or lime. Coagulation is accomplished by adding coagulants like iron chloride FeCl3 or aluminum sulfate Al2(SO4)3 to the medium. Electrocoagulation pretreatment is an alternative to
conventional chemical coagulation, where the ions responsible for the coagulation, mainly Fe3+ or Al3+, are in situ generated by the anodic dissolution of iron or aluminum electrodes. The advantages of electrocoagulation over conventional chemical coagulation include (1) no alkalinity consumption, (2) no change in bulk pH, (3) the direct handling of corrosive chemicals is nearly eliminated and (4) can be easily adapted for use in portable water treatment units especially during emergencies.
In the recent years, electrocoagulation process has been used for the removal of oil and grease [15] chemical oxygen demand (COD) [16], dyes [17], heavy metals [18], turbidity [19] and microorganisms from drinking water and wastewaters [20]. The removal mechanisms of contaminant in electrocoagulation process may involve coagulation, oxidation, reduction, decomposition, deposition, absorption, adsorption, sedimentation and flotation [21]. When a direct current is applied to the electrodes, the anode electrode is dissolved by electrolysis, and generates metallic ions which are good coagulants [22]. At the cathode electrode, the OH− ions are produced during water electrolysis and can react with the metallic ions and produce metal hydroxides [23, 24]. The metal hydroxides produced (Al(OH)3 or Fe(OH)3) can adsorb and settle both soluble and colloidal contaminants.This study
evaluations electrocoagulation process and anionic polyelectrolit (with Aluminum electrode) in the removal of Mn (II) and Fe (II) from surface water by application of response surface methodology (RSM).
EXPERIMENTAL SECTION
2.1. Experimental
Table1. Properties of water sample
Rows Parameter Quantity range I Manganese (mg/L) 0.1- 0.582 II Iron (mg/L) 0.09- 0.2 III Total hardness(mg/L caco3) 180-240
IV Total alkalinity(mg/L caco3) 180-247
V Turbidity (NTU) 0.5-0.8
VI EC (µs/cm) 484-539
VII pH 7.6- 8
2.2 Electrocoagulation (EC) reactor configuration
Electrical coagulation operation of water samples was carried out in a Plexiglas reactor (with dimension of 20×20×20cm and effective volum 3 lit) in a batch mode. The EC reactor was equipped to a stirrer. Four electordes with dimensions of 30×30×1mm made of aluminum plates were connected to a digital DC power supply (MICRO,PW-4053S,Iran) in Bipolar-Series connection mode. The distance between electrodes in electrocoagulation cell was 30 mm in all experiments. Before each run, organic impurities and the oxide layer on electrode surfaces were removed by sand paper and then were dipped in a HCL solution for 5 min.
1.Digital D.C.power supply 2.Aluminum electrodes 3. water sample 4.stirring
5. electrocoagulation reactor
Fig1. schematic diagram of the electrocoagulation reactor
2.3. Analytical methods
The residual iron, manganese and aluminum in the water samples were determined using inductively coupled plasma (Perkin Elmer, Optima 7300 DV). pH was measured with Microprocessor pH 537.
2.4. Experimental design
In this study, the Design Expert Software (Stat-Ease Inc., version 6.0.6) was used for the data analysis and design of experiments. The RSM employed in the current study was a central composite design (CCD) involving four different factors, voltage (A), temperature (B) anionic polyelectrolit (C) and reaction time (D). The region of exploration for the process was taken as the area enclosed by voltage (5-25 V), reaction time (20-60 min), temperature (10-30˚C), anionic polyelectrolit (0.1-0.3 mg/L) boundaries (Table 2) . The Mn and Fe removal were evaluated based on the CCD experimental plan. The design consisted of 2k factorial points augmented by 2k axial points and a center point where k is the number of variables. The levels of four operating variables vary from a low to high value which are numerically expressed or coded as -1.5 and 1.5. Intermediate level is coded as ‘‘0’’. These five levels were assessed based on the full facecentered CCD experimental plan. Accordingly, a total of 30 experiments were employed in this work, including 25 experiments designed in a factorial design (including 12 factorial points, 12 axial points and 1 center point), and 5 replications at the center point to get good estimate of
2
1
5
+
-
3
______________________________________________________________________________
[image:4.595.193.404.153.217.2]experimental error. Repetition experiments were conducted after other experiments followed by order of runs designed by central composite design (CCD) as indicated in Table 2.
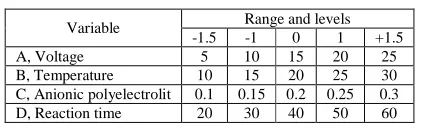
Table 2. Range and levels of the variables
Variable Range and levels -1.5 -1 0 1 +1.5
A, Voltage 5 10 15 20 25
B, Temperature 10 15 20 25 30 C, Anionic polyelectrolit 0.1 0.15 0.2 0.25 0.3 D, Reaction time 20 30 40 50 60
Table3. Experimental conditions and response values of central composite design
Run
Variables Response
Voltage
(volt) Temprature
Anionic polyelectrolit time
Fe removal%
Mn removal%
Residual Al (mg/L)
1 5 10 0.1 20 73.3% 75% 0.184
2 5 10 0.1 60 75% 77.5% 0.309
3 5 10 0.3 20 75% 77.5% 0.154
4 5 10 0.3 60 76.6% 80% 0.228
5 25 10 0.1 20 76.6% 81.25% 0.392
6 25 10 0.1 60 78.3% 82.5% 0.455
7 25 10 0.3 20 78.3% 82.5% 0.465
8 25 10 0.3 60 81.6% 85% 0.501
9 15 15 0.2 40 76.6% 81.25% 0.586
10 15 20 0.2 30 58.3% 80% 0.443
11 15 20 0.2 40 63.3% 82.25% 0.474
12 15 20 0.2 50 66.6% 85% 0.48
13 15 20 0.15 40 60% 82.5% 0.617
14 15 20 0.25 40 63.3% 85% 0.607
15 10 20 0.2 40 55% 77.5% 0.486
16 20 20 0.2 40 65% 86.2% 0.477
17 15 25 0.2 40 61.6% 85% 0.584
18 5 30 0.1 20 70% 76.2% 0.305
19 5 30 0.1 60 73.3% 78.75% 0.39
20 5 30 0.3 20 68.3% 78.75% 0.334
21 5 30 0.3 60 73.3% 82.5% 0.434
22 25 30 0.1 20 71.6% 80% 0.831
23 25 30 0.1 60 78.3% 88.75% 0.861
24 25 30 0.3 20 70% 87.5% 0.732
25 25 30 0.3 60 76.6% 93.75% 0.869
26 15 20 0.2 40 63.3% 82.5% 0.474
27 15 20 0.2 40 63.3% 81.25% 0. 47
28 15 20 0.2 40 63.3% 80% 0.472
29 15 20 0.2 40 65% 81.25% 0.471
30 15 20 0.2 40 65% 82.5% 0.474
2.5 Mathematical modeling
RSM involves screening and codification of the variables, mathematical-statistical treatment of data, and evaluation of the fitted model and the determination of the optimal conditions. RSM describes a model in the form of Eq. (1) to fit the experimental data and by optimization; the coefficients for the model were calculated. The relationship between the responses, input and the quadratic equation model for predicting the optimal variables were identified using the following:
Y= β0 + βi Χi+ βj Χj + β i iΧ i 2+ βj j Χj2 + β ij Χi Χj+….
presentations with contours. This will help to study the simultaneous interaction of the 2 variables on the responses. The experimental conditions and results are depicted in table 3.
RESULTS AND DISCUSSION
3.1. RSM model fitting
The results of iron and manganese removal were described with quadratic and linear polynomial model. In this study, according to the P-values, significant model terms for iron and manganese removal are coded variables (A, B, C, D).
The regression equations based on the coded factors are equations (1), (2) and (3):
Mn removal, % = +82.16+3.90A+1.93B+1.44C+1.67D (1)
Iron removal % = 64.26+1.76 A-2.16B+0.30C+2.06D-8.27A2+38.93B2-11.67C2-8.47D2-0.83B C+0.83 BD
(2)
Al residual, mg/l =+0.51+0.17 A+0.13B+0.041D+0.28 C2-0.32D2+0.056A B (3)
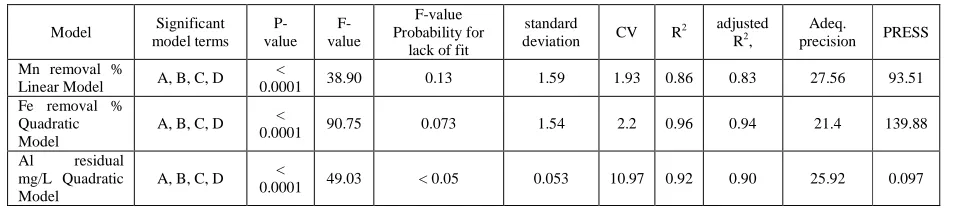
ANOVA results of the linear and Quadratic model in Table 4 showed that the model could describe the manganese and iron removal under operating conditions. This Table demonstrates that the linear model was significant at 95% confidence level with P-values (0.0001). P-values less than 0.05 shows that model terms are significant. In this case A, B, C, D are significant model terms for manganese and iron removal. In the present study, correlation coefficient (R2 = 0.86) and (R2=0.96) were obtained for manganese and iron removal, respectively. Correlation coefficient or R2 explained good fit of the model. In the model, the measure of the signal to noise ratio is Adeq Precision. A ratio greater than 4 was desirable. In this study, Adeq Precision was desirable for both responses in the model, and ratio of 27.56 and 21.4 for manganese and iron removal indicate an adequate signal. In the model, the low value of the coefficient of variation indicated high precision and a good reliability of the experimental results (for manganese CV=1.93 %), (for iron CV = 2.2%).
Table 4. The results of ANOVA for fit of resposes removal efficiency using central composite design
Model Significant model terms
P-value
F-value
F-value Probability for
lack of fit
standard
deviation CV R
2 adjusted
R2, precision Adeq. PRESS
Mn removal %
Linear Model A, B, C, D <
0.0001 38.90 0.13 1.59 1.93 0.86 0.83 27.56 93.51 Fe removal %
Quadratic Model
A, B, C, D <
0.0001 90.75 0.073 1.54 2.2 0.96 0.94 21.4 139.88 Al residual
mg/L Quadratic Model
A, B, C, D <
0.0001 49.03 < 0.05 0.053 10.97 0.92 0.90 25.92 0.097
3.2. Reactions during the electrocoagulation process
According to Faraday's law, reaction time and current density have direct effect on the amount of metal ions delivered into the system [23, 26]. In Table 3, it has been reported that an increase in the voltage and reaction time leads to an increase in the aluminum dissolving. Fig 3 indicates the amount of dissolving aluminum into the system after treatment by different temperatures. It is observed that as temperature increases aluminum dissolving increases, and also iron and manganese removal are affected.
3.3. Effect of the variables studied
3.3.1. Effect of current density and operation time
[image:5.595.61.538.461.565.2]______________________________________________________________________________
effects of this factor in the present study, the design of the experiments were carried out with a voltage in the range of 5 to 25V. The Voltage had an important effect on the energy consumption and operational cost.
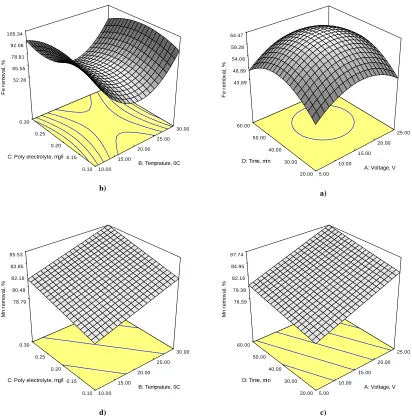
Fig 2(a,c) and fig 3(a) shows the removal of Fe (II), Mn (II) and aluminum residual from surface water as a function of voltage and time. Fig 2(a) shows that an increase in the voltage and reaction time increases iron removal efficiency. Fig 2(c) shows that an increase in the voltage and reaction time increases manganese removal efficiency. This figure also indicates that the higher current density has greater effect on manganese removal. Similar results for the effect of current density on removal efficiency were found by Kobya et al. during the treatment of potable water containing low concentration of arsenic [23] and Ghosh and et al in the removal of Fe(II) from tap water [27]. According to Table 3, a maximum manganese and iron removal was obtained 93.75%, 81.6% respectively. when using voltage 25 V and the reaction time of 60.
43.69 48.89 54.08 59.28 64.47 F e r e m o v a l, % 5.00 10.00 15.00 20.00 25.00 20.00 30.00 40.00 50.00 60.00
A: Voltage, V D: Time, min
a) 52.28 65.55 78.81 92.08 105.34 F e r e m o v a l, % 10.00 15.00 20.00 25.00 30.00 0.10 0.15 0.20 0.25 0.30
B: Temprature, 0C C: Poly electrolyte, mg/l
b) 76.59 79.38 82.16 84.95 87.74 M n r e m o v a l, % 5.00 10.00 15.00 20.00 25.00 20.00 30.00 40.00 50.00 60.00
A: Voltage, V D: Time, min
c) 78.79 80.48 82.16 83.85 85.53 M n r e m o v a l, % 10.00 15.00 20.00 25.00 30.00 0.10 0.15 0.20 0.25 0.30
B: Temprature, 0C C: Poly electrolyte, mg/l
d)
[image:6.595.85.497.262.681.2]
-0.02 0.15 0.33 0.50 0.68
A
l
re
s
id
u
a
l,
m
g
/l
5.00 10.00
15.00 20.00
25.00
20.00 30.00 40.00 50.00 60.00
A: Voltage, V D: Time, min
a) 0.38
0.52 0.65 0.78 0.91
A
l
re
s
id
u
a
l,
m
g
/l
10.00 15.00
20.00 25.00
30.00
0.10 0.15 0.20 0.25 0.30
B: Temprature, 0C C: Poly electrolyte, mg/l
b)
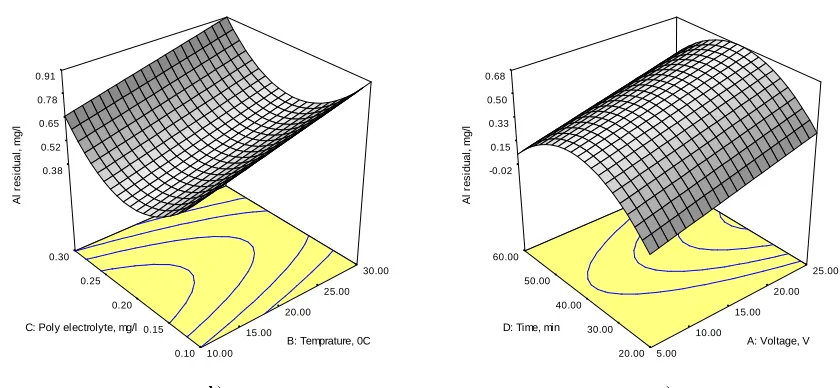
Fig 3.(a) The response surface of aluminum residual (mg/L) as the function of voltage (volt) and reaction time (min). (b) as the function of temperature (°C) and polyelectrolit
3.3.2. Effect of anionic polyelectrolit
The results of Table 3 show that the removal efficiency of iron and manganese, increased with an increase in the anionic polyelectrolit. Also aluminum residual decreased. In the model, anionic polyelectrolit was a significant term at iron and manganese removal from surface water and decrease of aluminum residual.
3.3.3. Effect of temperature
The water temperature has an influence on the electrocoagulation process.The temperature was one of the significant terms of this study. In this model, the rate of anode dissolving at the range of temperatures (10 to 30Ċ) was investigated. The significant effect of temperature on the dissolving aluminum is presented in Table 3. As temperature increased aluminum dissolving increased during the experiments. Fig 2(b,d) indicate the removal of Fe (II) and Mn (II) as a function of temperature and anionic polyelectrolit. It is observed that the manganese removal efficiency, increased with an increase in the temperature, but decreased the iron removal efficiency . Because of that dissolved oxygen decreased with an increase in the temperature and decreased oxidation of Fe+2 to Fe+3. Similar results were found by Mikko Vepsalainen et al. In an investigation of the effects of temperature and initial sample pH on the natural organic matter (NOM) removal with electrocoagulation using response surface method (RSM). In this research temperature had significant effects on aluminum dissolving and DOC removal [28].
CONCLUSION
[image:7.595.86.506.125.319.2]______________________________________________________________________________
This condition was appropriate for cold weather. Aluminum residual of this condition in warm weather was 0.3mg/L, thus in warm weather reaction time should be less than 20 min.
Electrocoagulation process with anionic polyelectrolit is an adequate method for pollution water to iron and manganese with low turbidity .
Acknowledgement
This letter resulted from the thesis, Major of environmental health engineering written by zeinab jafari motlagh, Kermanshah University of medical sciences, Kermanshah, Iran. The authors wish to acknowledge the financial support of carrying out this project from Kermanshah University of medical sciences.
REFERENCES
[1] Matilainen A, Gjessing E, Lahtinen T, Hed L , Bhatnagar A, Sillanpää M. Chemosphere, 2011, 83, 1431– 1442.
[2] Nemade P.D, Kadam A.M, Shankar H.S. Ecological Engineering, 2009, 35, 1152–1157.
[3] Jusoh A.B, Cheng W.H, Lowa W.M, Nora’aini A, Megat Mohd Noor M.J, Desalination, 2005,182, 347–353. [4] Okoniewska E, Lach J, Kacprzak M, Neczaj E. Desalination, 2007, 206, 251–258.
[5] Ellis D, Bouchard Ch, lantagne G. Desalination, 2000, 130, 255-264.
[6] Talaat H.A, Ghaly M.Y, Kamel E.M, Ahmed E.M, Awad A.M. Journal of American Science, 2010, 6, 12. [7]Gouzinis A, Kosmidis N, Vayenas D. V, Lyberatos G. Wat. Res, 1998, 32, 8, 2442-2450.
[8] Qin S, Ma F, Huang P, Yang J. Desalination, 2009, 245, 183–193. [9] Doula M.K. WAT ER RE S E ARCH, 2006, 40, 3167 – 3176.
[10] Tekerlekopoulou A.G, Vasiliadou I.A, Vayena D.V. Biochemical Engineering Journal, 2008, 38, 292–301. [11] Tasneem K.M , Ashraf Ali M, RW13 Assessment of Manganese Removal from Groundwater Using Adsorptive Filtration Media. Proc. of International Conference on Environmental Aspects of Bangladesh (ICEAB10), Japan, Sept, 2010, 200-203.
[12] Vasudevan S, Lakshmi J. Separation and Purification Technology, 2011, 80, 643–651. [13] Shafaei A, Rezayee M, Arami M, NikazarM. Desalination, 2010, 260, 23–28.
[14] Ashima Bagga, Shankararaman Chellam, Dennis A. Clifford, Journal of Membrane Science, 2008, 309 , 82– 93.
[15] Izquierdo J, P. Canizares , M.A. Rodrigo , J.P. Leclerc , G. Valentin , F. Lapicque. Desalination, 2010, 255, 15–20.
[16] Casillas M, Cocke D, Gomesa J, Morkovsky P, Parga J.R, Peterson P. Separation and Purification
Technology, 2007, 56, 204–211.
[17] Eyvaz M, Kirlaroglu M, Selami Aktas T, Yuksel E. Chemical Engineering Journal, 2009, 153, 16–22 [18] Kumar P.R, Chaudhari S, Khilar K, Mahajan S.P. Chemosphere, 2004, 55, 1245–1252.
[19] Merzouka B, Gourich B, Sekkic A, Madanid K, Chibane M. Journal of Hazardous Materials, 2009, 164, 215– 222.
[20]Ghernaout D, Badis A, Kellil A, Ghernaout B. Desalination, 2008, 219, 118–125.
[21] Parga J, Cocke D, Valenzuela J, Gomes J, Kesmez M, Irwin G, Moreno H, Weir M. Journal of Hazardous
Materials, 2005, B124, 247–254.
[22] Yıldız Y.S, Koparal A.S, Keskinler B. Chemical Engineering Journal, 2008, 138, 63–72.
[23] Kobya M, Ulu F, Gebologlu U, Demirbas E, Oncel M. Separation andPurificationTechnology, 2011, 77, 283– 293.
[24] Ghernaout D, Ghernaout B, Saiba A, Boucherit A, Kellil A. Desalination, 2009, 239, 295-308.
[25]American Public Association. Standard Methods For the Examination of Water and Wastewater 20th Edition,
1998, 1060C. 1-34.
[26] Malakootian M , Mansoorian H.J, Moosazadeh M . Desalination, 2010, 255, 67–71. [27] Ghosh D, Solanki H, Purkait M.K, Journal of Hazardous Materials, 2008, 155, 135–143.
[28] Vepsalainen M, Ghiasvand M, Selin J, Pienimaa J, Repo E, Pulliainen M, Sillanpaa M. Separation and