R E S E A R C H A R T I C L E
Open Access
A nonparametric multiple imputation
approach for missing categorical data
Muhan Zhou
1, Yulei He
2, Mandi Yu
3and Chiu-Hsieh Hsu
1*Abstract
Background: Incomplete categorical variables with more than two categories are common in public health data. However, most of the existing missing-data methods do not use the information from nonresponse (missingness) probabilities.
Methods: We propose a nearest-neighbour multiple imputation approach to impute a missing at random categorical outcome and to estimate the proportion of each category. The donor set for imputation is formed by measuring distances between each missing value with other non-missing values. The distance function is calculated based on a predictive score, which is derived from two working models: one fits a multinomial logistic regression for predicting the missing categorical outcome (the outcome model) and the other fits a logistic regression for predicting missingness probabilities (the missingness model). A weighting scheme is used to accommodate contributions from two working models when generating the predictive score. A missing value is imputed by randomly selecting one of the non-missing values with the smallest distances. We conduct a simulation to evaluate the performance of the proposed method and compare it with several alternative methods. A real-data application is also presented. Results: The simulation study suggests that the proposed method performs well when missingness probabilities are not extreme under some misspecifications of the working models. However, the calibration estimator, which is also based on two working models, can be highly unstable when missingness probabilities for some observations are extremely high. In this scenario, the proposed method produces more stable and better estimates. In addition, proper weights need to be chosen to balance the contributions from the two working models and achieve optimal results for the proposed method.
Conclusions: We conclude that the proposed multiple imputation method is a reasonable approach to dealing with missing categorical outcome data with more than two levels for assessing the distribution of the outcome. In terms of the choices for the working models, we suggest a multinomial logistic regression for predicting the missing outcome and a binary logistic regression for predicting the missingness probability.
Keywords: Categorical data, Double robustness, Missing at Random, Multiple imputation, Nearest neighbour
Background
In population studies of public health, the health status of participants is a research outcome of interest and is commonly demonstrated using ordinal categories such as “Excellent”, “Good”, “Fair”, and “Poor”. However, these variables are typically subject to missing data. In prac-tical analyses, researchers often create a specific new
*Correspondence: [email protected]
1Department of Epidemiology and Biostatistics, Mel and Enid Zuckerman College of Public Health, University of Arizona, 1295 N. Martin Ave., 85724 Tucson, USA
Full list of author information is available at the end of the article
category for missing values (i.e., the missingness indica-tor approach) or use complete-case (CC) analysis, which excludes all missing observations. When missing values are missing at random (MAR), except for CC used to estimate regression coefficients, both methods are likely to induce substantial bias as well as lack of efficiency, e.g. to estimate the proportion of each category of the multinomial outcome variable, and therefore are not rec-ommended in general [5, 9, 10].
The expectation-maximization (EM) algorithm uses the maximum likelihood approach to handle missing data
problems. It consists of iterative expectation and maxi-mization steps for estimating the parameter [4]. However, this approach only relies on the information from a work-ing model predictwork-ing the misswork-ing values/outcome, and ignores the information embedded in missingness prob-abilities, that is, the probabilities of being missing (or nonresponse probabilities). Therefore the corresponding estimates might not be robust to certain misspecifications of the outcome model.
A more robust approach is to improve the estimation using additional information from the missingness prob-abilities, such as the use of calibration estimator (CE) [2], which is an extension of the inverse probability weight-ing method [7]. The estimator is a result of expressweight-ing the target parameter as a sum of two components, the model-based predictions and inverse probability-weighted pre-diction errors. These two components have a trade-off effect so that using their sum can achieve a doubly robust property. That is, the estimator remain consistent as long as one of the prediction models is correctly specified. In addition, CE uses covariates to fit working models for predicting missing values and missingness probabil-ities. Additional details about CE can be found in the “Methods” section.
Multiple imputation (MI) [13] is an attractive approach to missing data problems. It accounts for uncertainty in estimation due to missingness by imputing each missing observation multiple times [13, 15]. To the best of our knowledge, only a handful of studies have investigated the possible MI approaches to missing categorical data, such as MI using a loglinear model, MI using a latent class model, and MI using chained equations, [16, 20], and concluded that MI using a latent variable model had the best performance among the tested methods. How-ever, we note that all these methods are only built on the working model predicting the missing values. An appar-ent disadvantage is that they might be sensitive to certain misspecifications of the working model.
To weaken the aforementioned, pure reliance on the working model for predicting the missing outcome, we propose a nearest neighbor-based MI (NNMI) approach to missing categorical data. The approach uses two work-ing models, one for predictwork-ing misswork-ing outcome values (the outcome model) and the other for predicting the missingness probabilities using covariate information (the missingness model). Each working model is used to gen-erate a predictive score. Their weighted sum is used to measure the “distance” between a missing case and observed cases. For each missing observation, its imput-ing set consists of observed cases which are “near” in terms of the distance function. The missing value can thus be imputed (replaced) by one of the donors in its imput-ing set. Because information from both the outcome and missingness models are used to impute the missing data,
we surmise that the proposed method might possess some doubly-robust property.
Similar ideas have been proposed in [11] and [8]. In those contexts, the NNMI approach is applied to impute missing at random continuous variables and produces rea-sonable results under a variety of model misspecifications. However, a notable difference in our paper is that the NNMI approach is applied to MAR categorical variables. More specifically, if the number of categories isM,M−1 predictive scores can then be derived from the working model for the outcome, and a single predictive score can be derived from the working model for the missingness probabilities. It is of interest to investigate the optimal weighting schemes for the Mpredictive scores. We also note that there exist alternative ways of specifying models for categorical outcomes, which further complicates the problem. In addition, despite having a theoretical doubly robust property, CE might produce unstable results when missingness probabilities take some extreme values. It is of additional interest to assess the performance of NNMI in this scenario.
This article is organized as follows. In the “Methods” section, we specify notations, briefly introduce the CE method, and present the NNMI approach. In the “Simulation study” section, we investigate the properties of NNMI for finite samples. In the “Data example” section, we analyze a dataset from 2013 Behavioral Risk Factor Surveillance System (BRFSS) survey. Finally, we conclude our study with a discussion and suggest directions for future work.
Methods Notation
LetY denote the categorical outcome variable of interest with missing values, and suppose thatYhasMcategories of which the proportions need to be estimated. Let δ denote the missingness indicator,δ = 0 ifY is missing andδ = 1 ifY is observed. LetX = (X1,. . .,Xp)denote
a set of fully observed covariates that are predictive ofY
andδ. Suppose that there arenindependent subjects in the study.
Calibration estimator
The calibration estimator is the earliest doubly robust method [2], which is based on two working models: one for the variable with missing valuesY, and the other for the missingness indicatorδ. For example, one can calcu-late the estimates of mean for a continuousY by a sum of prediction and inverse probability-weighted prediction errors,
μ=E[E(Y|X)]+E
δY−π(E(Y|X)) X)
,
For a categorical Y taking values m = 1,. . .,M, the estimator of probability thatY=mcan be written as
ˆ
PCE,Y=m=n−1 n
i=1
ˆ
Pi,Y=m+n−1 n
i=1
δiwi
Ii,Y=m− ˆPi,Y=m
,
where Pˆi,Y=m is the predicted probability of Y = m based on, for example, a multinomial logistic regression model forE(Y|X)using complete cases,wi = 1/π(ˆ Xi)is the inverse of the estimated probabilities of having case
ibeing observed (computed using, for example, a logis-tic regression model fromE(δ|X)), and I represents the indicator function ofY = m. The first term essentially predicts/imputesYvalues using a model forE(Y|X)based on complete cases. The second term is a sum of predic-tion errors from the model forE(Y|X), adjusted by the inverse-probability weights usingπ(ˆ X)based on all cases. The doubly robust property dictates that the estimates for the probability of each category ofY would be consistent if at least one of the two models (E(Y|X) andE(δ|X)) is correctly specified.
Nearest-neighbour multiple imputation
We first present the outcome model for Y. Given its categorical-feature, we consider two alternative modeling specifications as follows.
Specification I: In this generalized logit model (or multi-nomial logit model), without loss of generality, letY =1 be the reference category. We model the ratio of each other category forY =2,. . .,M,Pr(Y =m)/Pr(Y = 1), (m = 2,. . .,M), via the log link function and relate it to covariateX. That is,
logPr(Y =m) Pr(Y=1) =α
T
MLR,mXO, (m=2,. . .,M)
where XO ⊆ X is a set of covariates predicting Y, and αMLR,m = (αMLR,m1,. . .,αMLR,mp)T is a vector of
p regression coefficients for Y = m versus Y = 1. Correspondingly, let
ZMLR,m=lm
XO,αMLR,1,. . .,αMLR,M−1
= exp
αT MLR,mXO
1+exp
αT MLR,1XO
+. . .+exp
αT
MLR,M−1XO
be the predictive score of Pr(Y = m)/Pr(Y = 1) under this generalized logit model. Therefore, there are
M−1 predictive scoresZMLR,mgenerated forY withM categories, and the m-th score quantifies the “distance” between categorymand category 1.
Specification II: An alternative approach is to fitM−
1 cumulative logistic regression models. That is, models comparingY ∈(m+1,. . .,M)versusY ∈(1,. . .,m)for
m=1,. . .,M−1. This model can be written as
logPr(Y ∈(m+1,. . .,M)) Pr(Y ∈(1,. . .,m)) =α
T CLR,mXO,
whereαCLR,m = (αCLR,m1,. . .,αCLR,mp)T is a vector ofp
regression coefficients forY∈(m+1,. . .,M)versusY ∈ (1,. . .,m). Under this model, each of theM−1 predictive scores is generated as
ZCLR,m=lmXO,αCLR,m
= exp
αT CLR,mXO
1+exp
αT CLR,mXO
.
Unlike specification I, there is no apparent constraint amonglog(Pr(Y ∈ (m+1,. . .,M))/Pr(Y ∈ (1,. . .,m)))
form = 1,. . .,M−1. Therefore, them-th scoreZCLR,m quantifies the “distance” between the consecutive cate-goriesY ∈(m+1,. . .,M)andY∈(1,. . .,m).
Second, we present the model for missingness probabil-ities. It is common to use a logistic regression model for the missingness indicatorδ. That is,
logit(Pr(δ=1))=Xδβ,
where Xδ ⊆ Xis a set of covariates predicting δ and β = (β1,. . .,βp)T is a vector of regression coefficients.
The corresponding predictive score is
ZM=lM(Xδ,β)
= exp
βTX δ
1+expβTXδ
.
The aforementioned specifications do not encompass all possible modeling choices forY andδ. For instance, the logit link functions can be replaced by probit or other link functions. In general, appropriate specifications should follow careful exploratory analysis and model diagnostics of the real data. Here we only use these specifications for illustrative purposes.
The general strategy of NNMI works as follows. The aforementioned predictive scores ({ZMLR,m}or{ZCLR,Rm}
work-ing models. This (weighted) predictive score is then used to quantify the “distance” between subjects. The scores from cases with observed Y are used to form imput-ing sets for subjects with missimput-ingY. For each incomplete subject, imputations are randomly drawn from subjects (in the imputing set) that have smaller “distances” to the subject with a missing Y. To ensure the “properness” of multiple imputation [13], the estimation of scores and formation of imputing sets are conducted on bootstrap samples of the original data set to incorporate parameter uncertainty.
More specifically, the procedure consists of the follow-ing steps:
Step 1: Bootstrap – Bootstrap the original data set (including the missing observations){Y,X}to obtain the bootstrap sample{Y∗,X∗}.
Step 2: Calculating the predictive scores – From the bootstrap sample we estimate the regression coefficients for the outcome and missingness models using the max-imum likelihood method. For illustration suppose we use specification I for the outcome model and denote the corresponding regression coefficients as α∗MLR,m,m =
1,. . .M−1. Letβ∗be the regression coefficients for the propensity model. We use these regression coefficients and the original covariateXto form the scores. For exam-ple, theM−1 predictive scores for the outcome model (under specification I) are
ZMLR∗ ,m=lmXO,α∗MLR,1,. . .,αMLR∗ ,M−1
= exp
α∗T MLR,mXO
1+exp
α∗T MLR,1XO
+. . .+exp
α∗T
MLR,M−1XO
, (m=1,. . .,M−1).
The predictive score for the propensity model is
ZM∗ =lMXδ,β∗ =exp
β∗TX
δ
/1+exp
β∗TX
δ
.
Each of theMpredictive scores{Z∗MLR,1,. . .,ZMLR∗ ,M−1,
ZM∗} is standardized by subtracting its mean and divid-ing by its standard deviation. The resultdivid-ing standardized scores are denoted byS≡(S1,. . .,SM).
Step 3: Forming the imputing set – We calculate a dis-tance function to define the similarity between subject
i with missing Y in the original data set and subject j
with observed Y in the bootstrap sample based on the
Mpredictive scores,S1,. . .,SM. Specifically, the distance between subjectsiandjis defined as
d(i,j)= ω1
S1(i)−S1(j)
2+. . .+ωM
SM(i)−SM(j)
2
,
where ω1,. . .,ωM are non-negative weights for the
pre-dictive scores, satisfyingMi=1ωm=1. The way to calculate the similarity between subject i with missing Y in the original data and subjectjwith observedY in the boot-strap sample was initiated from predictive mean matching and was described by Heitjan and Little [6], which was an extension of a method by Rubin [14]. Morris and his colleagues also studied on this nonparametric MI method compared with other methods [12]. The imput-ing set for subject i with a missing Y in the original data is the NN nearest neighborhood (i.e., the number of donors, a positive integer specified prior to impu-tation), R(i,NN,ω1,. . .;ωM), consisting of NN subjects with observedY in the bootstrap sample and having the smallestNNdistancesd(i,j).
Step 4: Imputation – From the imputing set R(i,NN, ω1,. . .;ωM), an observation is randomly drawn (with
equal probability) to replace the missing Y in subjecti. This imputation is conducted for alli’s. Once all missing observations ofY are imputed, one fully imputed data set is obtained. Return to Step 1.
Step 5: Analyzing multiply imputed data sets – Steps 1 to 4 are independently repeated K time to obtain K
imputed data sets for estimation. For each imputed data set, an estimate of the probability ofY = mis calculated byPˆYˆ=m= nm/n,m =(1,. . .,M), wherenmis the num-ber ofYˆ = mobserved in the imputed data set andnis the sample size. DenotePˆYˆ=m(k)as the estimate for thek -th imputed data set. Using Rubin’s combining rules [10], the final NNMI estimator is the average acrossKimputed data sets asP¯Yˆ=m = (1/K)Kk=1PˆYˆ=m(k). Its variance can be estimated using the sum of a between-imputation and within-imputation component as
SEP¯Yˆ=m=
1 K k s2 ˆ
Y=m(k)+
1+1
K
1
K−1
k
PYˆ=m(k)− ¯PYˆ=m2,
where sYˆ=m(k) is the standard error for the probability of Yˆ = m in the k-th data set based on a Bernoulli distribution for the eventI(Yˆ =m).
We use R to perform all the simulations and data analysis. Multinomial logistic regression models can be done using the multinom function from the nnet package of R. [17].
Results
Simulation study
presents a simulation study for assessing the perfor-mance of the NNMI under some model misspecifications for imputing a three-category nomial missing outcome and evaluating the estimation of proportions of all three categories.
For simplicity, we consider an incomplete trichoto-mous outcome Y (i.e. M=3). The estimand of evalua-tion is the probability P(Y = m), m = 1, 2, 3. The methods compared include: fully observed (FO) analy-sis, which is treated as the gold standard because the analysis is applied before some of the Ys are removed; complete-case (CC) analysis, which excludes cases with missing Y; the calibration estimator (CE); a parametric MI (PMI), which imputes the missing values by taking the predictive values from a multinomial logistic regres-sion model for the missing values; and the proposed NNMI approach. For the latter approach, the method using multinomial logistic regressions for the outcome model is denoted as NNMIMLR(NN,ω1,. . .;ωM), and that using cumulative logistic regressions is denoted as
NNMICLR(NN,ω1,. . .;ωM). The previous work on NNMI [8, 11] has demonstrated that bias increases while SD and SE decreases when NN increased. It is suggested that NN= 3 or 5 in general result in slightly lower MSEs. In the simulation,NN = 5 is chosen for NNMI. Based on our previous experience, ten-time MI is usually sufficient to control for the uncertainty. In this article, we compared one table using K=10 and K=50 (Table 1 and Additional file 1: Table S12). The results shows no clear difference in bias and slightly lower SD and SE using K=50.
Sample sizen=400 andn=200 are considered for simula-tion. For each tested scenario, the simulation is conducted 500 times. The criteria include the average estimate (EST), the empirical standard deviation (SD), the aver-age standard error (SE), and the coveraver-age rate (CR) of 95% confidence intervals (CI), all of which are calcu-lated from the 500 simulations. To assess the perfor-mance of the simulations, Monte Carlo Errors (MCEs) are calculated for each measure using the formulas from White’s paper [19]. In FO and CC, the SEs are calculated assuming a Bernoulli distribution for Yˆ = m. In CE, the SE’s are calculated using bootstrap. In PMI and NNMI, Rubin’s combining rules are used to calculate SE’s.
Five observed covariates X = (X1,. . .,X5) are
inde-pendently generated from U(−1, 1). The trichotomous outcome,Y, is generated from a multinomial distribution with probabilities asPr(Y =1|X)=g−1(X1−X2+2X3−
2X4+ 5X5),Pr(Y = 2|X) = g−1(2X1 −2X2 +3X3−
3X4+1.5X5)andPr(Y = 3|X)=1−Pr(Y =1|X)−Pr
(Y = 2|X), whereg is a link function. We consider both the logit and probit link functions forg.
We assume that Y is independent of δ givenX. That is, the missingness probability of Y is only dependent
on X (i.e., MAR). Two models are considered for the missingness indicator: Pr(δ = 1|X) = g−1(0.5X1 −
X2+X3−X4+X5) (denoted M1); andPr(δ = 1|X) =
g−1(0.5X1+2X2−4X3−2X4+2X5)(denoted M2). Again,
we consider both the logit and probit link functions forg. In general, Model M1 generates missingness probabilities that are mostly bounded away from 1 or 0 with a bell-shape distribution, whereas Model M2 generates more missingness probabilities that are close to 1 or 0 with a U-shape distribution. That is, the missingness probabilities generated from model M2 are more extreme than those from model M1. In both schemes, the overall missingness probability is approximately 50%.
The primary goal of the simulation is to assess the per-formance of the NNMI various misspecifications of the working models for Y and δ. In general, two types of model misspecification for working models are tested: 1) including a reduced set of predictors (i.e.,X1,X2, andX3)
for working models; and 2) misspecified link functions for working models. More specifically, we consider the following five scenarios:
Scenario 1 Misspecified working model forY only: including only 3 predictors and using a correct link function
Scenario 2 Misspecified working model forδonly: including only 3 predictors and using a correct link function
Scenario 3 Misspecified working model forY only: using an incorrect link function and including all 5 predictors
Scenario 4 Misspecified working model forδonly: using an incorrect link function and including all 5 predictors
Scenario 5 Misspecified working models for bothY andδ: using incorrect link functions for both and including all 5 predictors
For example, we firstly simulateYusingX1−X5through
logit link and simulateδusingX1−X5through logit link.
The misspecification Scenario 1 fit a working model forY
with same logit link function but usingX1,X2andX3only,
and fit a working model forδ using same five covariates,
X1−X5, and same logit link function.
We also assess the effects of the extremeness of miss-ingness probabilities on the performance of the meth-ods. This is motivated by the fact that CE, despite being theoretically consistent if one of the working mod-els is correctly specified, might have unstable results when the propensity model generates extreme missing-ness probabilities.
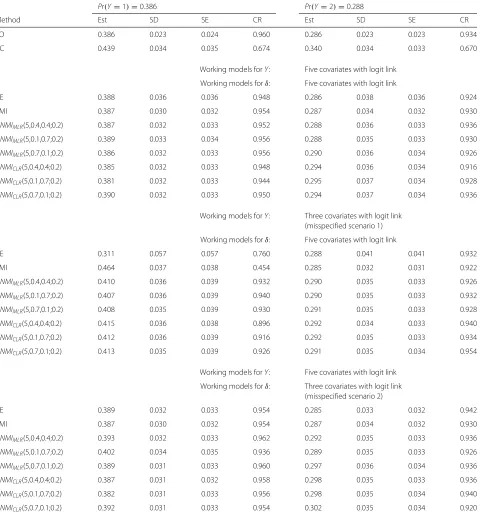
Table 1Simulation results from probability estimation forY, whereYis generated using a logit link function with five covariates,δis generated using a logit link function with not extreme missingness probabilities (M1) based on five covariates, N = 400
Pr(Y=1)=0.386 Pr(Y=2)=0.288
Method Est SD SE CR Est SD SE CR
FO 0.386 0.023 0.024 0.960 0.286 0.023 0.023 0.934
CC 0.439 0.034 0.035 0.674 0.340 0.034 0.033 0.670
Working models forY: Five covariates with logit link
Working models forδ: Five covariates with logit link
CE 0.388 0.036 0.036 0.948 0.286 0.038 0.036 0.924
PMI 0.387 0.030 0.032 0.954 0.287 0.034 0.032 0.930
NNMIMLR(5,0.4,0.4;0.2) 0.387 0.032 0.033 0.952 0.288 0.036 0.033 0.936
NNMIMLR(5,0.1,0.7;0.2) 0.389 0.033 0.034 0.956 0.288 0.035 0.033 0.930
NNMIMLR(5,0.7,0.1;0.2) 0.386 0.032 0.033 0.956 0.290 0.036 0.034 0.926
NNMICLR(5,0.4,0.4;0.2) 0.385 0.032 0.033 0.948 0.294 0.036 0.034 0.916
NNMICLR(5,0.1,0.7;0.2) 0.381 0.032 0.033 0.944 0.295 0.037 0.034 0.928
NNMICLR(5,0.7,0.1;0.2) 0.390 0.032 0.033 0.950 0.294 0.037 0.034 0.936
Working models forY: Three covariates with logit link (misspecified scenario 1)
Working models forδ: Five covariates with logit link
CE 0.311 0.057 0.057 0.760 0.288 0.041 0.041 0.932
PMI 0.464 0.037 0.038 0.454 0.285 0.032 0.031 0.922
NNMIMLR(5,0.4,0.4;0.2) 0.410 0.036 0.039 0.932 0.290 0.035 0.033 0.926
NNMIMLR(5,0.1,0.7;0.2) 0.407 0.036 0.039 0.940 0.290 0.035 0.033 0.932
NNMIMLR(5,0.7,0.1;0.2) 0.408 0.035 0.039 0.930 0.291 0.035 0.033 0.928
NNMICLR(5,0.4,0.4;0.2) 0.415 0.036 0.038 0.896 0.292 0.034 0.033 0.940
NNMICLR(5,0.1,0.7;0.2) 0.412 0.036 0.039 0.916 0.292 0.035 0.033 0.934
NNMICLR(5,0.7,0.1;0.2) 0.413 0.035 0.039 0.926 0.291 0.035 0.034 0.954
Working models forY: Five covariates with logit link
Working models forδ: Three covariates with logit link (misspecified scenario 2)
CE 0.389 0.032 0.033 0.954 0.285 0.033 0.032 0.942
PMI 0.387 0.030 0.032 0.954 0.287 0.034 0.032 0.930
NNMIMLR(5,0.4,0.4;0.2) 0.393 0.032 0.033 0.962 0.292 0.035 0.033 0.936
NNMIMLR(5,0.1,0.7;0.2) 0.402 0.034 0.035 0.936 0.289 0.035 0.033 0.926
NNMIMLR(5,0.7,0.1;0.2) 0.389 0.031 0.033 0.960 0.297 0.036 0.034 0.936
NNMICLR(5,0.4,0.4;0.2) 0.387 0.031 0.032 0.958 0.298 0.035 0.033 0.936
NNMICLR(5,0.1,0.7;0.2) 0.382 0.031 0.033 0.956 0.298 0.035 0.034 0.940
NNMICLR(5,0.7,0.1;0.2) 0.392 0.031 0.033 0.954 0.302 0.035 0.034 0.920
Est: Estimates of probabilities; SD: Empirical standard deviation; SE: Estimate of standard error; CR: Coverage rate of 95% confidence intervals; FO: fully observed; CC: Complete Cases; CE: Calibration estimator; PMI: Parametric Multiple Imputation;NNMIMLR(NN,ω1,ω2;ω3): the NNMI method using Multinomial Logistic Regressions, NN is the number of nearest neighbors and weights areω1,ω2, andω3;NNMICLR: the NNMI method using Cumulative Logistic Regressions;K= 10 imputed datasets are used for PMI and NNMI methods
weight is often necessary for the score from the miss-ingness probability model if Y is continuous. Because
M= 3 here in our setting, we consider several combina-tions for(ω1,ω2;ω3)because these weights might reflect
consistent with conclusions from [8, 11]. In addition, pos-itive weight(s) for the scores from the working model(s) for predicting missing values (ω1 andω2) are necessary
when only the working model for the missingness proba-bility is misspecified. Therefore, the following simulation results present the results from fixingω3=0.2 and
differ-ent combinations forω1andω2: (0.4,0.4;0.2), (0.7,0.1;0.2),
and (0.1,0.7;0.2).
For brevity, we only present and illustrate the results fromn = 400. With smaller sample size of 200 observa-tions (See Additional file 1), SEs from all methods slightly increase as expected, and the major comparative pattern does not vary dramatically. Most of the MCEs are less than 5%.
Table 1 summarizes the results when logit link functions are used to generateY andδ. In addition, the missing-ness probabilities are generated by Model M1 and do not have many extreme values. As expected, CC estimates have substantial biases and the coverage rates are low. When the working models forY andδare both correctly specified, the bias is negligible for CE. PMI yields a good performance as well.NNMIMLR produces slightly larger biases yet smaller SD compared with CE.NNMICLR pro-duce slightly worse yet comparable results. When only the working model for Y is misspecified with 3 covariates, both NNMI methods are superior to other methods in term of bias and coverage rate, apparently for estimating
Pr(Y = 1). In this case, CE estimates have much larger biases and variations, as well as low CRs. PMI breaks down dramatically due to its sole reliance on the working model predictingY. The methods are more or less similar for estimatingPr(Y = 2). When only the working model forδis misspecified with 3 covariates, CE performs well. Both NNMI produce mostly comparable results with CE.
Table 2 presents the results when logit link functions are used to generate Y andδ. Here more extreme missing-ness probabilities are generated by Model M2. Compared with Table 1, the performances of estimators degrade in general due to the fact that these extreme missingness probabilities are more difficult to estimate and thus ren-der more instability to the estimates. When both working models are correctly specified, CE produces little bias yet extremely large SD and SE. Both NNMI methods have small biases which lead to lower-than-nominal CRs. How-ever, their variations (SD) and the estimates (SE) are much smaller and more reasonable compared with CE. Between the two approaches, NNMICLR is somewhat inferior to NNMIMLR. When only the working model forY is mis-specified with 3 covariates, CE estimates become largely biased for estimatingPr(Y = 1). In this case, however, both NNMI methods produce smaller biases and much lower SDs and SEs. When only the working model forδ is misspecified with 3 covariates, interestingly CE works better than NNMI methods. We surmise this is due to
the fact that, although misspecified, the working propen-sity model for CE avoids most of the extreme missingness probabilities. In other words, a correctly specified working propensity model might do more harm (i.e., brings more variation to the estimates) to CE compared with NNMI if the missingness probabilities are more extreme.
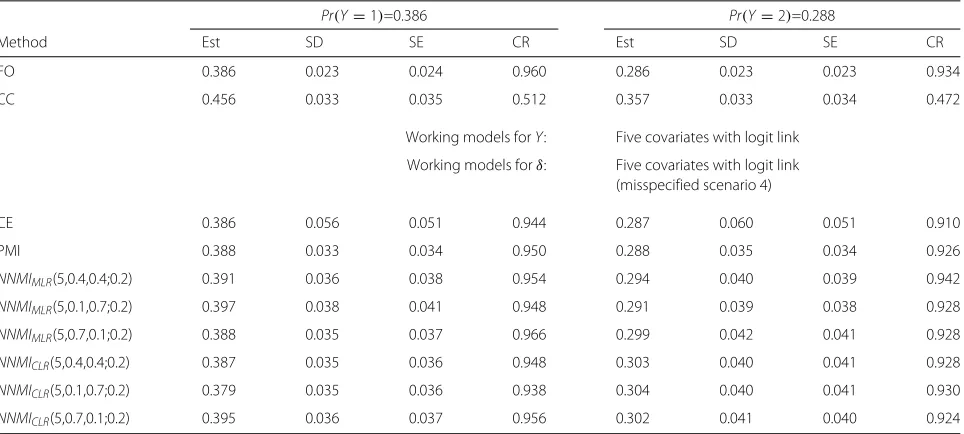
Tables 3, 4 and 5 include results when the working mod-els use misspecified link functions, when the missingness probabilities are not extreme. In Table 3, a probit link function is used to generateY and a logit link is used to generateδ. When the link function for the working out-come model is misspecified as a logit function, NNMI performs slightly better than CE and PMI (more appar-ently for estimating Pr(Y = 2)with smaller biases and SDs. In Table 4, a logit link function is used to generate
Y and a probit link function is used to generateδ. When the link function for the working propensity model is mis-specified as a probit function, NNMI methods produce slightly larger biases than CE and PMI, yet with smaller SDs and SEs, compared with CE and PMI. In Table 5, pro-bit link functions are used to generate bothYandδ. When both working models employ logit link functions, CE pro-duces good CRs yet relatively large SDs and SEs. PMI degrades with larger biases and low CRs, more apparently for estimatingPr(Y = 2). NNMI produces more robust results with smaller biases, lower SDs and SEs, and good CRs. For data with more extreme missingness probabili-ties (See Additional file 1), the comparative pattern remain similar but all methods perform worse.
In summary, the NNMI strategy can well accommodate misspecified working models when missingness probabil-ities are not extreme. PMI can break down if its working outcome model is misspecified. When missingness prob-abilities for some observations are extreme, CE estimates tend to have considerably higher SDs and SEs, while those from NNMI tend to be more stable. Between the two NNMI strategies, NNMI using multinomial logis-tic/probit regression models performs better than NNMI using cumulative logistic/probit regressions. This might be due to the fact that the data-generating models forYin the simulation follow the multinomial regression scheme. In addition, there exists no apparent effect of specifying different weights forω1andω2, as long asω3>0.
Data example
Table 2Simulation results from probability estimation forY, whereYis generated using a logit link function with five covariates,δis generated using a logit link function with extreme missingness probabilities (M2) based on five covariates, N = 400
Pr(Y=1)=0.386 Pr(Y=2)=0.288
Method Est SD SE CR Est SD SE CR
FO 0.386 0.023 0.024 0.960 0.286 0.023 0.023 0.934
CC 0.425 0.031 0.033 0.802 0.374 0.033 0.033 0.250
Working models forY: Five covariates with logit link
Working models forδ: Five covariates with logit link
CE 0.378 0.102 0.080 0.946 0.288 0.108 0.076 0.902
PMI 0.385 0.034 0.036 0.950 0.288 0.036 0.033 0.922
NNMIMLR(5,0.4,0.4;0.2) 0.389 0.039 0.040 0.946 0.297 0.043 0.040 0.906
NNMIMLR(5,0.1,0.7;0.2) 0.399 0.042 0.045 0.942 0.292 0.041 0.039 0.918
NNMIMLR(5,0.7,0.1;0.2) 0.385 0.038 0.039 0.936 0.302 0.044 0.042 0.916
NNMICLR(5,0.4,0.4;0.2) 0.384 0.037 0.038 0.938 0.304 0.042 0.040 0.918
NNMICLR(5,0.1,0.7;0.2) 0.372 0.038 0.039 0.926 0.307 0.043 0.042 0.918
NNMICLR(5,0.7,0.1;0.2) 0.395 0.038 0.039 0.944 0.305 0.043 0.041 0.908
Working models forY: Three covariates with logit link (misspecified scenario 1)
Working models forδ: Five covariates with logit link
CE 0.302 0.234 0.184 0.946 0.287 0.117 0.084 0.910
PMI 0.495 0.039 0.042 0.258 0.288 0.032 0.031 0.932
NNMIMLR(5,0.4,0.4;0.2) 0.436 0.051 0.053 0.852 0.295 0.042 0.040 0.914
NNMIMLR(5,0.1,0.7;0.2) 0.431 0.052 0.054 0.878 0.293 0.041 0.040 0.932
NNMIMLR(5,0.7,0.1;0.2) 0.433 0.050 0.053 0.858 0.296 0.042 0.041 0.924
NNMICLR(5,0.4,0.4;0.2) 0.440 0.047 0.049 0.806 0.297 0.040 0.039 0.924
NNMICLR(5,0.1,0.7;0.2) 0.429 0.046 0.048 0.852 0.299 0.042 0.039 0.926
NNMICLR(5,0.7,0.1;0.2) 0.441 0.050 0.051 0.806 0.297 0.041 0.040 0.920
Working models forY: Five covariates with logit link
Working models forδ: Three covariates with logit link (misspecified scenario 2)
CE 0.386 0.050 0.048 0.960 0.286 0.043 0.040 0.894
PMI 0.385 0.034 0.036 0.950 0.288 0.036 0.033 0.922
NNMIMLR(5,0.4,0.4;0.2) 0.398 0.038 0.040 0.952 0.301 0.041 0.039 0.906
NNMIMLR(5,0.1,0.7;0.2) 0.426 0.042 0.045 0.858 0.294 0.039 0.037 0.922
NNMIMLR(5,0.7,0.1;0.2) 0.392 0.037 0.038 0.942 0.312 0.043 0.040 0.882
NNMICLR(5,0.4,0.4;0.2) 0.390 0.035 0.038 0.954 0.307 0.040 0.039 0.912
NNMICLR(5,0.1,0.7;0.2) 0.377 0.037 0.039 0.940 0.307 0.041 0.040 0.924
NNMICLR(5,0.7,0.1;0.2) 0.401 0.036 0.037 0.938 0.313 0.041 0.039 0.912
Est: Estimates of probabilities; SD: Empirical standard deviation; SE: Estimate of standard error; CR: Coverage rate of 95% confidence intervals; FO: fully observed; CC: Complete Cases; CE: Calibration estimator; PMI: Parametric Multiple Imputation;NNMIMLR(NN,ω1,ω2;ω3): the NNMI method using Multinomial Logistic Regressions, NN is the number of nearest neighbors and weights areω1,ω2, andω3;NNMICLR: the NNMI method using Cumulative Logistic Regressions;K= 10 imputed datasets are used for PMI and NNMI methods
population who were unable to work and had annual household income less than 15000 dollars. From the public-use BRFSS data system, a subset of 1430 partici-pants are selected with fully-observed data of potentially
Table 3Simulation results from probability estimation forY, whereYis generated using a probit link function with five covariates,δis generated using a logit link function with not extreme missingness probabilities (M1) based on five covariates, N = 400
Pr(Y=1)=0.297 Pr(Y=2)=0.250
Method Est SD SE CR Est SD SE CR
FO 0.298 0.023 0.023 0.952 0.249 0.021 0.022 0.974
CC 0.322 0.032 0.033 0.910 0.303 0.033 0.032 0.606
Working models forY: Five covariates with logit link (misspecified scenario 3)
Working models forδ: Five covariates with logit link
CE 0.291 0.036 0.037 0.954 0.230 0.031 0.032 0.900
PMI 0.307 0.033 0.033 0.942 0.271 0.034 0.033 0.902
NNMIMLR(5,0.4,0.4;0.2) 0.301 0.033 0.033 0.940 0.260 0.031 0.032 0.942
NNMIMLR(5,0.1,0.7;0.2) 0.302 0.034 0.034 0.946 0.259 0.032 0.032 0.936
NNMIMLR(5,0.7,0.1;0.2) 0.301 0.032 0.033 0.944 0.260 0.033 0.032 0.930
NNMICLR(5,0.4,0.4;0.2) 0.299 0.033 0.033 0.936 0.263 0.032 0.033 0.936
NNMICLR(5,0.1,0.7;0.2) 0.297 0.033 0.033 0.930 0.263 0.033 0.033 0.926
NNMICLR(5,0.7,0.1;0.2) 0.302 0.032 0.034 0.948 0.261 0.032 0.032 0.942
Est: Estimates of probabilities; SD: Empirical standard deviation; SE: Estimate of standard error; CR: Coverage rate of 95% confidence intervals; FO: fully observed; CC: Complete Cases; CE: Calibration estimator; PMI: Parametric Multiple Imputation;NNMIMLR(NN,ω1,ω2;ω3): the NNMI method using Multinomial Logistic Regressions, NN is the number of nearest neighbors and weights areω1,ω2, andω3;NNMICLR: the NNMI method using Cumulative Logistic Regressions;K= 10 imputed datasets are used for PMI and NNMI methods
we considered to treat those participants who answered “Don’t know/not sure”, “Not applicable”, “Refused”, and those not asked or missing as missing data (δ=0, n =
363). In reality those who answered “Don’t know/not sure”, “Not applicable”, “Refused” are not necessary to
be missing. In this example, the overall missingness rate is 25.4%.
We conduct some exploratory analyses to select predic-tors for this outcome and the missingness indicator (δ) using a multinomial logistic regression model and binary
Table 4Simulation results from probability estimation forY, whereYis generated using a logit link function with five covariates,δis generated using a probit link function with not extreme missingness probabilities (M1) based on five covariates, N = 400
Pr(Y=1)=0.386 Pr(Y=2)=0.288
Method Est SD SE CR Est SD SE CR
FO 0.386 0.023 0.024 0.960 0.286 0.023 0.023 0.934
CC 0.456 0.033 0.035 0.512 0.357 0.033 0.034 0.472
Working models forY: Five covariates with logit link
Working models forδ: Five covariates with logit link (misspecified scenario 4)
CE 0.386 0.056 0.051 0.944 0.287 0.060 0.051 0.910
PMI 0.388 0.033 0.034 0.950 0.288 0.035 0.034 0.926
NNMIMLR(5,0.4,0.4;0.2) 0.391 0.036 0.038 0.954 0.294 0.040 0.039 0.942
NNMIMLR(5,0.1,0.7;0.2) 0.397 0.038 0.041 0.948 0.291 0.039 0.038 0.928
NNMIMLR(5,0.7,0.1;0.2) 0.388 0.035 0.037 0.966 0.299 0.042 0.041 0.928
NNMICLR(5,0.4,0.4;0.2) 0.387 0.035 0.036 0.948 0.303 0.040 0.041 0.928
NNMICLR(5,0.1,0.7;0.2) 0.379 0.035 0.036 0.938 0.304 0.040 0.041 0.930
NNMICLR(5,0.7,0.1;0.2) 0.395 0.036 0.037 0.956 0.302 0.041 0.040 0.924
Table 5Simulation results from probability estimation forY, whereYis generated using a probit link function with five covariates,δis generated using a probit link function with not extreme missingness probabilities (M1) based on five covariates, N = 400
Pr(Y=1)=0.297 Pr(Y=2)=0.250
Method Est SD SE CR Est SD SE CR
FO 0.298 0.023 0.023 0.952 0.249 0.021 0.022 0.974
CC 0.328 0.032 0.033 0.862 0.323 0.033 0.033 0.406
Working models forY: Five covariates with logit link (misspecified scenario 5)
Working models forδ: Five covariates with logit link (misspecified scenario 5)
CE 0.295 0.068 0.058 0.956 0.218 0.049 0.051 0.926
PMI 0.316 0.038 0.038 0.912 0.294 0.038 0.038 0.800
NNMIMLR(5,0.4,0.4;0.2) 0.310 0.039 0.040 0.940 0.275 0.036 0.039 0.930
NNMIMLR(5,0.1,0.7;0.2) 0.314 0.041 0.041 0.934 0.274 0.037 0.038 0.924
NNMIMLR(5,0.7,0.1;0.2) 0.309 0.040 0.040 0.924 0.276 0.038 0.038 0.914
NNMICLR(5,0.4,0.4;0.2) 0.308 0.040 0.040 0.936 0.279 0.037 0.038 0.924
NNMICLR(5,0.1,0.7;0.2) 0.305 0.039 0.040 0.930 0.279 0.037 0.039 0.914
NNMICLR(5,0.7,0.1;0.2) 0.310 0.040 0.040 0.920 0.276 0.037 0.038 0.924
Est: Estimates of probabilities; SD: Empirical standard deviation; SE: Estimate of standard error; CR: Coverage rate of 95% confidence intervals; FO: fully observed; CC: Complete Cases; CE: Calibration estimator; PMI: Parametric Multiple Imputation;NNMIMLR(NN,ω1,ω2;ω3): the NNMI method using Multinomial Logistic Regressions, NN is the number of nearest neighbors and weights areω1,ω2, andω3;NNMICLR: the NNMI method using Cumulative Logistic Regressions;K= 10 imputed datasets are used for PMI and NNMI methods
logistic regression model, respectively. From these analy-ses, the satisfaction levels of health care received is shown to be significantly associated with gender, general health, education level, having health care coverage, and having delayed getting medical care. These five covariates are used to fit a multinomial logistic regression model for pre-dicting the satisfaction levels of health care. On the other hand, the missingness indicator is significantly associated with general health, education level, having health care coverage, and having delayed getting medical care. The four variables are included in a logistic regression model for predicting the missingness probability.
Table 6 shows the results by applying different missing data methods for estimating the marginal distribution of
Y. For simplicity, we only list the estimates for the cate-gory of “Very satisfied” and “Somewhat satisfied”. Com-pared with CC, the estimates of CE, PMI and NNMI all give lower probabilities for “Very satisfied” and higher probabilities for “Somewhat satisfied”. It is probable that participants who received excellent health care are more likely to respond to this question, and thus CC overesti-mates the probability for “Very satisfied” and underesti-mates those for the remaining groups. The estiunderesti-mates from CE, PMI, and NNMI are largely similar, and thus they provide some robustness check against potential model misspecifications.
Note that this simple example is merely used to illus-trate the proposed statistical methodology, and the results
should not be considered for subject-matter interests. More in-depth analyses targeted for the latter purpose should follow the guidelines provided in [3].
Discussion
In this article, we investigate a nearest-neighbour mul-tiple imputation procedure for missing categorical data. The method applies predictive working models to identify observed cases in the neighbors for each missing obser-vation. The use of information from two working models, one forY and one forδ, might result in a double robust-ness property, which induces consistent estimates even if one of the two working models is misspecified. We use two types of modeling strategies for Y with more than two categories, one multinomial logistic/probit regres-sion model and the other is based onm−1 cumulative logistic/probit regression models. The results show some but not significant differences between the two strate-gies, indicating the flexibility of NNMI in terms of the modeling choices. The simulation results also suggest that the proposed approach in general yield satisfactory per-formances. The setup of the weighted sum of predictive scores would facilitate some sensitivity analyses.
Table 62013 BRFSS Survey Data: Estimation for the probabilities of satisfaction with health care received for the Hispanic participants who were unable to work with annual household income less than 15000 dollars, N=1430 (overall missing rate=25.4%)
Pr(Y=Very Satisfied) Pr(Y=Somewhat Satisfied)
Method Est (SE) 95% CI Est (SE) 95% CI
CC 0.585 (0.015) (0.555, 0.614) 0.335 (0.014) (0.306, 0.363)
CE 0.553 (0.016) (0.521, 0.584) 0.349 (0.016) (0.319, 0.380)
PMI 0.552 (0.014) (0.524, 0.581) 0.345 (0.014) (0.318, 0.372)
NNMIMLR(5,0.4,0.4;0.2) 0.560 (0.019) (0.522, 0.598) 0.353 (0.020) (0.314, 0.392)
NNMIMLR(5,0.1,0.7;0.2) 0.556 (0.019) (0.519, 0.592) 0.351 (0.021) (0.310, 0.391)
NNMIMLR(5,0.7,0.1;0.2) 0.550 (0.022) (0.507, 0.594) 0.359 (0.019) (0.322, 0.396)
NNMICLR(5,0.4,0.4;0.2) 0.547 (0.021) (0.506, 0.588) 0.358 (0.017) (0.324, 0.392)
NNMICLR(5,0.1,0.7;0.2) 0.559 (0.016) (0.528, 0.590) 0.352 (0.016) (0.320, 0.383)
NNMICLR(5,0.7,0.1;0.2) 0.555 (0.018) (0.520, 0.590) 0.350 (0.019) (0.314, 0.387)
Est: Estimates of probabilities; SE: Estimate of standard error; 95%CI: 95% confidence interval
X: covariates as gender, general health, education level, having health care coverage, and having delayed getting medical care, that are used in working models CC: Complete Cases; CE: Calibration estimator; PMI: Parametric Multiple Imputation;NNMIMLR(NN,ω1,ω2;ω3): denotes the NNMI method using Multinomial Logistic Regressions, NN is the number of nearest neighbors and weights areω1,ω2, andω3;NNMICLR: the NNMI method using Cumulative Logistic Regressions;K= 10 imputed datasets are used for PMI and NNMI methods
working model for missingness probabilities. Therefore, it might be more important to seek good models for predict-ing misspredict-ingness probabilities for categoricalY, compared with continuousY.
The CE results can be unstable with high SEs when missingness rates are relatively high. This is because when the number of complete cases is small, the working model fitted forYmight not be accurate and so would negatively affect CE. In contrast, the NNMI estimates tend to be more robust, possibly due to less reliance on the working models for Y than CE and instead using the nearest-neighbour approach. In addition, CE performs badly with high SDs when the missingness probabilities were close to 0 or 1, while NNMI suffers less from this problem.
Furthermore, whether the working models, especially the one for the outcome, are correctly specified does not substantially impact NNMI if proper weights are speci-fied. However, CE is more sensitive to the specification of the working model for the categorical variable with missing values. Among all tested specifications, the sim-ulation results suggest that a multinomial logistic/probit regression for predicting missing values and a non-zero weight on the missingness probability predictive score, e.g.NNMIMLR(0.4, 0.4; 0.2), are preferred to impute cate-gorical data with three or more levels in the absence of prior knowledge on the working models.
This study does not compare results using differentNN
(number of donors). Further research can be conducted for selecting the optimal size of the nearest neighborhood. Another extension is to apply NNMI to impute missing continuous and categorical data simultaneously. Also, the next step can assess the estimation of regression coeffi-cients as well as the performance on imputing missing categorical covariates.
assessing the distribution of a categorical outcome with MAR values.
Conclusions
In conclusion, the proposed multiple imputation method is a reasonable approach to dealing with missing cate-gorical outcome with more than two levels for evaluating the distribution of the outcome. The NNMI approach can work better than PMI when the working model for miss-ing outcome is wrong. When the missmiss-ing probabilities are extreme, NNMI performs more stably than CE, which results in relatively larger SE.
Additional file
Additional file 1: Supplementary materials for ‘A Nonparametric Multiple Imputation Approach for Missing Categorical Data’. Tables with the additional simulation results. (PDF 103 kb)
Abbreviations
BRFSS: Behavioral risk factor surveillance system; CC: Complete-case; CE: Calibration estimator; CR: Coverage rate; EM: Expectation-maximization; EST: estimate; FO: Fully observed; MI: Multiple imputation; NNMI: Nearest neighbor-based multiple imputation; PMI: Parametric multiple imputation; SD: Standard deviation; SE: Standard error
Acknowledgement
The authors would like to thank Dr. Alan H. Dorfman for his helpful suggestions.
Funding
CHH’s research was partially supported by the National Cancer Institute grant P30 CA023074. The content is solely the responsibility of the authors and does not necessarily represent the official views of the NIH and the CDC.
Availability of data and materials
The BRFSS data illustrating the proposed NNMI approach and the related information can be found at http://www.cdc.gov/brfss/annual_data/annual_ 2013.html.
Authors’ contributions
CHH developed the statistical methods, conceptualized this project and revised the manuscript, MZ carried out the simulation study and drafted the manuscript. YH and MY critically commented and revised the manuscript. All authors read and approved the final version of the manuscript.
Competing interests
CHH is a Section Editor and YH is an Associate Editor at BMC Medical Research Methodology. The results and conclusions from this paper are solely from the authors and do not represent any official viewpoints from National Center for Health Statistics, U.S. Centers for Disease Control and Prevention.
Ethics approval and consent to participate
Ethics approval was not required since the BRFSS data used in this manuscript are publicly available and de-identified data.
Publisher’s Note
Springer Nature remains neutral with regard to jurisdictional claims in published maps and institutional affiliations.
Author details
1Department of Epidemiology and Biostatistics, Mel and Enid Zuckerman
College of Public Health, University of Arizona, 1295 N. Martin Ave., 85724 Tucson, USA.2Division of Research and Methodology, National Center for
Health Statistics, Centers for Disease Control and Prevention, 20782 Hyattsville, USA.3Division of Cancer Control and Population Sciences, National Cancer
Institute, 20850 Rockville, USA.
Received: 27 September 2016 Accepted: 11 May 2017
References
1. Carta G, Cagetti MG, Cocco F, Sale S, Lingström P, Campus G. Caries-risk profiles in Italian adults using computer caries assessment system and ICDAS. Braz Oral Res. 2015;29(1):1–8. doi:10.1590/1807-3107BOR-2015.vol29.0126. 2. Cassel C, Sarndal CE, Wretman JH. Some results on generalized
estimation Some results difference and generalized for finite populations estimation regression. Biometrika. 1976;63(3):615–20.
3. CDC. Behavioral Risk Factor Surveillance System, 2013. BRFSS 2013 Survey Data and Documentation. 2016. https://www.cdc.gov/brfss/annual_data/ annual_2013.html.
4. Dempster AP, Laird NM, Rubin DB. Maximum likelihood from incomplete data via the EM algorithm. J R Stat Soc Ser B. 1977;39(1):1–38. 0710.5696v2. 5. Greenland S, Finkle WD. A critical look at methods for handling missing
covariates in epidemiologic regression analyses. Am J Epidemiol. 1995;142(12):1255–64.
6. Heitjan DF, Little RJA. Multiple Imputation for the Fatal Accident Reporting System. Am Stat Ass. 1991;40(1):13–29.
7. Horvitz DG, Thompson DJ. A Generalization of Sampling Without Replacement From a Finite Universe. J Am Stud Stat Assoc. 1952;47(260): 663–85.
8. Hsu CH, Long Q, Li Y, Jacobs E. A nonparametric multiple imputation approach for data with missing covariate values with application to colorectal adenoma data. J Biopharm Stat. 2014;24(3):634–48. 9. Jones MP. Indicator and Stratification Methods for Missing Explanatory
Variables in Multiple Linear Regression. J Am Stat Assoc. 1996;91(433): 222–30.
10. Little RJA, Rubin DB. Statistical Analysis with Missing Data. New York: John Wiley & Sons; 1987.
11. Long Q, Hsu C-H, Li Y. Doubly Robust Nonparametric Multiple Imputation for Ignorable Missing Data. Stat Sin. 2012;22:149–72. 12. Morris TP, White IR, Royston P. Tuning multiple imputation by predictive
mean matching and local residual draws. BMC Med Res Methodol. 2014;14(1):1–13. doi:10.1186/1471-2288-14-75.
13. Rubin DB. Multiple Imputation for Nonresponse in Surveys. New York: Wiley; 1987, p. 258.
14. Rubin DB. Statistical Matching Using File Concatenation with Adjusted Weights and Multiple Imputations. J Bus Econ Stat. 1986;4(1):87–94. 15. Schafer JL, Olsen MK. Multiple Imputation for Multivariate Missing-Data
Problems: A Data Analyst’s Perspective. Multivar Behav Res. 1998;33(4): 545–71.
16. van der Palm DW, van der Ark LA, Vermunt JK. A comparison of incomplete-data methods for categorical data. Stat Methods Med Res. 2012;25(2):754–74.
17. Venables WN, Ripley BD. Modern Applied Statistics with S, 4th ed. New York: Springer; 2002. ISBN 0-387-95457-0. http://www.stats.ox.ac.uk/pub/ MASS4.
18. Von Hippel PT. How to impute interactions, squares, and other transformed variables. Sociol Methodol. 2009;39(1):265–91. doi:10.1111/ j.1467-9531.2009.01215.x.
19. White IR. Simsum: Analyses of simulation studies including Monte Carlo error. Stata J. 2010;10(3):369–85.