175
Copyright © 2011-15. Vandana Publications. All Rights Reserved.
Volume-5, Issue-2, April-2015
International Journal of Engineering and Management Research
Page Number: 175-181
Development of Model based on Life Cycle Assessment for Building
S. V. Dewalkar1, Dr. A. R. Tembhurkar2
1
Department of Civil Engineering, INDIA
2
Department of construction Technology and management, INDIA
ABSTRACT
The environmental performance of products and processes has become a key issue. Many construction companies have found it advantageous to explore ways of moving beyond compliance using pollution prevention strategies and environmental management systems to improve their environmental performance. One such tool is LCA. Although LCA has been widely used in the building sector since 1990, and is an important tool for assessing buildings, it is less developed than in other industries, including perhaps the engineering and infrastructure sector. The concept of LCA considers the entire life cycle of a product. Applying LCA in the building sector has become a distinct working area within LCA practice. LCA practice in the building industry has taken place at a national level, but in general much scope remains for wider involvement and co-operation. This research aims to bridge this gap by assessing the life cycle impacts of the building. The purpose of this study was to develop the model to estimate the CO2
Keywords— carbon footprint, LCA Model, Building LCA.
-emissions of building according to Indian condition.
I.
INTRODUCTION
Applying LCA in the building sector has become a distinct working area within LCA practice. This is not only due to the complexity of buildings but also because of the following factors, which combine to make this sector unique in comparison to other complex products. First, buildings have long lifetimes, often more than 50 years, and it is difficult to predict the whole life-cycle from cradle-to-grave. Second, during its life span, the building may undergo many changes in its form and function, which can be as significant, or even more significant, than the original product. Third, many of the environmental impacts of a building occur during its use. Proper design and material selection are critical to minimize those in-use environmental loads. Fourth, there are many stakeholders
in the building industry. The designer, who makes the decisions about the final building or its required performance, does not produce the components, nor does he or she build the building.
Traditionally, each building is unique and is designed as such. There is very little standardization in whole building design, so new choices have to be made for each specific situation. The comparability of LCAs of distinct products and the way these LCAs are applied to design and construct environmentally sound buildings is a main point of attention in LCA practice. The building industry, governments, designers and researchers of buildings are all affected by the trend of sustainable production and eco-green strategies. The importance of obtaining environment-related product information by LCA is broadly recognized, and LCA is one of the tools to help achieve sustainable building practices.
II.
METHODOLOGY
LCA is one of the available methodologies for assessing the environmental impacts related to product systems. Life Cycle Assessment (LCA) is relatively new to the building industry. LCA heightened awareness of the importance of environmental protection, and the possible impacts associated with building products. Thus, there exist great confusion about LCA, which can inadvertently lead to misuse of LCA tools, techniques, and supporting data. Thus, there is a need for a clear working definition of LCA and related terminology to help build credibility for the methodology and make the building industry more receptive to this new way of evaluating their work. This study provides the information to aid in basic understanding of LCA concept and its application.
176
Copyright © 2011-15. Vandana Publications. All Rights Reserved.
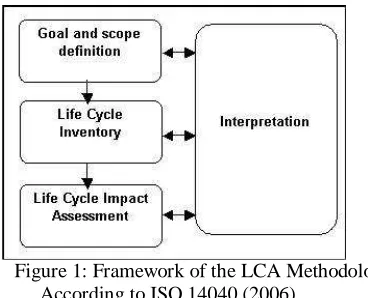
definition, Inventory analysis, Impact assessment, and Interpretation. [3], Figure: 1 represents the link between these components. As can be seen from the Figure1, LCA is not a linear process that simply starts with the first and ends with the last phase. Instead it often follows an iterative procedure, at increasing levels of detail. The individual phases of an LCA will be described below. The standardization of these phases is laid down in the new ISO 14044 standard.
Phase One: Goal and Scope Definition
An LCA starts with an explicit statement of the goal and scope of the study, which sets out the context of the study and explains how and to whom the results are to be communicated. In this phase, the goal and scope definition is designed to obtain the required specifications for the LCA study. The scope describes the system and marks which information is necessary, in what categories, and the level of detail and quality [1]. Goal and Scope includes:
The functional unit, which defines what precisely is being studied and quantifies the service delivered by the product system, providing a reference to which the inputs and outputs can be related
The system boundaries;
Any assumptions and limitations;
The allocation methods used to partition the environmental load of a process when several products or functions share the same process; and
The impact categories chosen
The functional unit is used as a basis for calculation and usually also as a basis for comparison between different systems fulfilling the same function [2]. It means that all data collected are quantitatively related to one quantitative output of the product.
Phase Two: Inventory Analysis
Inventory Analysis involves data collection and calculation procedures to quantify relevant inputs and outputs of a product system. The Inventory Analysis phase consists of data collection, refining of the system boundaries, involves calculation, allocation and relation of data to the specific system, as well as a validation of the applied data. The data must be related to the functional unit defined in the goal and scope definition. Data can be presented in tables. Refining the system
Figure 1: Framework of the LCA Methodology According to ISO 14040 (2006)
boundaries has to be carried out carefully and in consideration of the defined scope of the study, and shall result in a limitation of data handling to those input and output data that are significant for the goal of the study. The results of the inventory is an LCI which provides information about all inputs and outputs in the form of elementary flow to and from the environment from all the unit processes involved. Data will then be aggregated in order to result in an input-output table for the product or service.
Phase Three: Impact Assessment
Inventory analysis is followed by impact assessment. Impact Assessment phase "is aimed at evaluating the significance of potential environmental impacts using the results of the Inventory Analysis" (ISO 14040). Life cycle impact assessment (LCIA) consists of the following mandatory elements:
selection of impact categories, category
indicators, and characterization models;
the classification stage, where the inventory parameters are sorted and assigned to specific impact categories; and
Impact measurement, where the categorized LCI flows is characterized, using one of many possible LCIA methodologies, into common equivalence units that are then summed to provide an overall impact category total.
Phase Four: Interpretation
177
Copyright © 2011-15. Vandana Publications. All Rights Reserved.
identification of significant issues based on theresults of the LCI and LCIA phases of an LCA;
evaluation of the study considering completeness, sensitivity and consistency checks; and
Conclusions, limitations and recommendations. The outcome of this step is directly useful in making environmentally friendly decisions. A key purpose of performing life cycle interpretation is to determine the level of confidence in the final results and communicate them in a complete and accurate manner.
III.
OVERVIEW OF PREVIOUS WORK
IN THIS AREA
In recent years there have been a number of efforts to document the environmental impacts (including energy and carbon impacts) of different materials used in the building industry. Most of the results of these studies are incorporated in the comprehensive LCA databases for materials and processes currently used in commercial LCA applications (such as Sima Pro and Gabi4). In the UK, the Building Research Establishment’s (BRE) database of materials and their environmental impacts is published in the form of books such as the Green Guide to Specification[7], websites (www.greenbooklive.com) and tools (e.g. BREEAM) and are widely used by academia and industry. The ‘Environmental profiles’ database for materials, produced by BRE, is based on process based LCAs of different UK construction materials in an effort to produce standardized environmental data on construction materials in the UK [7]. The precursor to embodied carbon studies, Life Cycle Energy Analysis (LCEA) has also become popular as an indicator of environmental performance. Initial publications on embodied energy coefficients of materials originate from the Buildings Research Association in New Zealand [8] [9] [10]. Current LCEA work in the UK includes the Inventory of Carbon and Energy (ICE) developed by the University of Bath’s Sustainable Energy Research Team [11] [12].
LCA Based Model: Building for
Environmental and Economic Sustainability (BEES)
A process LCA model approach used in a large number of construction-related applications is Building for Environmental and Economic Sustainability (BEES), a software tool developed by the National Institute of Standards and Technology (NIST) to estimate the implications of materials selection in infrastructure planning, mostly for buildings [13]. The green building movement has fueled the growth and popularity of BEES, which provides economic and environmental data for 200+ building products (NIST 2007). BEES is based on manufacturer data, which can be unreliable and includes a certain amount of uncertainty. BEES is also material-based and does not include on-site construction processes, so its
applicability to the hybrid LCA being created here is negligible.
BEES Methodology
• BEES measures economic performance using
similar life cycle thinking
• Economic performance measured using ASTM
standards life cycle cost method, which covers 1. cost of initial investment
2. Replacement 3. Operation
4. Maintenance ,repair and disposal
BEES measure the environmental performance of building products using the internationally standardized and science-based life-cycle assessment approach [5]. All stages in the life of a product are analyzed: raw material acquisition, manufacture, transportation, installation, use, and recycling and waste management. Up to ten environmental impacts are measured across these life-cycle stages: global warming, acid rain, resource depletion, indoor air quality, solid waste, eutrophication (the unwanted addition of mineral nutrients to the soil and water), ecological toxicity, human toxicity, ozone depletion, and smog. Due to its comprehensive, multi-dimensional scope, life-cycle assessment accounts for shifts of environmental problems from one life-cycle stage to another or one environmental medium (land, air, or water) to another. The approach highlights the tradeoffs that must be made to genuinely reduce overall environmental impacts.
BEES measures economic performance using similar life-cycle thinking. Economic performance is measured using the ASTM standard life-cycle cost method, which covers the costs of initial investment, replacement, operation, maintenance and repair, and disposal [15]. The life-cycle cost method sums these costs over a fixed period of time, known as the study period. Alternative products for the same function, say floor covering, can then be compared on the basis of their life-cycle costs. To combine environmental and economic performance into an overall performance measure, BEES uses the ASTM standard for Multiattribute Decision Analysis [14]. The BEES user specifies the relative importance weights used to combine environmental and economic performance scores and may test the sensitivity of the overall scores to different sets of relative importance weights. Supporting data and computations are documented
BEES Model environmental impact
• Global Warming
• Acid Rain
• Eutrophication
• Fossil Fuel Depletion
• Indoor Air Quality
• Habitat Alteration
178
Copyright © 2011-15. Vandana Publications. All Rights Reserved.
• Ecological Toxicity• Human Health
• Criteria Air Pollutants
Bees Product Data
The BEES model uses the ASTM standard classification system, to organize comparable building products into groups. The ASTM standard classifies building components into a three-level hierarchy: major group elements (e.g., substructure, shell, and interiors), group elements (e.g., foundations, roofing, interior finishes), and individual elements (e.g., slab on grade, roof coverings, floor finishes). Elements are defined such that each performs a given function, regardless of design specifications or materials used. The UNIFORMAT II classification system is well suited to the BEES environmental and economic performance methodologies, which define comparable products as those that fulfill the same basic function. The BEES model uses the UNIFORMAT II classification of individual elements, the third level of the hierarchy, as the point of departure for selecting functional applications for BEES product comparisons.
Overall Performance
The BEES overall performance score combines the environmental and economic results into a single score, as illustrated in above Figure to combine them, the two results must first be placed on a common basis. The environmental performance score reflects relative environmental performance, or how much better or worse products perform with respect to one another. The economic performance score, the life cycle cost (LCC), reflects absolute performance, regardless of the set of alternatives under analysis. Before combining the two, the life-cycle cost is converted to the same, relative basis as the environmental score by dividing by the highest-life-cycle cost alternative. Then the environmental and economic performance scores are combined into an overall score by weighting environmental and economic performance by their relative importance values. Overall scores are thereby placed on a scale from 0 to 100; if a product performs worst with respect to all environmental impacts and has the highlife-cycle cost, it would receive the worst possible overall score of 100. The BEES user specifies the relative importance weights used to combine environmental and economic performance scores and may test the sensitivity of the overall scores to different sets of relative importance weight
IV.
OUR APPROACH
Development of Building LCA Model Assumption
. The broader assumptions made are as under:
• The acquisition of building data is mainly
focusing on larger building elements, skipping transports etc.
• The inventory analysis is done focusing on the most important substances that contribute to a certain impact category, skip or simplify the end-of-life of the building, only use generic emission data etc.
• Calculations are simplified by focusing on only a few impact categories.
• data acquisition of the building is done by using excel program and thus reduce the time
• The emission factors are used are the data as suggested in the IPUC manual for India condition
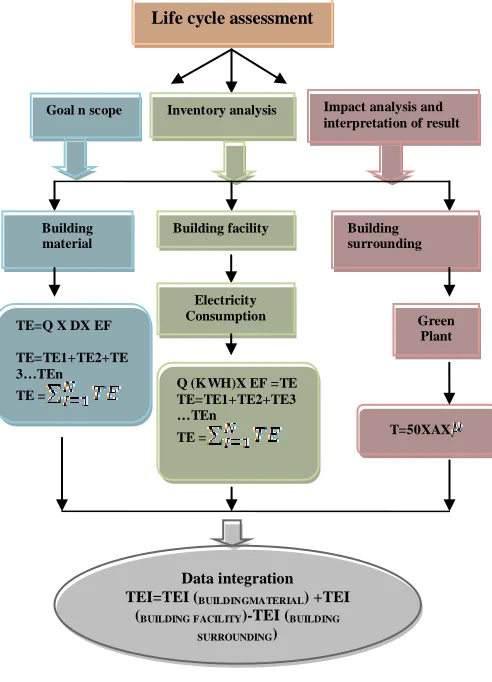
Building LCA Model
The LCA model for assessment of institutional building is divided into three major components:
1. Building material
2. Building facility
3. Building surrounding
179
Copyright © 2011-15. Vandana Publications. All Rights Reserved.
FIGURE 2: BUILDING LCA MODEL
Estimation of Environmental Impact Due To Building Materials
The important environmental aspect is about building materials. A great volume of gasses are emitted from the building material. The building material are divided mainly into two categories viz. major building material and minor building material the major building materials are cement, rebar and structural steel, brick, granite, wood, PVC pipes etc. and the minor building materials are polythene, granite, marble, plaster, ceramic, brass, paint etc. while, the some of the materials which are equally as important as the major building material causing environmental impact are categories as other materials. The environmental impact which is causes due to building materials are evaluated in Table 1.
Thus, the summation of environmental impact of above given material gives the total environmental impact. From eq. no 3.1, eq. no 3.2, eq. no 3.3, eq. no 3.4, eq. no 3.5, eq. no 3.6 and eq. no 3.7,
Total emission
= TE 1 + TE 2 + TE 3 + TE 4 + TE 5 + TE 6 + TE 7….TE n
Total emission =
TABLE 1:
ESTIMATION OF ENVIRONMENTAL IMPACT DUE TO BUILDING MATERIALS
Eq . No . 3.1 Quantity of cement used (Q)
X Density of Cement
(D)
X Emission factor for Cement
(EF)
= Total emission from cement TE1 Eq . No . 3.2 Quantity of structura l steel used (Q)
X Density of Structur
al steel (D)
X Emission factor for structural steel (EF)
= Total emission from structural steel TE2 Eq . No . 3.3 Quantity of timber used (Q)
X Density of timber
(D)
X Emission factor for timber
(EF)
= Total emission from timber TE3 Eq . No . 3.4 Quantity of brick used (Q)
X Density of glass (D)
X Emission factor for glass (EF)
= Total emission from glass TE4 Eq . No . 3.5 Quantity of PVC pipes used (Q)
X Density of PVC pipes
(D)
X Emission factor for PVC pipes (EF)
= Total emission from PVC pipes TE5 Eq . No . 3.6 Quantity of Alumin um used (Q)
X Density of Alumin um (D)
X Emission factor for Aluminu
m (EF)
= Total emission from Aluminu m TE6 Eq . No . 3.7 Quantity of other material used (Q)
X Density of other material (D)
X Emission factor for other material
(EF)
= Total emission
from other material
TEn
Thus Total Emission = TE
TE1+TE2+TE3+TE4+TEn
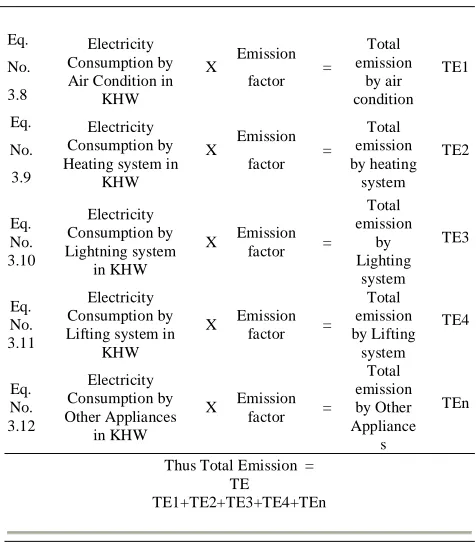
Estimation of Environmental Impact Due To Building Facilities
The operation phase of a building is much longer as compared to the construction. The environmental impacts during the operation phase are mainly from the operation of building facilities, which is electricity-consuming. A great number of pollutants are generated and a large volume of natural resources are consumed in the production of electricity. So the environmental impacts of this phase are indirectly determined by the consumption of energy. In this model the building facilities viz. air conditioning, lifting system, lightning system, equipment and other appliances used. The annual average consumption of electricity can be obtained from design documents. The calculation of environmental impacts from electricity consumption is evaluated in Table 2.
Life cycle assessment
Goal n scope Inventory analysis Impact analysis and interpretation of result
Building material
Building facility Building surrounding
TE=Q X DX EF
TE=TE1+TE2+TE 3…TEn TE =
Electricity Consumption
Q (KWH)X EF =TE TE=TE1+TE2+TE3 …TEn TE = Green Plant T=50XAX Data integration TEI=TEI (BUILDINGMATERIAL) +TEI
(BUILDING FACILITY)-TEI (BUILDING SURROUNDING)
180
Copyright © 2011-15. Vandana Publications. All Rights Reserved.
Thus, from eq. no 3.8, eq. no 3.9, eq. no 3.10, eq. no 3.11, eq. no and 3.12,
Total emission (TE) =
= TE 1 + TE2 +TE3 +TE4 + TE5……TE n
=
TABLE 2:
ESTIMATION OF ENVIRONMENTAL IMPACT DUE TO BUILDING FACILITY
Eq. No. 3.8
Electricity Consumption by Air Condition in
KHW
X Emission factor =
Total emission
by air condition
TE1
Eq. No. 3.9
Electricity Consumption by Heating system in
KHW
X Emission factor =
Total emission by heating
system TE2
Eq. No. 3.10
Electricity Consumption by Lightning system
in KHW
X Emission factor =
Total emission
by Lighting
system TE3
Eq. No. 3.11
Electricity Consumption by Lifting system in
KHW
X Emission factor =
Total emission by Lifting
system TE4
Eq. No. 3.12
Electricity Consumption by Other Appliances
in KHW
X Emission factor =
Total emission by Other Appliance
s
TEn
Thus Total Emission = TE
TE1+TE2+TE3+TE4+TEn
Estimation of Environmental Impact Due To Building Surrounding
The building surroundings with significant environmental impacts such as landscaping, parking lot, pavement, green plants, and the infrastructure near by the building, are considered. However, it is difficult to estimate quantitatively the environmental impacts of these factors. Here, green plants are considered. The environmental impacts of green plants are considered to be positive. The calculation of the volume of absorbed CO2
can be simplified as:
T = 50 x n x Where,
T =the total volume of CO2 absorbed by green plants
during the building’s whole life span (kg).
n =number of green plant surrounding the building.
=The annual volume of CO2 absorption by per green
plants in kg.
The Model
A model is developed integrating the environmental impact from all the major component of building material, building facility and building surrounding. This model provides the Total Environmental Impact (TEI) caused due to these components and is given as follows
Total environmental Impact (TEI)
= Total environmental impact from building material + Total environmental impact from building facility - Total environmental impact from building surrounding
= TEI (Building Material) + TEI (Energy Consumption) - TEI (Building Surrounding)
=
V.
CONCLUSION
The present model developed for life cycle
assessment (LCA) and CO2 emission of building
incorporate with building construction material, building energy consumption and building surrounding in life span perspective. The method used in the study was based on Life Cycle Assessment, highlighted the opportunities for reducing the carbon dioxide impacts on the building. The impacts from the operation stage are limited since the decisions taken during the construction stage pre-determine the impacts of the building over its lifetime. Carbon dioxide emissions reduction is an important way for construction projects to realize the targets of low-carbon building. Through analysis, it is found that there are several measures can be taken. Reduce the use of some materials that produce more CO2
[2] Guinée et al, (2002), Handbook on Life Cycle
Assessment: “Operational Guide to the ISO
Standards
emissions in the producing process. Carbon foot printing can help to identify key construction materials with high-embodied carbon and promote low-carbon alternatives. Comparison of the environmental impact of buildings i.e. carbon emission from buildings is mainly depends upon the location where the building situated, geographical zones, with different uses. It influence all the variables involved in the lifecycle of a building. Evaluation of the influence that the initial decisions adopted in the design phase of a building related to the maintenance.
REFERENCES
[1] Curran, M.A. (ed) (1996), “Environmental Life Cycle Assessment”. ISBN 0-07-015063-X, McGraw-Hill.
181
Copyright © 2011-15. Vandana Publications. All Rights Reserved.
[3] Ibid ISO (2006),”Environmental management – Life cycle assessment – Requirements 25 and guidelines”, ISO
14044:2006. International Organization for
Standardization, 26 Geneva, Switzerland, 2006.
[4] International Organisation for Standardization, 2006. ISO 14040:2006 Environmental management - Life cycle assessment.
[5] International Standards Organization. 1997.
Environmental Management--Life-Cycle Assessment--Principles and Framework, International Standard 14040; ISO. 1998. Environmental Management--Life-Cycle Assessment— Goal and Scope Definition and Inventory Analysis, International Standard 14041; and ISO. 2000. Environmental Management--Life-Cycle Assessment— Life Cycle Impact Assessment, International Standard 14042.
[6] Anderson, J., Shiers, D., and Steele, K. (2009), “The Green Guide to Specification”, 4th
[17] ISO (International Organization for Standardisation). (2006). Environmental management – Life cycle assessment – Principles and framework. Geneva: ISO.
Edition. ISBN: 978-1-84806-071-5. BRE Press, UK.
[7] Alcorn, A. (1998), “Embodied Energy Coefficients for Building Materials”. Centre for Building Performance Research, Victoria University of Wellington, New Zealand.
[8] Alcorn, A. (2001), “Embodied Energy and CO2 Coefficients for New Zealand Building Materials”. Centre for Building Performance Research, Victoria University of Wellington, New Zealand.
[9] Alcorn, A. (2003), “Embodied Energy and CO2 Coefficients for New Zealand Building Materials”. Centre for Building Performance Research, Victoria University of Wellington, New Zealand.
[10] Hammond, G.P., and Jones, C.I., (2008a), “ Embodied energy and carbon in construction materials”. Proceedings of the Institution of Civil Engineers: Energy 161 (Pages 87-98).
[11] Hammond, G.P., and Jones, C.I., (2008b), “Inventory of Carbon and Energy”, Vol.1.6a. University of Bath. [12] Lippiatt, B.C. and Norris, G.A. (1995). “Selecting Environmentally and Economically Balanced Building Materials,” Proceedings, 2nd International Green Building Conference and Exposition - 1995, NIST SP 888.
[13] American Society for Testing and Materials. 1995. "Standard Practice for Applying the Analytic Hierarchy Process to Multiattribute Decision Analysis of Investments Related to Buildings and Building Systems". ASTM Designation E 1765-95, West Conshohocken.
[14] American Society for Testing and Materials. 1994. "Standard Practice for Measuring Life-Cycle Costs of Buildings and Building Systems". ASTM Designation E 917-99, West Conshohocken.
[15] British Standards Institution, (2008a). Guide to PAS 2050 - How to assess the carbon footprint of goods and services. BSI: London.
[16] BSI 2008PAS 2050:2008 Specification for the
assessment of the life cycle greenhouse gas emissions of goods and services.
[18] Lippiatt, B. (2007), “BEES 4.0 Technical Manual and User Guide”, NIST. p. 327.