10
Volume-4, Issue-4, August-2014,
ISSN No.: 2250-0758
International Journal of Engineering and Management Research
Available at:
www.ijemr.net
Page Number: 10-16
The Influence of Sentimental Analysis on Corporate Event Study
Maria Evelyn Jucunda.M1, Sharon Sophia2
1VIT Business School, Chennai, INDIA 2
VIT Business School, Chennai, INDIA
ABSTRACT
The main purpose of this study is to examine the influence of sentimental analysis of text mining data from social media sites on the cumulative abnormal returns of firms in the wake of a corporate event. Using market data for fifteen days around the announcement of the corporate event from the Bombay Stock Exchange, the study calculates the cumulative abnormal returns of firms. The cumulative abnormal returns are calculated using Event Study Market model. Text mining data were collected from twitter for fifteen days around the announcement of the event and were subjected to sentimental analysis in R-Studio which classifies the emotion and polarity of the tweets. With the help of Multiple Regression analysis the study examines the market reaction conveyed through sentiments of text mining data. The major finding of the study is that the text mining sentiments from social media strongly influence the cumulative abnormal returns of firms on a specific event. It is found that text sentiments have a high significant relation with the cumulative abnormal returns of firms which tells that it serve as an effective medium for the prediction of firm’s abnormal returns. This study shows the importance of social media in the value creation of firms while taking huge investment/ selling decisions, capturing of funds in the market, participation of interest in a company or on the wake of a particular event which may affect the firm and the industry in India thus leaving room for researchers in India for further study in this area. As social media is increasing in developing countries, this will be a constructive way to predict the market. So far, researchers have tested the causal relationship between a particular index performance (closing price of index) and text mining sentiments, while this study takes a different stand in the literature to analyze the influence of twitter sentiments over abnormal returns of firms. Thus this research is expected to add significant value to the literature of sentimental analysis.
Keywords— Sentimental analysis, twitter, event study, abnormal returns, R-studio, data mining, market model, value creation, cumulative abnormal returns, twitter sentimental analysis.
I.
INTRODUCTION
Measuring abnormal returns for firms on a particular event like elections, acquisitions, stock market crash and so on has been an interesting area of study to researchers in the west and also in India (Chatterji & Kuenzi, 2010; Rani, Neelam & Yadav, 2014). The most common measure of abnormal returns across the globe is the event study methodology which measures the returns for specific windows (Brown & warner, 1985; Chatterji & Kuenzi, 2010; Chakarbarti, 2008; Jucunda & Sophia, 2014). The abnormal returns for a particular event may be due to various reasons. One such reason is the information asymmetry is rumours that spread across the market about a particular event (Holland & Hodkinson, 1994). In recent years after the introduction of internet, the social media has become one of the most powerful medium of information dissemination. Researchers have tried to capture the use of social media and its information in predicting events such as tsunami, movies success, election polls results and so on (Asur & Huberman,2010; Tumasjan et al, 2010). Thus prediction of events and results from the information in social media is becoming an upcoming and attractive topic to researchers across the world.
11
Twitter was established in 2006 and since then the number of people and firms joining twitter have been increasing drastically. Every day around 65 million tweets are posted per day with 750 tweets each second (as in Zhang, Fuehres & Gloor, 2011). Though researchers in the west have started to exploit the information from twitter, in India it is still an unexplored area. Indian population is the second in the world in the usage of internet and thus the importance of market sentiments from social media cannot be undermined.
This paper takes a different stand from literature as it studies the influence of twitter sentiments on the abnormal returns of firms on a particular event. Unlike the literature which predicts the stock behaviour of tomorrow using today‟s tweets, this paper studies the influence of twitter tweets around the event announcement on the abnormal returns and cumulative abnormal returns around the announcement. The event considered in this study is the announcement of the new CEO of Microsoft Sathya Nadella on February 4th, 2014. This event was selected so as to identify how the closer group of Indian companies reacted to the change of a managerial decision in the top level company from their industry.
Thus the objectives of this paper are multiple:
-
To examine the impact of event study on managerial decision (corporate event).-
To find the effects of text mining sentiments on abnormal returns.-
To analyze the influence of the twitter sentiments on the abnormal returns of the companies for the event.Thus the rest of the paper is organized as follows: Literature review, Methods and materials, Results, Discussions and implications, Limitations and scope for future research.
II.
LITERATURE REVIEW
Bollen, Pepe & Mao (2009) study analyzed the public‟s emotional state over a month period by using a term based emotional rating system known as Profile Of Mood States (POMS). Sentimental analyses are performed for all public tweets broadcasted by twitter users between August 1, 2008 and December 20, 2008. The results were compared to fluctuations recorded by stock market and crude oil price indices and major events in media. The results fund that the events in the social, cultural and economic sphere do have a significant, immediate and highly specific effect on the various dimensions of public mood.
Mao & Bollen (2009) developed a simple and direct indicator of online investment which was extracted from twitter updates and Google search queries. The study examined the predictive power of this new investor bullishness indicator on international stock markets. The study compared twitter and Google bullishness to stock
market values across four different countries using granger causality test. The results indicated that changes in twitter bullishness predict changes in Google bullishness which indicated that twitter information precedes Google queries. The study also found that high twitter bullishness predicts the increase of stock returns.
Bollen, Mao & Zheng (2010) investigated whether the measurement of collective mood states derived from large scale twitter feeds were correlated to the value of Dow Jones Industrial Average (DJIA) overtime. The study used opinion finder and GPOMS to measure variations in the public mood from tweets submitted to the twitter service from feb to dec 2008. Granger Casuality analyses were used to correlate DJIA values to GPOMS & OF values for the past „n‟ days. Next the study used self-organizing fuzzy neural network model to test the hypothesis that the prediction accuracy of DJIA prediction models using measurements of public mood. A correlation of mood time series was drawn between GPOMS and OF and was found that certain mood dimensions of GPOMS partially overlap with OF.
Zhnag, Fuehres & Gloor(2011) tried to predict stock market indicators such as DowJones, NASDAQ & S&P500 by analyzing twitter posts. They analyzed the positive and negative moods of the masses of twitter for a period of 6 months and compared it with stock market indices. The study investigated the emotions of the tweets under three different baselines: number of tweets per day, number of followers per day and number of re-tweets per day. The study correlated the ratio of emotions with the indices returns for the day t+1. The results were surprising as it found that people start using emotional words such as „hope‟, „fear‟ and „worry‟ in times of economic uncertainty, independent of whether they have a positive or a negative context. Thus when the emotions on twitter fly high, the Dow goes down the next day and when people have less hope, fear and worry Dow goes up.
Rao & Srinivasta (2013) investigated the complex relationship between tweet board literatures with the financial market instruments. The study analyzed twitter sentiments for more than 4 million tweets between June 2010 and July 2011 for DJIA, NASDAQ-100 and eleven other big cap technological stocks. The results showed high correlation between stock prices and twitter sentiments. The study used Granger‟s Causuality analysis to validate that the movement of stock prices and indices were greatly affected in short term by twitter discussions. Finally the study implemented expert model mining system (EMMS) to demonstrate that the forecasted returns gave a high value of R-square with low maximum absolute percentage error for DJIA.
As twitter is a recent development after 2006, the literature on stock market prediction of twitter is only after 2006 and is only a few in numbers.
Research Gap:
12
-
So far researchers have identified the causal relationship of index movements and text mining sentiments, but the effect of sentimental analysis on the stocks market performance haven‟t been studied.-
The daily sentiments from text mining data and their effect in the market have been studied whereas the influence of sentimental analysis on a particular event hasn‟t been analyzed yet.-
In India, where the usage of internet is second globally, data mining and sentimental analysis of social media websites cannot be undermined. There is very scarce literature on sentimental analysis in India and this study is expected to add to the knowledge and importance of data mining literature.
III. METHODS AND MATERIALS
SAMPLE SELECTION:
This is the first attempt to test the influence of twitter sentiments on abnormal returns. Therefore top ten companies of the Indian software industry are selected for the study. The companies selected were expected to fulfil the following criteria:
-
The companies should be listed in Bombay Stock Exchange.-
The companies should have market data for (-7,+7) days around the acquisition announcement.-
The companies should be active in stock twits.METHODOLOGY:
Twitter Sentimental Analysis:
The twitter tweets were collected for the major companies which were the main beneficiaries because of the corporate event for 15 days around the event announcement. As a developing economy, acceptance of twitter in Indian markets is gradually increasing compared to foreign markets. The percentage of tweets collected for each company is shown in Figure 1:
Figure 1
The tweets were extracted for data mining for each company and sentimental analysis was run through R-studio. The collected tweets were subjected to sentimental analysis through R-Studio.
. R-Studio is DATA MINING software which analyses the tweets and computes their emotion and polarity using various codes. It is coded software. The tweets collected for each company were imported into R-studio which upon the execution of codes gave the polarity (positive and negative) and emotion (sad, fear, anger, disgust, surprise and anger) for the tweets of each company. Each company‟s polarity and emotion were thus classified separately using R-studio. The emotions were then computed as ratios or percentage. From Zhang, Fuehres & Gloor (2011) and Bollen & Mao (2010) the percentage of emotion and polarity is computed as follows:
where Mt represents the tweets on the particular event „t‟.
(3)Positive%= (total positive tweets)/ (total number of tweets)
(4)Negative%=(total negative tweets)/(total number of tweets)
(5)Joy%= (total joy tweets)/ (total number of tweets) (6)Sad%= (total sad tweets)/ (total number of tweets) (7)Fear%= (total fear tweets)/ (total number of tweets) (8)Anger %=( total anger tweets)/ (total number of tweets)
Event Study Methodology:
To collect and calculate the abnormal returns of the companies, event study methodology is used. Stock returns for each firm were collected for 15 days around the announcement of the corporate event. This study uses a short-term event window of the estimation period -7 to +7 days around the announcement period as the effect will be only around the announcement of the event. The CAR (Cumulative Abnormal Returns) is observed for (-7,+7) days around the announcement. This study adopts the Market model for calculating the abnormal returns from Chatterji & Kuenzi (2001) for its popularity in the literature. Recent Indian studies such as Jucunda & Sophia (2014) has also used market model for calculating abnormal returns. This research adopts the market model of Chatterji and Kuenzi (2001) as in Jucunda & Sophia (2014):
13
NRjt = αj + βjRmt + εjt
NRji = normal rate of return for
company j on day t;
Rmt = rate of return for market index
m on day t;
εjt = error term for company j at time
t.
The coefficients αj and βj are the ordinary least
squares parameters of the intercept and slope, respectively, for company j.
The abnormal return ARjt for the company j will
then be calculated as:
ARjt == Rjt – (αj + βjRmt)
ARjt = Abnormal return for company j on day
t.
Rjt = Return for company j on day t
αj = Estimate of OLS parameter of
intercept
βj = Estimate of OLS parameter of slope
Rmt = Rate of return of market index m
on day t.
The Cumulative Abnormal Returns are calculated using:
CAR (t, T) = ∑t T
ARt
ARt = average abnormal return on day t; t, T = Accumulation period
Examining the CAR of a set of sample securities will be used to look at whether or not the values of
the average residuals, starting from the day of cumulation and up to a specific point, are systematically different from zero (Chatterji & Kuenzi (2001) as in Jucunda & Sophia (2014)).
Multiple Regression Analysis:
To finally examine the influence of twitter sentimental analysis on CAR, the multiple regression analysis is used. The regression functions of the form:
Y = β0 + β1X1 +β2X2 + β3X3 ….+ βNXN + ε
Where β0, β1, β2….. βN = are constants called the
model regression co-efficient or parameters, which means the regression scores identified statistically for the variables that have a significant level as .000.
X1 + X2 + X3 + ……XN = are the predictor variables in this
study.
Y = will be the response variable or dependent variable. It is a quantitative data.
Ε = randomized disturbance or error.
Regression computes the regression co-efficients βj while the independent or predictor variables are the
actual values that are in the variables. Where j = 1, 2,….n.
VARIABLE SELECTION:
The variables used in the stud are the twitter parameters of emotion and polarity and CAR for each
company. The variables for the twitter parameters were calculated from Zhang, Fuehres & Gloor (2011) and Bollen & Mao (2010) and CAR were computed following Chatterji & Kuenzi (2010) and Brown & Warner (1985). The table 1 below shows the list of variables used in the study.
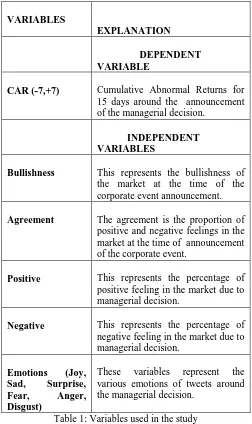
VARIABLES EXPLANATION
DEPENDENT VARIABLE
CAR (-7,+7) Cumulative Abnormal Returns for 15 days around the announcement of the managerial decision.
INDEPENDENT VARIABLES
Bullishness This represents the bullishness of the market at the time of the corporate event announcement.
Agreement The agreement is the proportion of positive and negative feelings in the market at the time of announcement of the corporate event.
Positive This represents the percentage of positive feeling in the market due to managerial decision.
Negative This represents the percentage of negative feeling in the market due to managerial decision.
Emotions (Joy, Sad, Surprise, Fear, Anger, Disgust)
These variables represent the various emotions of tweets around the managerial decision.
Table 1: Variables used in the study
IV.
ANALYSIS AND RESULTS
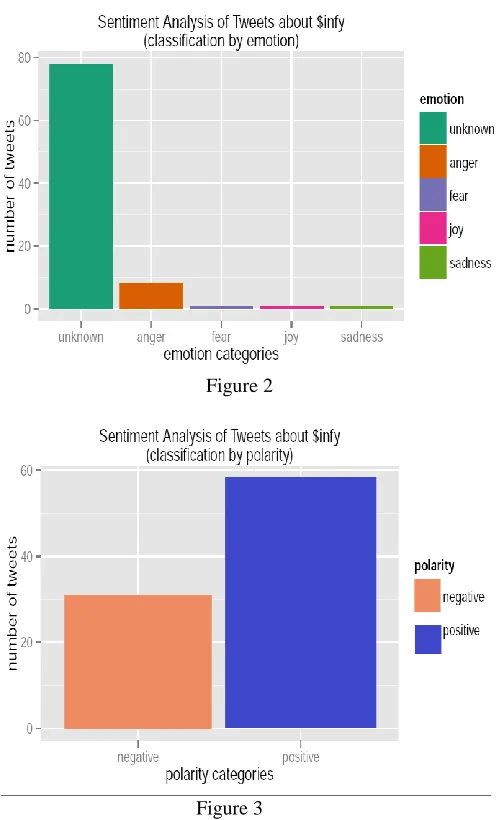
Twitter sentimental analysis – R-studio:
14
Figure 2
Figure 3
Thus the results for each company were generated from R-Studio as shown above where the polarity and emotion of the tweets of companies have been brought out.
After generating the results from R-Studio, the variables were computed using the formulae specified above. The t-tests of the variables computed is shown in Table 2:
VARIABLES MEAN t-TEST
SIGNIFCANCE
BULLISHESS 1.0325 2.274 0.049
AGREEMENT 0.3063 3.149 0.012
POSITIVE 71.5680 8.664 0.000
NEGATIVE 28.3108 3.432 0.007
JOY 6.0473 5.322 0.000
SAD 0.2864 1.913 0.088
ANGER 2.3122 2.052 0.070
FEAR 0.7699 2.756 0.022
SURPRISE 1.2138 1.351 0.210 Table 2
As seen from above, all the variables except surprise are significant at 0%, 1% and 5% level. The variables „positive‟ and „joy‟ are the most highly significant compared to all other variables. „Bullishness‟, „Agreement‟, „Negative‟ and „fear‟ are significant under 5% level. The variables „sad‟ and „anger‟ are significant under 10% level.
Multiple Regression Analysis:
The Cumulative Abnormal Returns for the fifteen days around the event date is calculated using event study methodology, market model. The cumulative abnormal returns for the companies were then subjected to regression analysis with the twitter parameters. The regression results are summarized in Table 3:
MODEL BETA
t-TEST
SIGNIFICANCE
CONSTANT 32.767 22.308 0.029
BULLISHNESS 3.101 7.071 0.089
AGREEMENT 13.607 10.005 0.063
POSITIVE -0.484 -19.419
0.033
JOY -1.021 -38.345
0.017
SAD -4.530 -19.420
0.033
ANGER 0.172 5.257 0.120
FEAR -0.085 -1.146 0.457
SURPRISE 0.769 33.819 0.019
Dependent variable: CAR (-7, +7)
Table 3
15
5% level while „bullishness‟ and ‟agreement‟ are significant at under 10% level. The variables „anger‟ and „fear‟ are insignificant. The results denote the high influence of twitter sentiments on the CAR returns of firms on a particular event. The CAR showed a majority of positive returns among the top ten major software companies and thus regression results shows a high level of significance for the variables „positive‟, „joy‟ and „surprise‟. The significance of „sad‟ and „bullishness‟ explains the fear and uncertainty of the market on the event. It also indicates that not all the investors support the event on a particular date. The variables that support the event to take place are: positive, joy, surprise, sad, bullishness and agreement. Thus this analysis shows how significant the twitter text mining sentiments are towards the CAR of firms on a particular event.
V.
CONCLUSIONS
Discussions and Implications:
The results of this study provide a clear view of the influence of the text mining sentiments on the abnormal returns of the selected software companies in India. The implications of this study are many. This is the first study in India attempting to analyze the influence of twitter sentiments on the cumulative abnormal returns of firms on a particular event. The study proves that twitter sentiments have a significant influence on the CAR of firms. This tells the importance of the social media information on firm‟s value creation. So far, the researchers have only tested the causal relationship between a particular stock markets performance (index closing price) and twitter sentiments, while this study takes a different stand in the literature to analyze the influence of twitter sentiments over abnormal returns of firms. Thus this study brings out the usefulness of the information in social media sites on a firm‟s market behaviour while taking huge investment decisions or on the wake of a particular event which may affect the firm and the industry. Even loss making company can for see the value they will get if the company is retained or sold. The uncertainty of the managerial decision can be seen through the social media so as to analyze the public sentiments and it can also be seen whether public sentiments affects the market or not. As social media is increasing in developing countries, this will be a constructive way to predict the market. Every industry will have an event that will take place. That will not only affect the firm/ industry but the investors, borrowers, lenders and all the beneficiaries. Thus the importance of the study cannot be undermined.
Conclusions, Limitations and Scope for future research:
Financial literature has seen many complex models using hands on secondary and primary data. This study is a different attempt to connect the financial literature with social media. This research is an attempt to analyze the influence of the twitter information and sentiments on the abnormal returns of firms. This topic can be seen from different perspectives such as investors,
practioners and so on. As a budding study it has a wide variety of implications as it links the social media, corporate and the stock market together. The study selects a sample of top ten software companies to analyze the impact of the change of CEO in Microsoft on February 4, 2014 on the performance of Indian software companies around the announcement of the event. The main aim of the study is to utilize the twitter information and analyze the impact of twitter sentiments on the abnormal returns of firms. The study collects tweets for each firm‟s around the event announcement and brings out the emotion and polarity of tweets using R-Studio. The emotion and polarity of the tweets of each company were regressed with the calculated CAR of firms. The results show a high significant influence of twitter parameters on the CAR of firms. This study shows the significant role played by the social media on the CAR of firms on a particular event thus bringing out a constructive way for predicting future returns of firms. This study has a significant impact in the Indian financial literature and stands as a start for future researches in India linking social media sites and stock markets. This study leaves ample of scope for future researchers. Researchers can test it on various events and expand the model. The sample size included in the model is very small and future researchers can test it upon large sample. Also, the inter-correlation among the independent variables hasn‟t been examined and thus their influence on the study was ignored. These biases can be rectified by future researchers. Future researchers in India can develop more structured and complex models predicting stock returns using social media sites. Altogether this study proves the significant influence of the information asymmetry in social media and it‟s sentiments on the value creation or value destruction of firms, thus paving way for future researchers to further explore on this area.
REFERENCES
[1] Zhang,X; Fuehres, H & Gloor, A, P (2011). “Predicting stock market indicators through twitter: I hope it‟s not as bad as I fear”. Procedia-Social Science and Behavioral Sciences, 26, 55-62.
[2] Bollen, J; Pepe, A & Mao, H (17-21 July 2011). “Modeling public mood and emotion: Twitter sentiment and socio-economic phenomena”, Proceedings of the Fifth International AAAI Conference on Weblogs and Social Media (ICWSM 2011), , Barcelona, Spain.
[3] Bollen, J ; Mao, H & Zeng, J H (2010). “Twitter moods predict stock market”, retrieved from http://arxiv.org/pdf/1010.3003.
[4] Mao,H ; Counts, S & Bollen, J. “Quantifying effects of online bullishness on international financial markets”,
retrieved from
16
[6] Jucunda, M E & Sophia, S (2014). “Do acquisitions add value to acquirers in India? Sensitivity of stock market and acquirers returns”, Indian Journal of Finance, 8(5), 5-18.
[7] Asur, S. & Huberman, B. A. (2010). Predicting the Future with Social Media, retrieved from
http://arxiv.org/abs/1003.5699.
[8] Tumasjan, A., Sprenger, T. O., Sandner P. G. & Welpe I. M. (2010). Predicting Elections with Twitter: Whan 140 Characters Reveal about Political Sentiment. 4th International AAAI Conference on Weblogs and Social Media (ICWSM), 2010.
[9] Chakarbarti, Rajesh (2008). Do Indian Acquisitions Add Value?. Money & Finance ICRA , 61-73.
[10] Chatterji R, & Kuenzi A (2001), “Mergers & Acquisitions: The influence of method of payment on bidders share price”, The Judge Institute of Management Studies, University
of Cambridge.
[11] Holland K M & Hodkinson L (1994). The pre-announcement share price behavior of UK takeover target. Journal of Business Finance & Accounting, 21(4), 467-490.
[12] Brown, S., Warner, J. (1985). Using Daily Stock Returns: The Case of Event Studies. Journal of Financial Economics, 14, 3-31
[13] Rani, N; Yadav, SS & Jain, P K (2014). “Abnormal returns of cross-border and domestic acquisition by Indian firms: Impact of method of payment and type of target firms”, South Asian Journal of Management, 21(1), 84-116.