www.ijtrd.com
Comparative Study on Cost Benefit Analysis of Lead
Rubber Isolated Base and Fixed Base Steel Structures
1
Nwe Nwe Win and
2Thazin Thein,
1,2Department of Civil Engineering, Technological University (Mandalay), Mandalay, Myanmar
Abstract—Seismic isolation is an effective method for the seismic protection of buildings. However, its adoption is often limited due to financial considerations. In this research, the cost benefit of steel building, considered as both base isolated and fixed base supported, under earthquake excitations is investigated taking into account the respective total construction cost and base isolation cost including installing cost of either case. The propose building is eight-storeyed residential steel building located in Mandalay. The base isolation system that is utilized lead rubber bearing which made up of Myanmar rubber (RSS-1 and RSS-3). The diameters of RSS-3 are greater 1.53 times than the diameters of RSS-1 depending on the type of rubber properties. The performance assessment is done in term of probable damage cost and repair time which are computed by using fragility curves and FEMA P-58 methodology in Performance Assessment Calculation Tool (PACT). In this study, the net present value of the avoided annual average loss for RSS-1 is greater than RSS-3 at MCE seismic demand levels. So, RSS-1 is more economical and greater seismic capacity to use as major component of base isolators.
Keywords— Cost Benefit, Fragility Curve; Lead Rubber
Bearing; Myanmar Rubber; Performance Assessment
Calculation Tool
I. INTRODUCTION
A seismic isolation system introduces, at the base of the structure, a system which is characterized by high flexibility and energy absorption capacity. The increased flexibility is provided shifts the fundamental period to a range of reduced energy input from the ground motion. The isolation system's energy dissipation capacity then further reduces the displacement demands on the superstructure. Buckle and Mayes identified the basic elements in a practical isolation system as: (1) flexibility to lengthen the period and produce isolation effect, (2) energy dissipation capability to reduce displacement demands to a practical design level, and (3) a means for providing rigidity under service loads, such as winds or minor earthquake loads.
Base isolation is the separation of the structure from its base to negotiate the destructive movement of the ground by providing flexibility and energy dissipation capability through the insertion of isolators between the foundation and the building structure [1]. Unlike the conventional design approach, which is based on an increased resistance (strengthening) of the structures, the seismic isolation concept is aimed at a significant reduction of dynamic loads induced by the earthquake at the base of the structures themselves [2]. The traditional methods often result in high floor accelerations for stiff buildings, or large interstory drifts for flexible buildings. Because of this, the building contents and non structural components may suffer significant damage during a major earthquake. In order to minimize interstory drifts, in addition to reducing floor accelerations, the concept of base isolation is
increasingly being adopted. Storey displacements in the structure together with the accelerations shall be reduced significantly. While this reduction in the accelerations protects the non structural elements from the acceleration originated damages, the reduction in the storey displacements shall allow both the structural and non structural elements survive the earthquake without any damage or with little damage [3].
Though the application of isolator is going to be very familiar all over the world, there is a lack of proper research to implement the device practically for local buildings in Mandalay especially risk seismicity region, Myanmar as per the local requirements. Many types of isolation system have been developed elsewhere in the world to provide flexibility and damping to a structure in the event of seismic attack. Among the categories, lead rubber bearing(LBR) is the most commonly used isolator nowadays. In this study, base isolation devices are installed under each column between the building and the supporting foundation to support the building and to minimize the damage due to earthquake. Nonlinear time history analysis is done to obtain structural response at design basic earthquake (DBE) and maximum considered earthquake (MCE) levels for two types of Myanmar rubber, RSS-1 and RSS-3. Then, performance assessment is done in term of probable damage cost and repair time which are computed by using fragility curves and FEMA P-58 methodology in Performance Assessment Calculation Tool (PACT)
.
The average annual value of a performance measure is used in cost benefit analyses for determining a reasonable insurance premium for a property.II. PROPERTIES OF MYANMAR RUBBER
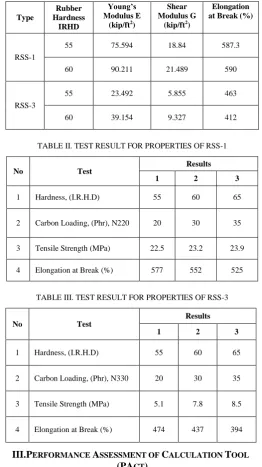
Lead rubber bearings used as Myanmar rubber are expected to be widely used in Myanmar. In this study, the RSS-1 and RSS-3 of Myanmar rubbers are used as major component of lead rubber bearings. The required experimental tests are conducted to determine the properties of the materials in Rubber Research Development Centre. Two different types of carbon black: N220 and N330 were used and 20 to 35 phr carbon black was compound to the rubber blends. Grade N220 carbon black was used as filler in RSS-1 and N330 was used in RSS-3. The experimental test results of Myanmar rubber properties for different types of specimens are shown in Table I, Table II and Table III.
RSS-1 Myanmar rubber contains the following chemical properties. They are
Volatile matter = 1.74%
Dirt Content = 0.06%
Ash Content = 0.4%
Nitrogen Content = 0.63%
RSS-1 Myanmar rubber contains the following physical properties. They are
www.ijtrd.com
Plasticity Retention index(P.R.I) = 78The testing of these properties of RSS-3 was not conducted.
TABLE I. TEST RESULTS FOR PROPERTIES OF MYANMAR RUBBER
Type
Rubber Hardness
IRHD
Young’s Modulus E
(kip/ft2)
Shear Modulus G
(kip/ft2)
Elongation at Break (%)
RSS-1
55 75.594 18.84 587.3
60 90.211 21.489 590
RSS-3
55 23.492 5.855 463
60 39.154 9.327 412
TABLE II. TEST RESULT FOR PROPERTIES OF RSS-1
No Test Results
1 2 3
1 Hardness, (I.R.H.D) 55 60 65
2 Carbon Loading, (Phr), N220 20 30 35
3 Tensile Strength (MPa) 22.5 23.2 23.9
4 Elongation at Break (%) 577 552 525
TABLE III. TEST RESULT FOR PROPERTIES OF RSS-3
No Test
Results
1 2 3
1 Hardness, (I.R.H.D) 55 60 65
2 Carbon Loading, (Phr), N330 20 30 35
3 Tensile Strength (MPa) 5.1 7.8 8.5
4 Elongation at Break (%) 474 437 394
III.PERFORMANCE ASSESSMENT OF CALCULATION TOOL (PACT)
PACT is the performance assessment calculation tool provided by FEMA P-58. This section illustrates how the program was used for this study.
A. Input of Building Information in PACT
The first step in PACT was to enter the basic information of the purpose building into the program. This data included the region cost multiplier and date cost multiplier, which linearly scaled the damage cost results based on ratios of how much the results vary from Northern California region and 2011 date values. Since this was a comparative study and the project’s region: Myanmar was expected to yield cost values differ to the Northern California region, therefore assume the region cost multiplier was taken as 1.03. The project was analyzed to be concurrent with the time of this study (early 2017), so an inflation rate of 6% was calculated based on the inflation rate in Myanmar averaged 6.23 % from 2011 to 2016. Based on this calculation, a date cost multiplier of 1.06 was used for this study.
Next, the purpose building’s basic information was entered into PACT. All eight floors and the roof along with their storey heights and areas were input. The total replacement cost was estimated to be $8.6 million ($165 per square feet), equal to the total construction cost. The core and shell replacement cost was given as 40% of the total replacement cost, which was the percentage used in example problems of buildings in the PACT implementation guide [3]. This cost ratio translated into a core and shell replacement cost of $3.1 million ($66 per square foot). The height factor linearly scales damage costs to take into account the increase in cost required to repair building components on upper levels, due to added travel time, scaffolding, etc.
B. Selecting and Quantifying Components in PACT
The PACT component quantification tool was used to determine the types and quantities of components within the residential buildings. The tool populates each building with components based on pre-determined population densities of the components for each occupancy category. By entering the area of each floor and the percentage of floor area each occupancy category is assigned to, the given population densities of the components for each occupancy category may be combined to quantify the total number of components likely to be on each floor and the building as a whole.
Once the fragility curves of the components were defined, the directional information of the components was entered into PACT. The performance groups were created for each storey level and each direction (Direction 1, Direction 2, and Non-Directional). Here the component quantities and quantity dispersions (found earlier with the component quantification tool) were entered, along with their population model (multi-storey building) and demand parameter ((multi-storey drift or acceleration). The height factors recommended in the PACT implementation guide were used for this study.
C. Analysis Settings and Input of Demand Values in PACT
Among the assessment types available in PACT, an “Intensity-Based” analysis was chosen for this study. This assessment type evaluates a building’s response to seismic earthquake intensities, that is, ground motions scaled to 5% damped response spectrums, as was done in the analysis phase of this study. The “Intensity-Based” assessment differs from the “Scenario-Based” assessment in that the building’s proximity to an actual seismic fault does not need to be taken into account .In accordance with the required data needed to perform the analyses, the floor accelerations and inter-storey drifts found in ETABS for each seismic event were entered into PACT. The nonlinear analysis option was selected in lieu of the simplified (linear) analysis option, which was only recommended when peak drifts were expected to be less than 4 times the drifts at which yield of the structural members were reached. This option caused the analysis results to be more accurate.
IV. NET PRESENT VALUE FOR DECISION MAKING
www.ijtrd.com
building, over and above any legal requirements. Essentially this process is performed by evaluating the present value of the average annual costs associated with future earthquake damage that is avoided by enhanced resistance, against the present value of the costs associated with enhanced seismic resistance. The Net Present value of a stream of future expenditures is given by the equation (1),
i t i 1
1 1
A
NPV (1)
where,
NPV = net present value of a stream of equal annual expenditures or avoided expenditures
A = annual expenditures t = period of years
I = internal rate of return or interest rate
For decision associated with property with an anticipate life of more than 40 years, the annual cost or saving can be considered an annuity of infinite term. In this case, equation (2) reduces to the simpler form,
i A
NPV (2) V. COMPARISON OF PERFORMANCE ASSESSMENT RESUILS IN
PACT
In the performance assessment phase, the floor accelerations and inter-storey drifts obtained from the nonlinear time history analyses in the analysis phase are used to assess the seismic performance of the structures via fragility cures and FEMA P-58 (Federal Emergency Management Agency) are used to compute probable damage costs and repaired time for each base condition at seismic demand levels and the results are compared.
A. Comparison of Damage Cost for DBE Fixed and RSS-1 Isolated Base Buildings
The comparison of damage cost for fixed base and RSS-1 isolated base buildings at DBE level seismic events is as shown in Figure 1 and Figure 2. The X-axis shows the damage costs in thousands of dollars and the Y-axis gives the probability of repair costs not surpassing the given damage costs.
Figure.1: Damage Cost for DBE Fixed Base Building
Figure.2: Damage Cost for DBE RSS-1 Isolated Base Building
According to Figure 1 and Figure 2, the fixed base and the isolated base buildings have 50% probability of incurring $3.32 million and $2.78 million in damage costs when subjected to DBE level seismic events. Base isolation therefore reduced DBE level damage costs by $0.54 million.
B. Comparison of Repair Time for DBE Fixed and RSS-1 Isolated Base Buildings
The comparison of repair time for fixed base and RSS-1 isolated base buildings at DBE level seismic events is as shown in Figure 3 and Figure 4.
Figure.3: Repair Time for DBE Fixed Base Building
Figure.4: Repair Time for DBE RSS-1 Isolated Base Building
From Figure 3 and Figure 4, the probabilities of repair time being incurred for the fixed base and the isolated base buildings subjected to DBE level of seismic demands are 89 and 86 days respectively.
C. Comparison of Damage Cost for MCE Fixed and RSS-1 Isolated Base Buildings
www.ijtrd.com
Figure.5: Damage Cost for MCE Fixed Base Building
Figure.6: Damage Cost for MCE RSS-1 Isolated Base Building
According to Figure 5 and Figure 6, the fixed base and the isolated base buildings have 50% probability of incurring $3.775 million and $3.1286 million in damage costs when subjected to MCE level seismic events. Base isolation therefore reduced DBE level damage costs by $0.66 million.
D. Comparison of Repair Time for MCE Fixed and RSS-1 Isolated Base Buildings
The comparison of repair time for fixed base and RSS-1 isolated base buildings at MCE level seismic events is as shown in Figure 7 and Figure 8.
Figure.7: Repair Time for MCE Fixed Base Building
Figure.8: Repair Time for MCE RSS-1 Isolated Base Building
From about Figure 7 and Figure 8, the probabilities of repair time being incurred for the fixed base and the isolated base buildings subjected to MCE level of seismic demands are 120 and 102 days respectively.
E. Comparison of Damage Cost for DBE Fixed and RSS-3 Isolated Base Buildings
The comparison of damage cost for fixed base and RSS-3 isolated base buildings at DBE level seismic events is as shown in Figure 1 and Figure 9.
Figure.9: Damage Cost for DBE RSS-3 Isolated Base Building
From Figure 1 and 9, the fixed base and the isolated base buildings have 50% probability of incurring $3.32 million and $2.65 million in damage costs when subjected to DBE level seismic events. Base isolation therefore reduced DBE level damage costs by $0.67 million.
F. Comparison of Repair Time for DBE Fixed and RSS-3 Isolated Base Buildings
The comparison of repair time for fixed base and RSS-3 isolated base buildings at DBE level seismic events is as shown in Figure 3 and Figure 10.
www.ijtrd.com
According to Figure 3 and Figure 10, the probabilities of repair time being incurred for the fixed base and the isolated base buildings subjected to DBE level of seismic demands are 89 and 85 days respectively.
G. Comparison of Damage Cost for MCE Fixed and RSS-3 Isolated Base Buildings
The comparison of damage cost for fixed base and RSS-3 isolated base buildings at MCE level seismic events is as shown in Figure 5 and Figure 11.
Figure.11: Damage Cost for MCE RSS-3 Isolated Base Building
According to Figure 5 and Figure 11, the fixed base and the isolated base buildings have 50% probability of incurring $3.775 million and $3.1667 million in damage costs when subjected to MCE level seismic events. Base isolation therefore reduced DBE level damage costs by $0.61 million.
H. Comparison of Repair Time for MCE Fixed and RSS-3 Isolated Base Buildings
The comparison of repair time for fixed base and RSS-3 isolated base buildings at MCE level seismic events is as shown in Figure 7 and Figure 12.
Figure.12: Repair Time for MCE RSS-3 Isolated Base Building
According to Figure 7 and Figure 12, the probabilities of repair time being incurred for the fixed base and the isolated base buildings subjected to MCE level of seismic demands are 120 and 97 days respectively.
VI. COST BENEFITANALYSIS ON BASE ISOLATION
The cost of implementing base isolation on a project is typically 5% of the total construction cost (Robinson 2012). This proportion takes into account not only the cost of the isolation bearings, but also of the cost of installing. By using the proportional cost of the base isolation system and the estimated total construction cost for the building in this study, the following calculations were performed, and the results were summarized in Table IV below.
Total Construction Cost = $8.6 million ($165 per Square Foot)
5% (Base Isolation Cost + = $0.43 million Installation Cost)
TABLE IV. TOTAL DAMAGE COST SAVING RESULT FOR RSS-1 AND RSS-3
Types of Rubber RSS-1 RSS-3
Seismic Demand Level DBE MCE DBE MCE
Damage Saving
($ Million) 0.54 0.66 0.67 0.61
Isolation Cost
($ Million) 0.43 0.43 0.43 0.43
Total Saving
($ Million) 0.11 0.23 0.24 0.18
As shown in Table IV, the implementation of base isolation technology would like achieve between $0.09 million to $0.24 million in total saving for eight-storeyed steel residential building, depending on the types of rubber and the intensity of the seismic demands.
VII. NET PRESENT VALUE ANALYSIS FOR DECISION MARKING
Comparison results of net present value for various base conditions at DBE and MCE seismic demand levels are shown in Table V and Table VI.
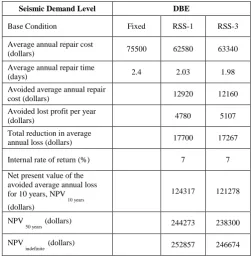
TABLE V. NET PRESENT VALUE FOR DBE LEVEL OF VARIOUS BASE CONDITIONS
Seismic Demand Level DBE
Base Condition Fixed RSS-1 RSS-3
Average annual repair cost
(dollars) 75500 62580 63340
Average annual repair time
(days) 2.4 2.03 1.98
Avoided average annual repair
cost (dollars) 12920 12160
Avoided lost profit per year
(dollars) 4780 5107
Total reduction in average
annual loss (dollars) 17700 17267
Internal rate of return (%) 7 7
Net present value of the avoided average annual loss for 10 years, NPV
10 years (dollars)
124317 121278
NPV
50 years (dollars) 244273 238300
NPV
indefinite (dollars) 252857 246674
TABLE VI. NET PRESENT VALUE FOR MCE LEVEL OF VARIOUS BASE CONDITIONS
Seismic Demand Level MCE
Base Condition Fixed RSS-1 RSS-3
Average annual repair cost
(dollars) 66400 55600 53000
Average annual repair time
(days) 1.78 1.72 1.7
Avoided average annual repair
www.ijtrd.com
Avoided lost profit per year(dollars) 648 1072
Total reduction in average
annual loss (dollars) 11448 14472
Internal rate of return (%) 7 7
Net present value of the avoided average annual loss for 10 years, NPV
10 years (dollars)
80406 101645
NPV
50 years (dollars) 157991 199724
NPV
indefinite (dollars) 163543 206743
From Table V and Table VI, it can be seen that the net present value of the avoided average annual loss for 10 years is $80406 in RSS-1 and $101645 in RSS-3 at DBE seismic demand level. The net present value of the avoided average annual loss for 50 years is $157991 in RSS-1 and $199724 in RSS-3. The net present value of the avoided average annual loss for an indefinite period is $163543 in RSS-1 and $206743 in RSS-3. At MCE seismic demand level, the net present value of the avoided average annual loss for 10 years is $124317 in RSS-1 and $121278 in RSS-3. The net present value of the avoided average annual loss for 50 years is $244273 in RSS-1 and $238300 in RSS-3. The net present value of the avoided average annual loss for an indefinite period is $252857 in RSS-1 and $246674 in RSS-3.
CONCLUSION
In this research, cost benefit analysis of fixed base and isolated base which made up of Myanmar rubber (RSS-1 and RSS-3) for eight-storyed steel buildings. The mechanical properties of isolators are assigned into ETABS software. And then, the non-linear time history analysis is carried out. After being analyzed with base isolators, the stability and roll-out conditions of base isolators have been checked under the gravity and earthquake loads at DBE and MCE seismic demand levels. The resulting storey accelerations and storey drifts are input into PACT to determine the levels of structural and non structural damage inflicted on each building. The default input construction rate for PACT is based on the rate of Northern California region in 2011. Hence, it is modified with region cost and inflation rate in order to attain approximate local rate. The damage costs, and repair time reported in this study are estimated due to the number of components and fragility curves available in PACT. Maintenance costs for the isolation system are not considered for this study. The average annual value of a performance measure is used in cost benefit analyses for determining a reasonable insurance premium for a property. The annual average saving of RSS-1 over 50 years and indefinite years is greater than the cost of upgrade, there would be a net benefit to investing in the upgrade.
From the results of this study, the following conclusions can be drawn out:
RSS-3 isolated building provides lower damage cost and repair time than RSS-1 isolated building at DBE seismic demand level.
At MCE seismic demand level, damage cost are more reduced in RSS-1 than RSS-3 but slightly increased repair time.
The conduct of base isolation technology would likely achieve in total saving for the residential building are depending on the intensity of the seismic demands levels.
The calculated net present value proves that using isolator with Myanmar rubber is more beneficial in long run than non isolated structure even though the initial cost of installation of isolator is high.
Base isolation used Myanmar rubber is found significantly effective mitigating and preventing for seismic performance of proposed building.
Acknowledgment
The authors would like to express our deepest gratitude and sincere appreciation to the following persons, whose guidance aided towards the competition of this paper. We would like to thank Dr. Sint Soe, Rector, Technological University (Mandalay), for his kindness, help, permission and suggestion for completion of this paper. Special thanks are extended to Dr. Aye Mya Cho, Professor, Mandalay Technological University and Dr Zaw Min Htun, Professor and Head, Technological University (Pakokku) for their valuable suggestion and excellent comments to conduct this paper. We would like to thank our parents, teachers and all of friends for their support and encouragement throughout this research.
References
[1] Ismail, J. Rode, F.Ikhouane: An Innovative Isolation Device for Aseismic Design, Engineering Structures 32, (2010) 1168-118.
[2] Micheli, S.Cardini, A.Colaiuda, P.Turroni: Nuclear Engineering and Design, Investigation upon the Dynamic Structural Response of A Nuclear Plant on A Seismic Isolation Devices, 228 (2004) 319-343. [3] Wai-Fah Chen Charles Scawthorn: Earthquake Engineering Handbook,
(2003).
[4] N.Naeim & J.M.Kelly: Design of Seismic Isolated Structures from Theory to Practice, (1999).
[5] Pallavi Wamanrao Taywade: Sustainability Of Structure Using Base Isolation
[6] Council (ATC). FEMA P-58: Seismic Performance Assessment of Buildings, Volume 2 – Implementation Guide. (2012). 26 March (2013
Techniques for Seismic Protection, International Journal of Innovation Research in Science, Engineering and Technology, vol.4, Issue 3, ISSN 2319-8753, March (2015).
[7] Applied Technology).
[8] Applied Technology Council. PACT (Version 2.9.4), Computer Software, Redwood City, California (2012), 26 April (2013).
[9] Chandak N.R.: Effect of Base Isolation on The Response of Reinforced Concrete Building, Journal of civil engineering Research, vol. 3(4), (2013) pp. 135-142.
[10] Kilar V., Petrovcic S., Koren D., Silih S.: Cost Viability of A Base Isolation System for the Seismic Protection of A Steel High-Rack Structure, International Journal of Steel Structures, 13 (2), (2013) 253-263.
[11] Computers and Structures: Inc. ETABS (Nonlinear Version 9.7.4) Computer Software. Berkeley, California (2011). 10 December (2012) [12] American Institute of Steel Construction, Inc. Code 360: Specification
for Structural Steel Buildings, 2nd Printing, (2005), 23 June (2011). [13] Thakare P.P. and Jaiswal O.R.: Comparative Study of Fixed Base and
Base Isolated Building using Seismic Analysis, International Journal of Earth Sciences and Engineering, 4(6), (2011) 520-525.