R E S E A R C H
Open Access
T2* dynamic contrast enhanced MR
perfusion for cervical cord lesions; does it
work?
Mohamed Saied Abdelgawad
1*, Mohamed Ihab Samy Reda
2and Nermeen Abd El-Monsef Abd El-Maaboud
2Abstract
Background:The goal of this work was to assess the value of magnetic resonance (MR) perfusion in narrowing the
differential diagnosis of cord lesions.
Thirty eight patients with different cervical cord lesions were involved in this study. This includes 20 males and 18 females, ranging between 13 and 60 years old.
Conventional MR with T2W (axial and sagittal) and pre and post contrast T1W (axial and sagittal) in addition to the T2* MR perfusion sequence were done. The final diagnosis of cervical cord tumors was achieved by biopsy and histopathological diagnosis, while inflammatory lesions were proved by clinical, laboratory data and follow-up for six months.
Results:Neoplastic lesions were found in 13 patients, while 25 patients had inflammatory lesions. Relative cord/cerebral blood volume (rCBV) was significantly higher in neoplastic lesions when compared to non-neoplastic ones (2 ± 1.13 vs 1.01 ± 0.62), respectively. A cutoff value of 1.38 or higher has high sensitivity of 78% and specificity of 83% in differentiating between these lesions.
Conclusion:T2* is a valuable technique in differentiating neoplastic from non-neoplastic cervical cord lesions.
Keywords:MR perfusion, Cervical cord lesions
Background
Perfusion imaging with T2* dynamic susceptibility con-trast enhancement magnetic resonance imaging (MRI) rely upon the tissue microvasculature. It is performed by injection of MRI-specific contrast material through a venous line and monitoring it as it passes throughout the tissue microvasculature. The tumor grade depends on its tissue vasculature. The tumor vasculature is ele-vated relative to normal tissues. In high-grade tumors, there is a large number of vessels and a greater volume of blood and rate of perfusion passing through it [1].
In dynamic perfusion MRI with T2* or gradient se-quences, the signal level declines in areas with higher con-trast concentration due to alterations in local susceptibility. This is different from perfusion with T1-weighted sequence in which the signal strength parallels the high contrast con-centration [2].
New MR systems with strong gradient hardware, allow dynamic examination with at least one image stack repe-tition per second. These make the visualization of para-magnetic contrast media passing along cord segments possible [3].
Conventional MRI with contrast is basically used for assessment of many different cervical cord lesions; but sometimes, it is very hard to recognize the difference be-tween inflammatory and neoplastic cord lesions; this makes surgical biopsy unavoidable [4].
Neoplastic cord lesions are usually presented as ill-defined hyperintense lesions on T2W with heterogenous enhancement; astrocytoma composes the majority [5,6].
The cervical cord by far is the commonest site with prediction to eccentric location, while with lesser degree to dorsal segments. Heterogeneous incomplete contrast enhancement is usually seen with obscured margins of the lesion. Intra-lesion cystic changes are sometimes identified [7].
On the other hand, ependymomas are well-defined le-sions displaying intense homogeneous enhancement. In
© The Author(s). 2019Open AccessThis article is distributed under the terms of the Creative Commons Attribution 4.0 International License (http://creativecommons.org/licenses/by/4.0/), which permits unrestricted use, distribution, and reproduction in any medium, provided you give appropriate credit to the original author(s) and the source, provide a link to the Creative Commons license, and indicate if changes were made.
* Correspondence:[email protected]
1Radiology Department, National Liver Institute, Menoufia University, Shebin
El Kom, Egypt
certain cases, T2W hypointense rim is present around the lesion due to previous hemorrhagic changes, and this is called“cap sign”[8].
Haemangioblastomas characteristically appear as sharply defined T2 hyperintense cystic lesions, harboring intensely enhancing wall nodules [9].
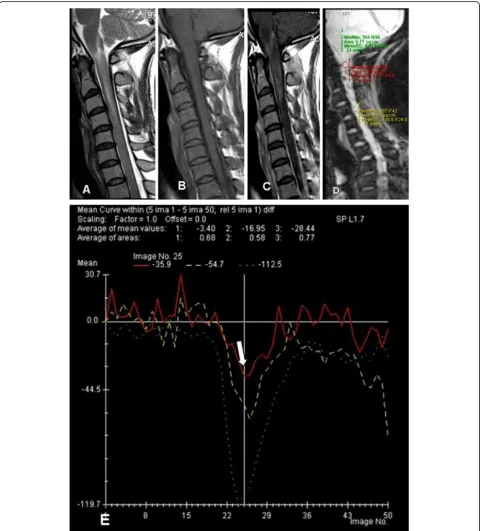
Fig. 1Thirty-seven-year-old male patient presented by acute onset of bilateral lower limb weakness and neck pain.aSagittal T2 revealed abnormal T2 hyperintense signal spanning over the cervicomedullary junction till CV4 level.bT1W pre andcpost contrast showing faint patchy enhancement.drCBV was calculated in relation to the normal lower cervical cord, showingehypoperfusion (arrow to red curve) compared to the normal cord (yellow curve), suggesting non-neoplastic inflammatory process.Green curveindicates the pons. Initial clinical diagnosis of viral myelitis (zoster) due to appearance of skin eruptions, the patient improved clinically, confirming its non-neoplastic nature
Spinal cord deposits are very rare. The top list meta-static neoplasms to the cord are colon, breast, followed by renal neoplasm, and lymphoma. An intense enhan-cing cord lesion with extensive disproportionate nearby cord edema must be considered in terms of metastatic etiology [10].
Multiple sclerosis commonly affects the cervical cord, with preferential involvement of the posterior and lateral cord aspects [11].
Cord transverse myelitis usually affects its inner por-tion, extending for more than three adjacent vertebrae length [12].
Neuromyelitis optica (NMO) by the same way pre-sented by long-segment cervical cord hyperintense lesion reaching up to three contiguous vertebrae, but usually there is optic nerve affection [13].
Post irradiation myelitis often appears as a large area of T2W hyperinensity at the irradiated cord segment and shows disproportionate irregular post contrast en-hancement [14].
The aim was to evaluate the performance of T2* dy-namic susceptibility contrast-enhanced MRI perfusion in different cervical cord lesions.
Methods Patients
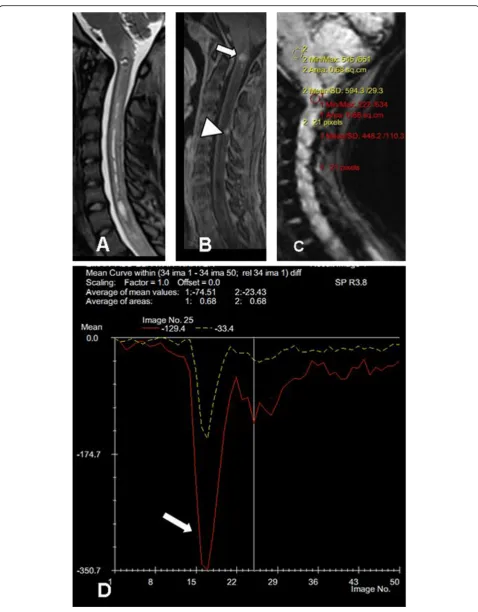
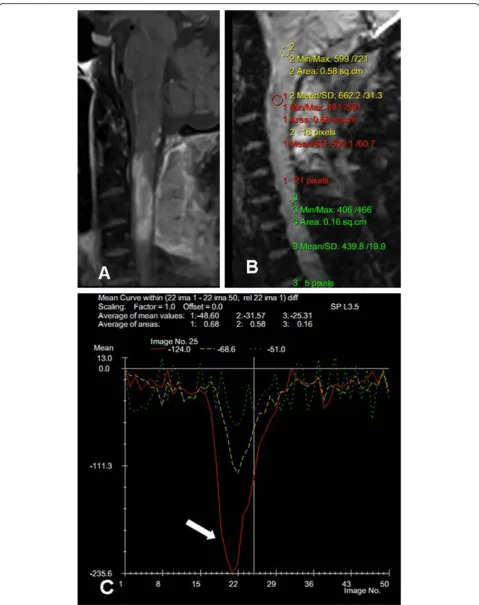
The patients' consents were regulated by the principles of research board, confirming medical records privacy of pa-tients. Thirty eight patients with different lesions affecting the cervical cord were involved in the study. This included 20 males and 18 females, ranging between 13 and 60 years old (mean age = 38 years, Figs.1,2,3and4).
Patients with proved diagnosis of either neoplastic cord masses or non-neoplastic/inflammatory cord le-sions were included in this study, while, traumatic cord cases or vascular malformations were excluded.
The final diagnosis of cervical cord tumors was proved by biopsy and histopathological diagnosis (13 patients); while inflammatory lesions (25 patients) were confirmed by clinical, laboratory data, and follow-up for six months.
A detailed clinical data was taken from all patients, consisting of personal data, past history, and neuro-logical complaints.
The examination for all patients were done by a closed MRI unit 1.5 T (Avanto, Siemens, Erlangen, Germany), without complications.
Conventional MRI
In the conventional MRI, (1) T2 TSE (axial and sagittal) with TR of 3500 ms, TE of 88 ms, and acquisition time of 2 min 35 s was done for each sequence; (2) pre and post contrast T1 SE (axial and sagittal) with TR of 640 ms, TE of 10 ms with acquisition time of 3 min 23 s was done for each sequence. A slice thickness of 1 mm, a gap of 0.3 mm, 256 × 256 acquisition matrix, and FOV = 250 mm was used.
Perfusion images
The dynamic T2* perfusion was acquired with a single shot, gradient-echo, echo-planar imaging sequence. TR/ TE = 1520/32 ms; flip angle, 80°; FOV = 230 mm; matrix = 96 × 128; single mid-sagittal slice with a thickness of 10 mm; number of scans 50, during the first pass of contrast
“Dotarem”. The volume of contrast was calculated as 0.1 mmol/Kg for a maximum of 20 ml. The total dose was at flow velocity of 5 ml/s, then a bolus injection of saline (20 ml), with an automatic injector through an 18- to 20-gauge needle. The scan time for the sequence was 1 min 44 s.
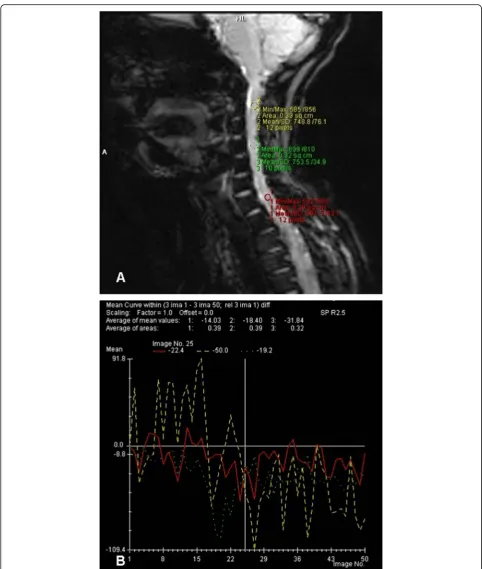
Post processing assessment done by a dedicated soft-ware package (syngo neuro perfusion evaluation). Perfu-sion mean curves were created at different regions of interests (ROIs) including the areas of interest and normal-appearing cervical cord or pons. Then compara-tive curves were made (Fig.5).
Results
The results are summarized in Table1.
Neoplastic lesions
Perfusion examinations were achieved in 13 cases with intramedullary neoplasms. We measured tumor relative blood volume (rCBV) in comparison to the sound cord in 9 cases. We computed the rCBV between the cord le-sions and the pons in four cases where the tumors are extending along the whole cervical cord. The cases com-pared to the normal cord showed increased rCBV except one lesion. The estimated rCBV ratio was from 1.08 to 4.5, with highest rCBV found in the case of glioblastoma multiforme (GBM). Only one neoplastic lesion was hypoperfused (rCBV = 0.54); this lesion showed minimal progression in size when reviewed from a study done 10 years ago, suggesting low grade nature of the lesion.
We used the normal-appearing cord either above or below the cervical cord lesions, or the normal pons of (See figure on previous page.)
Fig. 2Eighteen-year-old female patient presented by recurrent neck pain and bilateral upper limb numbness with weakness on the right side.a
Sagittal T2 andbT1 post contrast showing small enhancing intramedullary lesion (arrow) located opposite CV2 associated with syrnix extending along the cervical cord and enhancing extra-medullary intra-dural lesion (arrowhead).canddrCBV was calculated in the lesion (arrow to red curve) in relation to the pons (yellow curve), showing a hyperperfusion pattern. The lesion was pathologically diagnosed as anaplastic astrocytoma
the same patients in this study as an internal reference
“control”.
We found that the normal range of the healthy cord/pons ratio rCBV calculated in 30 cases was about 0.39 ± 0.12.
When comparing the rCBV in the 4 neoplastic lesions which were involving the whole cervical cord and the pons rCBV, the ratio was ranging from 0.7 to 2.5, sug-gesting a hyperperfusion pattern.
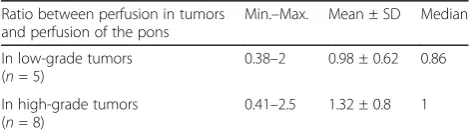
Then we recalculated rCBV in tumors compared to those of the pons in the 13 cases which were pathologic-ally proved. After that, we compared signal drop ratio between low and higher grade lesions. We observed more signal intensity drop in high-grade tumors than low-grade ones. But we found it statistically insignificant (Table2).
Non-neoplastic lesions
Perfusion was done in 25 non-neoplastic lesions. Twenty two cases had focal “non-diffuse” lesion; so we compared rCBV to the normal cord. Eighteen of these 22 patients were either isoperfused or hypoperfused. Only four cases with myelitis were hyperperfused (rCBV = 1.5, 1.75, 1.8, and 2).
Three cases had diffuse abnormal signals, so we measured the rCBV as compared to the pons. The ra-tio of these lesions to the pons was 0.35, 0.5, and 0.58 in a case with NMO; the second was transverse myelitis and a third case of post irradiation changes, respectively.
Neoplastic versus non-neoplastic lesions
Significant high rCBV ratio was found in neoplastic masses targeting the cord than those of non-neoplastic etiology, which can help in differentiating between both categories (Table3).
The suggested cutoff value (1.38 for rCBV) resulted in a sensitivity of 78% and a specificity of 83%. Area under curve for rCBV was high (0.845). That was statistically significant (pvalue 0.003).
Discussion
After extended review of the literatures, publications re-garding cord by MR in vivo in humans are scarce, prin-cipally on account of the technical difficulties.
The difficulties for MR perfusion in the cervical/cervi-comedullary region include the intrinsic susceptibility artifacts as well as motion swallowing artifacts, CSF pul-sation, and partial volume impacts [15].
In our study, a significant high perfusion values (rCBV) of the intramedullary tumors than in non-neoplastic le-sions was found. The rCBV mean for neoplasms was 2 when compared to the normal cervical cord above or below the lesion, this value is fundamentally higher than the non-neoplastic category where their mean value of rCBV was 1 (p= 0.003).
This is similar to an earlier research of brain lesions that revealed increased rCBV ratio in cerebral gliomas than in demyelinating lesions [16] and matching with the observation listed by Xiang et al. [15] using a perfu-sion imaging to differentiate intramedullary cervical neo-plasm from tumor-like masses [15].
In a publication by Liu et al. [17], for glioblastoma di-agnosed by autopsy from upper cervical spinal cord, they observed an increase in rCBV which suggested a high-grade glioma.
Absence of frank angiogenesis and hypoperfusion sequel to diminished metabolism in the non-neoplastic lesions, explained the difference in tissue perfusion in malignant lesions and inflammatory pro-cesses [15].
We noticed that three of our cases with myelitis were slightly hyperperfused; this was similar to an observation noted in a study done by R Hourani et al. [18] who eval-uated the value of perfusion MR in characterizing neo-plasms from other brain issues. He reported a mean rCBV value in two cases with demyelinating lesions to be 1.3 + 0.49. This could be explained by the transient hyperemia occurring in the acute phase of myelitis. A cutoff value equal to or higher than 1.38 of rCBV com-pared to the normal cord had 78% sensitivity and 83% specificity to distinguish neoplastic from the non-neoplastic process.
Calculation of the rCBV ratio is the hardest point, which is an important imaging index in brain perfusion studies. In the brain, the rCBV ratio is calculated by div-iding CBV values of a lesion by the CBV value of normal-appearing brain at the other side.
This prerequisite, however, may be non-applicable in diffuse infiltrating lesions that can affect most of the cord/medulla with subsequent erroneous ratio measure-ments [15].
There are controversies in the acquisition plane selec-tion. Traditionally, axial orientation is frequently used for brain perfusion acquisitions, and ROI is placed in the parenchyma of the unaffected cerebral hemisphere for rCBV and ratio calculations.
(See figure on previous page.)
Fig. 3Sixty-year-old male patient presented by recurrent neck pain, bilateral upper limb numbness, and weakness a year after surgical resection of astrocytoma and post operative radiotherapy.aSagittal T1 post contrast showing irregular enhancing intramedullary lesion at CV2 till CV4 at the surgical bed.bandcrCBV shows hyperperfusion of the lesion (arrow to red curve) relative to the normal lower cervical cord (green curve). Proved by biopsy to recurrent anaplasic astrocytoma
However, cervical intramedullary masses may affect multiple segments and also involve the medulla/cord on both sides. Thus, the axial scanning will not assess the
entire lesion, with the reference ROI being placed in an adjacent, perilesion part that will not exclude an under-estimation of pathologic changes [19].
Fig. 5Demonstration of how post processing assessment method was done by dedicated software. Perfusion mean curves were created by placement of the ROI on sagittal perfusion source (a) to create time intensity curves (b).
We selected the sagittal acquisition in our cases to bypass this problem. We assessed the rCBV relative to the pons in four cases with tumors, where the le-sions were involving the whole cervical cord. In our study, the average range of normal cervical cord/pons ratio calculated in 30 cases was about 0.3. After measuring the rCBV in these four cases, the resulting ratio was ranging from 0.7 to 2.5, suggesting hyper-perfusion of these lesions. The rCBV to the pons was calculated in three cases with tumor-like demyelinat-ing lesions. The ratios were 0.35, 0.5, and 0.583 in a case with NMO, a case with transverse myelitis, and a third case of post irradiation changes respectively.
This was matching with the recommendations of Liu et al. [17]; they suggested that the sagittal acquisition may be a helpful approach for perfusion acquisition in cervical cord assessment as it can evaluate the entire le-sion and the likelihood of utilizing the cerebellum for the placement of the reference ROI [15].
Conclusion
Dynamic MR perfusion is a new hopeful method in as-sessment of lesions within cervical cord that can help in the differentiation between cervical neoplasm and the
tumor-like lesions. Although there was a difference in signal drop during dynamic perfusion between high-grade neoplasms and low-high-grade ones, it was statistically insignificant.
Abbreviations
DSC-MRI:Dynamic susceptibility contrast-magnetic resonance imaging; IATM: Idiopathic transverse myelitis; NMO: Neuromyelitis optica; PI: Perfusion imaging; rCBV: Relative cord\cerebral blood volume
Acknowledgments
Not Applicable
Authors’contributions
ME carried out cases on workstation and selection of research cases, prepared the figures for case demonstration, and was involved in the writing and review of the research. MI put the idea and took part in the selection of cases, figure preparation, and follow-up of cases. NA took part in the selection of cases and wiring the cases. All authors read and approved the final manuscript.
Funding
This study had no funding from any resource.
Availability of data and materials
The datasets used and/or analyzed during the current study are available from the corresponding author on reasonable request.
Ethics approval and consent to participate
All procedures followed were in accordance with the ethical standards of the responsible committee on human experimentation, the Institutional Review Board (IRB) of Alexandria General Hospital on 14th February 2017 and with the Helsinki Declaration of 1964 and later versions. The committee's reference number is unavailable (not applicable). No consent was obtained from the patients since it was a retrospective study.
Consent for publication
All patients included in this research gave written informed consent to publish the data contained within this study.
Competing interests
The authors declare that they have no competing interests.
Author details
1Radiology Department, National Liver Institute, Menoufia University, Shebin
El Kom, Egypt.2Radiology Department, Alexandria Faculty of Medicine, Alexandria University, Alexandria, Egypt.
Received: 26 November 2019 Accepted: 28 November 2019
References
1. Brandão LA, Shiroishi MS, Law M (2013) Multimodality approach with diffusion-weighted imaging, diffusion tensor imaging, magnetic resonance spectroscopy, dynamic susceptibility contrast and dynamic contrast enhanced magnetic resonance imaging. Mag Reson Imaging Clin N Am 21: 199–239
Table 3Comparison between neoplastic and non-neoplastic groups according to rCBV compared to normal cord
Non-neoplastic (n= 22)
Neoplastic (n= 9)
Z p
rCBV
Min.–Max. 0.17–2 0.54–4.5 3.022* 0.003*
Mean ± SD 1.01 ± 0.62 2 ± 1.13
Median 1.0 2
Z Zvalue for Mann Whitney test * Statistically significant atp≤0.05
Table 2Mean values (mean ± SD) and statistical results of regional cord blood volume in tumors and the pons.
Ratio between perfusion in tumors and perfusion of the pons
Min.–Max. Mean ± SD Median
In low-grade tumors (n= 5)
0.38–2 0.98 ± 0.62 0.86
In high-grade tumors (n= 8)
0.41–2.5 1.32 ± 0.8 1
Zvalue for Mann Whitney test, 0.456;pvalue, 0.322 Statistically significant
atp≤0.05
Table 1Distribution of the studied cases according to final diagnosis and histopathology (n= 38)
Pathology No. of patients (n= 38) Percentage (%)
Non-neoplastic 25 65.79
Myelitis 12 31.57
MS 9 23.68
Post irradiation 4 10.54
Neoplastic 13 34.21
Ependymoma 5 13.16
Fibrillary astrocytoma 2 5.26
Anaplastic astrocytoma 3 7.89
GBM 2 5.26
2. Essig MSM, Nguyen TB (2013) Perfusion MRI: the five mostly asked questions. AJR 200:919–930
3. Paulson ESSK (2008) Comparison of susceptibility weighted contrast enhanced MR methods: recommendations of measuring relative cerebral blood volume in brain tumors. Radiology 249:601–613
4. Fanous Andrew A, Olszewski Nathan P et al (2016) Idiopathic transverse myelitis mimicking an intramedullary spinal cord tumor. Case Reports Pathol:1–8
5. Sun B, Wang C, Wang J, Liu A (2003) MRI features of intramedullary spinal cord ependymomas. J Neuroimaging 13:346–351
6. Baleriaux DL (1999) Spinal cord tumors. Eur Radiol 9:1252–1258
7. Lowe GM (2000) Magnetic resonance imaging of intramedullary spinal cord tumors. J Neurooncol 47:195–210
8. Miyazawa N, Hida K, Iwasaki Y, Koyanagi I, Abe H (2000) MRI at 1.5 T of intramedullary ependymoma and classification of pattern of contrast enhancement. Neuroradiology 42:828–832
9. Baker KB, Moran CJ, Wippold FJ 2nd, Smirniotopoulos JG, Rodriguez FJ, Meyers SP et al (2000) MR imaging of spinal hemangioblastoma. AJR Am J Roentgenol 174:377–382
10. Reddy P, Sathyanarayana S, Acharya R, Nanda A (2003) Intramedullary spinal cord metastases: case report and review of literature. J La State Med Soc 155:44–45
11. Tench CR, Morgan PS, Jaspan T, Auer DP, Constantinescu CS (2005) Spinal cord imaging in multiple sclerosis. J Neuroimaging 15:94S–102S 12. Choi KH, Lee KS, Chung SO et al (1996) Idiopathic transverse myelitis: MR
characteristics. AJNR 17:1151–1160
13. Filippi M, Rocca MA (2004) MR imaging of Devic’s neuromyelitis optica. Neurol Sci 25:S371–S373
14. Michikawa M, Wada Y, Sano M, Uchihara T, Furukawa T, Shibuya H et al (1991) Radiation myelopathy: significance of gadolinium-DTPA enhancement in the diagnosis. Neuroradiology 33:286–289
15. Liu X, Tian W, Kolar B, Hu R, Huang Y, Huang J et al (2014) Advanced MR diffusion tensor imaging and perfusion weighted imaging of intramedullary tumors and tumor like lesions in the cervicomedullary junction region and the cervical spinal cord. J neurooncol 116:559–566
16. Cha S, Pierce S, Knopp EA, Johnson G, Yang C, Ton A et al (2001) Dynamic contrast-enhanced T2*-weighted MR imaging of tumefactive demyelinating lesions. Am J Neuroradiol 22:1109–1116
17. Liu X, Germin BI, Ekholm S (2011) A case of cervical spinal cord
glioblastoma diagnosed with MR diffusion tensor and perfusion imaging. J Neuroimaging 21:292–296
18. Hourani R, Brant LJ, Rizk T, Weingart JD, Barker PB, Horská A (2008) Can proton MR spectroscopic and perfusion imaging differentiate between neoplastic and non-neoplastic brain lesions in adults? AJNR Am J Neuroradiol 29(2):366–372
19. Alexander AL, Lee JE, Wu YC, Field AS (2006) Comparison of diffusion tensor imaging measurements at 3.0 T versus 1.5 T with and without parallel imaging. Neuroimaging Clin N Am 16:299–309
Publisher’s Note
Springer Nature remains neutral with regard to jurisdictional claims in published maps and institutional affiliations.