www.adv-radio-sci.net/13/95/2015/ doi:10.5194/ars-13-95-2015
© Author(s) 2015. CC Attribution 3.0 License.
Potential of dynamic spectrum allocation in LTE macro networks
H. Hoffmann1, P. Ramachandra2, I. Z. Kovács3, L. Jorguseski4, F. Gunnarsson2, and T. Kürner1 1Deparmtent of Telecommunication Engineering, TU Braunschweig, Braunschweig, Germany 2Ericsson Research, Linköping, Sweden
3Nokia, Aalborg, Denmark 4TNO, Delft, the Netherlands
Correspondence to: H. Hoffmann ([email protected])
Received: 12 December 2014 – Revised: 13 April 2015 – Accepted: 4 May 2015 – Published: 3 November 2015
Abstract. In recent years Mobile Network Operators (MNOs) worldwide are extensively deploying LTE networks in different spectrum bands and utilising different bandwidth configurations. Initially, the deployment is coverage oriented with macro cells using the lower LTE spectrum bands. As the offered traffic (i.e. the requested traffic from the users) increases the LTE deployment evolves with macro cells ex-panded with additional capacity boosting LTE carriers in higher frequency bands complemented with micro or small cells in traffic hotspot areas. For MNOs it is crucial to use the LTE spectrum assets, as well as the installed network infrastructure, in the most cost efficient way. The dynamic spectrum allocation (DSA) aims at (de)activating the avail-able LTE frequency carriers according to the temporal and spatial traffic variations in order to increase the overall LTE system performance in terms of total network capacity by reducing the interference. This paper evaluates the DSA po-tential of achieving the envisaged performance improvement and identifying in which system and traffic conditions the DSA should be deployed. A self-optimised network (SON) DSA algorithm is also proposed and evaluated. The evalua-tions have been carried out in a hexagonal and a realistic site-specific urban macro layout assuming a central traffic hotspot area surrounded with an area of lower traffic with a total size of approximately 8×8 km2. The results show that up to 47 % and up to 40 % possible DSA gains are achievable with re-gards to the carried system load (i.e. used resources) for ho-mogenous traffic distribution with hexagonal layout and for realistic site-specific urban macro layout, respectively. The SON DSA algorithm evaluation in a realistic site-specific ur-ban macro cell deployment scenario including realistic non-uniform spatial traffic distribution shows insignificant cell throughput (i.e. served traffic) performance gains.
Neverthe-less, in the SON DSA investigations, a gain of up to 25 % has been observed when analysing the resource utilisation in the non-hotspot cells.
1 Introduction 1.1 Motivation
The fast growing demand of mobile broadband services force mobile network operators (MNOs) to evolve their LTE net-works from coverage oriented deployments towards capacity oriented deployment utilising macro cells with multiple LTE frequency carriers (at different LTE bands) complemented with small cells (micro, pico or femto cells) deployment in traffic hotspot areas. The network dimensioning is usu-ally performed based on the estimated load in typical busy hour conditions. Therefore, although the deployed carriers are well utilised during peak hours, e.g. day time in univer-sity campus or offices, they become underutilised for the rest of the time, e.g. night time. At the same time the traffic de-mand may intensify in other areas of the network, e.g. in res-idential areas in the evening, located outside the busy hour high traffic areas. By means of Dynamic Spectrum Alloca-tion (DSA) the available spectrum resources (LTE carriers) will be allocated according to the spatial and temporal traffic requirements by (autonomously) assigning spectrum to base stations based on the estimated large-scale temporal and spa-tial offered load (i.e. estimated amount of resources).
mechanisms is the (semi-)dynamic assignment of the avail-able resources (time, frequency and/or power) between LTE macro and small-cell layers operating on the same carrier fre-quency.
The objective of our study is to identify the conditions un-der which a DSA mechanism could be utilised in an LTE macro network deployment in a typical European dense ur-ban area.
1.2 DSA in the academia
A good overview of DSA approaches can be found in Akyildiz et al. (2006). The studies in Leaves et al. (2001, 2002, 2004) focus on spatial and temporal DSA in a multi-radio network consisting of a UMTS and Digital Video Broadcasting-Terrestrial (DVB-T) system. A pre-requisite for the application of temporal DSA is load prediction. Sim-ulation results for perfect and imperfect load prediction are presented showing that DSA has 30 % higher spectrum ef-ficiency compared to fixed channel assignment. The study in Rodriguez et al. (2006) extends the DSA concept with spectrum bidding among different cells from the partici-pating DVB-T and UMTS systems. Further, Kovács and Vidács (2006) and Kovács et al. (2007) propose a spatial and temporal DSA, where the temporal DSA is coordinated by so called Regional Spectrum Brokers (RSB). The RSB consid-ers interference by geographical and radio technology cou-pling parameters and solves the spectrum assignment prob-lem using integer linear programming approach. The simu-lation results in Kovács et al. (2007) show that the combined RSB and linear programming optimisation approach achieve gains (e.g. 26 %) in terms of used resources over fixed spec-trum assignment.
In Madan et al. (2011) a heuristic distributed algorithm is evaluated for dynamic sub-band partitioning and user associ-ations complemented by transmit power control for LTE het-erogeneous networks (macro overlaps with pico, femto and relay nodes). The heuristic algorithm uses light-weight coor-dination signalling messages between neighbouring (or over-lapping) cells and provides significant throughput and delay gains over frequency re-use one.
1.3 Standardisation and deployment status
The related work on DSA within 3GPP can be divided into energy saving via switching on/off cells 3GPP TR36.887 (2014), 3GPP TR36.927 (2014) and inter-cell interference coordination (ICIC). The ICIC activities in 3GPP have started already in Release 8. In particular, for heterogeneous network scenarios the focus has been on the carrier based ICIC (CB-ICIC) for Release 10–11 that addressed scenarios for operational carrier selection, and downlink or uplink in-terference management for macro-pico as described in Qual-comm Inc. (2011) and 3GPP Overview (2013). Additionally, Release 12 also addresses the signalling needed for robust
solutions for Release-10/11 UEs supporting carrier aggrega-tion, and focus on solutions which do not require tight syn-chronisation between eNodeBs.
Today’s MNOs operating GSM networks in 900 MHz band (for coverage) and in 1800 MHz band (for capacity) de-ploy DSA to dynamically switch ON and OFF the 1800 MHz capacity cells according to the traffic demand for energy sav-ing purposes, see e.g. Nokia Siemens Networks (2010). The control algorithm monitors the GSM traffic level and con-trols the activation of 1800 MHz capacity layer by switching off the capacity cells when and where the traffic drops below certain pre-defined thresholds (usually at night hours). If the 1800 MHz capacity layer is already deactivated the algorithm continues to monitor the traffic level and if needed activates back the 1800 MHz capacity cells. Another practical exam-ple related to the DSA concept is trialled for wireless cellular communications in the public safety domain. The US public safety market is evolving rapidly with the combined intro-duction of public and private LTE networks. These networks have available spectrum that is often unused. Therefore, a dynamic spectrum arbitrage solution is trialled RadiSys Cor-poration (2013) that allows unused spectrum to be easily re-allocated across networks to where it is needed most by com-bining prioritisation of users on the network with a real-time auctioning process.
1.4 Scope of the study
This study investigates the potential gain from DSA for a LTE macro-cellular network covering a geographical area with non-uniform spatial traffic distribution. The remaining of the paper is organised as follows. The system modelling approach and traffic assumptions are illustrated in Sect. 2. The potential DSA performance gains for a homogeneous traffic spatial distribution with hexagonal cell layout as well as with a site-specific urban cell deployment are presented in Sect. 3. Then, Sect. 4 presents the evaluation of the self-optimised DSA algorithm in the site-specific urban deploy-ment scenario. The paper is finalised with the conclusions and recommendations in Sect. 5.
2 System modelling for DSA analysis
1 1.5 2 2.5 3 3.5 4 4.5 5 1
1.5 2 2.5 3 3.5 4 4.5 5
km
km
1 2 3 4 5 6 7 8
1 2 3 4 5 6 7 8
km
km
(a)
(b)
Figure 1. Cell layout (best server areas) with hotspot (red) and its surrounding cells (blue): (a) hexagonal layout scenario; (b) site-specific
layout scenario (Hanover). The white square markers indicate the location of the macro sites.
Table 1. Macro network simulation parameters.
Hexagonal cell layout Site-specific cell layout
(3GPP model) (Hanover urban network)
Inter-site distance 1000 m 960 m (average)
Pixel size 10 m×10 m 10 m×10 m
Scenario area 4 km×4 km 8 km×8 km
Macro transmit power 46 dBm per cell 46 dBm per cell
Propagation model 3GPP TS 25.184 Ray-tracing based path loss
Traffic model Uniform traffic intensity map Spatially non-uniform distribution
within each cell; separate within and across cells; separate
scaling for the hotspot cell scaling for the hotspot cell
Considered Cells for SINR computation 20 strongest interfering cells 20 strongest interfering cells
Cell selection Best signal server Best signal server
similar to the one in the site-specific network layout in the considered area.
The requested traffic from the users in the network will be referred to as the offered traffic (to the network) in the follow-ing. The offered traffic levels in the hotspot cell and the sur-rounding cells are varied according to spatial traffic intensity maps that are scaled differently within the hotspot cell and the surrounding cells in order to generate different load ratios and interference situations to the area served by the hotspot cell. The traffic intensity maps are assumed to contain the av-erage offered traffic in a certain time interval (e.g. 1 h). Thus, there is no scheduling modelled explicitly and a time aver-aged resource allocation is simulated as explained in the fol-lowing section. The main simulation parameters used in the evaluation of the DSA mechanisms are given in Table 1. 2.1 DSA configurations
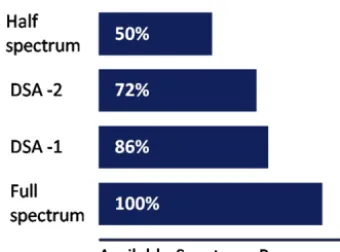
In order to evaluate the potential DSA gains four different spectrum allocation strategies are investigated for the cells
Figure 2. Resource level DSA method used in simulations.
2.2 Traffic and resource allocation
Serving cell selection is based on the best signal strength cell for each pixel of a predicted Reference Symbol Received Power (RSRP) map. A pixel is a square portion of the cov-ered area characterized with its position and pixel area size, which is typically 10×10 m2. The predicted RSRP map is a collection (or union) of all the pixels in the area under in-vestigation where each pixel is associated with a predicted RSRP transmitted from a given LTE cell.
The amount of bandwidth (BWpj)required to serve the
offered traffic (OfferedTrafficpj)in a pixel pj is dependent
on the SINR experienced by the pixel (SINRpj)and is given
by:
BWpj=
0 SINRp1<SINRmin, OfferedTrafficpj
0.6·log2(1+SINRmax)
SINRp1≥SINRmax, OfferedTrafficpj
0.6·log2 1+SINRpj
otherwise,
(1) where SINRmin= −6.5 dB and SINRmax=22.05 dB. These boundary SINR values model the cases where no transmis-sion is possible or the highest modulation and coding scheme might be used, respectively. Note that the approach in this study uses average SINR values i.e. neglecting fast SINR variations over (multiple) 1 ms/TTI periods. The total band-width required to serve all the pixels in the cell’s coverage area is the sum of bandwidth requirements of each pixel (Eq. 1) in the coverage area and is given by
Total required bandwidth for a cellk= X j∈cellk
BWpj. (2)
Based on this value the CellLoadkis modelled as:
CellLoadk=
Total required bandwidth for a cellk
Available bandwidth of a cellk
, (3)
which is capped at 1 (100 %) for interference computation. It can also be seen as the used resources of a cell. If the
to-tal required bandwidth in a cell is larger than the available bandwidth, then not all the offered traffic can be served, i.e.: Throughputk=OfferedTraffick·min
1, 1
CellLoadk
. (4)
3 Evaluation of the potential DSA gains
The evaluation in this section aims at quantifying the poten-tial DSA gain in terms of total system carried traffic that can be served in the considered cells for the different DSA con-figurations described in Sect. 2.2.
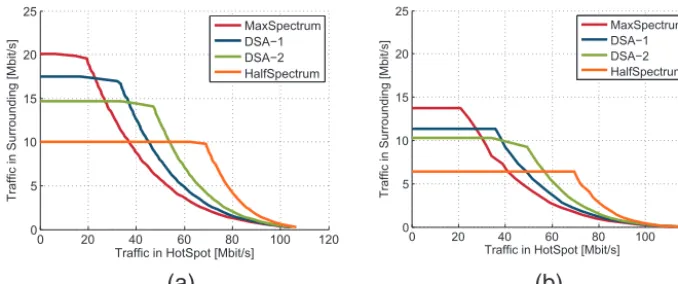
The offered traffic in the surrounding cells and in the hotspot cell is varied in discrete steps for each of the DSA configurations listed in Fig. 2. The different load situations in the surrounding cells and the hotspot cell cause differ-ent interference situations, and hence differdiffer-ent system per-formance. The carried traffic levels in the hotspot cell and the surrounding cells (given in traffic per cell) for the differ-ent DSA configurations are illustrated in Fig. 3. The curves present upper limits for the offered traffic such that all of the surrounding cells and the hotspot cell are loaded lower than the maximum cell load threshold of 100 %. Consequently, the offered traffic equals the carried/served traffic in the system. The left most values of the curves represent the maximum traffic that can be served in average in each of the surround-ing cells with no or low load (and consequently no or low interference) from the hotspot cell. Note that the traffic in the surrounding cells for the hexagonal cell layout (see Fig. 3a) reaches a maximum of 20, 17, 14 and 10 Mbps per cell for the Full Spectrum, DSA-1, DSA-2, and Half Spectrum DSA configurations, respectively. Note that these maximum traffic values scale with the amount of spectrum available in the sur-rounding cells. Correspondingly, for the site-specific deploy-ment scenario (see Fig. 3b) the traffic in the surrounding cells reaches a maximum at 14, 12, 10, and 6 Mbps per cell. The lower values when compared to the hexagonal cell layout are due to the larger and irregular coverage areas resulting in also different interference conditions. As the offered traffic in the hotspot cell increases, the hotspot cell will cause more inter-ference to the surrounding cells. Consequently, the increase in interference from the hotspot cell will cause the surround-ing cells to get overloaded earlier, and their maximum car-ried traffic will gradually start to decrease. When the hotspot cell traffic crosses a threshold, the hotspot cell itself becomes overloaded and needs help from the surrounding cells to en-sure that all the offered traffic is served. This help from the surrounding cells is in terms of reduction in their utilized spectrum so that they interfere less to the hotspot cell.
0 20 40 60 80 100 120 0
5 10 15 20 25
Traffic in HotSpot [Mbit/s]
Traffic in Surrounding [Mbit/s]
MaxSpectrum DSA−1 DSA−2 HalfSpectrum
0 20 40 60 80 100 120
0 5 10 15 20 25
Traffic in HotSpot [Mbit/s]
Traffic in Surrounding [Mbit/s]
MaxSpectrum
DSA−1 DSA−2
HalfSpectrum
(a)
(b)
Figure 3. Served traffic in hotspot and the surrounding cells without cell overloading for different DSA configurations: (a) hexagonal layout
scenario; (b) site-specific layout scenario (Hanover).
0 0.2 0.4 0.6 0.8 1
−0.8 −0.6 −0.4 −0.2
0 0.2 0.4 0.6
Traffic Ratio Sur (subset) / HS (Averaged Traffic per km²)
Gain in total served traffic
DSA−1 DSA−2
HalfSpectrum
0 0.2 0.4 0.6 0.8
−0.8 −0.6 −0.4 −0.2
0 0.2 0.4 0.6
Traffic Ratio Sur (subset) / HS (Averaged Traffic per km²)
Gain in total served traffic
DSA−1 DSA−2
HalfSpectrum
(a)
(b)
Figure 4. Gain relative to Full Spectrum in total carried system traffic for different ratios of surrounding (SUR) vs. hotspot (HS) traffic: (a) hexagonal layout scenario; (b) site-specific layout scenario (Hanover).
1. For the hexagonal layout (see Fig. 4a) up to 47 % gain in terms of total served traffic can be achieved and the gain is visible in the traffic ratio range up to 0.6. Furthermore, the optimal DSA configuration depends on the traffic ra-tio between the surrounding cells and the hotspot cell. For traffic ratios up to 0.2 the Half Spectrum DSA con-figuration is best while for the range of traffic ratios be-tween 0.2 and 0.4 the DSA-2 is outperforming the other DSA configurations. For ratios higher than 0.4 DSA-1 configuration has the highest gain. An algorithm to allo-cate spectrum to cells dynamically would therefore take this ratio into account, as illustrated in Sect. 4.
2. For the site-specific urban macro deployment (see Fig. 4b) up to 40 % gain in terms of total served traffic can be achieved and the gain is visible in the traffic ratio range up to 0.16, which is significantly narrower range when compared to the hexagonal cell layout. Again, this is because of the larger and irregular cell area coverage creating different interference conditions.
4 DSA evaluation for realistic layout and self-organised DSA algorithm
Opposite to the uniform spatial traffic distributions used in Sect. 3, in the investigation of the realistic and self-organised DSA algorithm the offered traffic is based on scaled realis-tic traffic intensity maps for a selected time interval between 8:00 and 18:00 h, as explained in Deliverable 4.1 from SE-MAFOUR D4.2 (2013). As the traffic intensity maps do not contain defined hotspots, a time-varying hotspot (per hour) is added to each of the hourly maps. For example, in the time interval between 11:00 and 15:00 h the traffic offered to the hotspot cell is approximately two times higher than the av-eraged offered traffic to its surrounding cells. The hotspot is placed in the coverage area of only one macro cell, as illus-trated in Fig. 1b.
acti-Figure 5. Self-optimised DSA algorithm flow chart.
vated in any cell and is triggered by a high load condition, as explained below. It is assumed that each cell has a pre-configured Cluster of interfering cells. In this study the top 20 interfering cells (surrounding the hotspot cell) are consid-ered for the cluster.
The different load thresholds used in the flow chart in Fig. 5 can be explained from a cell and from the correspond-ing cluster neighbour perspective, as follows:
1. Load_Threshold_Activation: It is the load level in the cell above which the cell either requests for higher band-width configurations or requests its cluster neighbours to reduce their spectrum (not guaranteed of reduction yet as the actual reduction depends on the load levels in the neighbours).
2. Load_Threshold_Activation – Load_Margin:
a. From a cell perspective: When the load in the cell goes below this threshold, the cell allows its cluster neighbours to enable higher bandwidth configura-tions.
b. From the cluster cells’ perspective: When the max-imum load among the cell in the defined cluster neighbours goes below this threshold, they will
ac-cept any request for further reduction in their band-width configurations.
The SON-enabled DSA algorithm evaluates every 20 min (i.e. three times per hour) the loads per cell and takes actions as defined in the flow chart in Figure 5. The values for the Load_Threshold_Activation and Load_Margin are set to 0.7 and 0.15, respectively. In practice these parameters would be part of the overall DSA configuration in the network, and would be set by the MNO depending on the expected traffic variations, available spectrum, etc.
The performance results for the SON-enabled DSA algo-rithm are presented in Fig. 6. In the investigation the centre hotspot cell is always using 20 MHz (full) spectrum. As it can be observed the DSA algorithm is triggered between 11:00 and 15:00 h, when the load in the hotspot cell increases above 0.7. The DSA algorithm then reduces the spectrum of the sur-rounding (top 20) cluster cells as long as the maximum load among the cells is below Load_Threshold_Activation=0.7.
Figure 6. Performance of the self-optimised DSA algorithm in the
site-specific layout scenario.
1. The non-uniform traffic intensity per pixel based on the realistic traffic intensity maps does not allow for very asymmetric traffic ratios between the hotspot cell and its corresponding cluster. Note that the high poten-tial DSA gains for the site-specific deployment scenario (see Fig. 4b) were observed only in the traffic ratio range below 0.16.
2. The SON enabled DSA algorithm cannot reduce the spectrum of the surrounding cluster cells down to half-spectrum configuration i.e. only DSA-1 and DSA-2 configurations are used, due to the relatively high traffic demand in the surrounding (top 20) cluster cells. 3. The non-uniform cell coverage areas i.e., largely
differ-ent cell sizes when compared to the hexagonal layout, result in significantly different interference and cell load conditions when compared to the regular hexagonal lay-out.
In addition to the cluster throughput the corresponding (spectrum) resource utilisation is also plotted in Fig. 6. It can clearly be seen that the activation of the SON DSA algorithm achieves approximately the same cluster throughput while using significantly less resources. At the maximum (at 12 o’clock) there are 25 % more resources used without DSA. These resource savings directly relate to the optimised inter-ference situation in the network. Due to the restricted spec-trum use in some of the cells pixels assigned to the remain-ing cells experience a higher SINR and thus require fewer resources.
5 Conclusions
This study investigated the potential performance gain from using dynamic spectrum allocation (DSA) in an LTE macro-cellular network. The DSA evaluation has been carried out in a hexagonal cell layout with uniform spatial traffic dis-tribution, as well as in a realistic site-specific cell deploy-ment with non-uniform spatial traffic distribution scenar-ios. The centre cell was assumed to be a high traffic cell
(hotspot) and always to utilise the total available spectrum of 20 MHz while the spectrum allocation in surrounding cells was varied. Four different spectrum allocation strate-gies were used: Full Spectrum (20 MHz), DSA-1 (17.2 MHz), DSA-2 (14.4 MHz) and Half Spectrum DSA (10 MHz).
The results show that DSA can provide significant gains only in spatially highly non-uniform traffic distributions. Un-der highly asymmetric traffic ratio between the surrounding cells and the hotspot cell, 0.5 or 0.16 for the hexagonal or realistic scenario, respectively, DSA gains up to 47 % can be achieved. However, the same network configuration also lead to losses of about 50 % when insufficient spectrum is allocated to the surrounding cells.
In the site-specific cell deployment the self-optimised DSA algorithm did not provide significant gain in the overall cell cluster throughput. This is because in the realistic net-work deployments the required highly asymmetric traffic be-tween the hotspot and surrounding cells, when the full poten-tial of DSA could be exploited, are difficult to achieve.
However, even though there is hardly any gain in cluster or cell throughput for the realistic network deployments, there is a significant gain of up to 25 % in terms of resource utili-sation. The free resources can be used for two purposes de-pending on the operator’s policies. They can either be used for energy saving purposes, e.g. carriers can be switched off if a sufficient number of resources is unused or these free re-sources can be used as input for Multi-RAT DSA algorithms, i.e. they can be re-assigned to other RATs for capacity opti-misation.
As a follow-up of this study the DSA gains for inter-RAT scenarios will be investigated for the case of LTE macro cells deployed in the same area with GSM macro cells. It is ex-pected that DSA will be beneficial in dynamically re-farming parts of the allocated GSM spectrum as allowed by the on-going GSM traffic and acceptable level of interference from the LTE cells re-using the same spectrum.
Acknowledgements. The research leading to these results has been
carried out within the FP7 SEMAFOUR project and has received funding from the European Union Seventh Framework Programme (FP7/2007-2013) under grant agreement no. 316384.
Edited by: J. Anders
References
Akyildiz, I. F., Lee, W. Y., Vuran, M. C., and Mohanty, S.: NeXt generation/dynamic spectrum access/cognitive radio wire-less networks: a survey, Comput. Netw., 50, 2127–2159, 2006. Kovács, L. and Vidács, A.: Spatio-temporal spectrum management
model for dynamic spectrum access networks, in: Proceedings of the first international workshop on Technology and Policy for Accessing Spectrum (TAPAS 2006), ACM, New York, NY, USA, 5 August, 2006.
Kovács, L., Vidács, A., and Tapolcai, J.: Spatio-Temporal Dynamic Spectrum Allocation with Interference Handling, IEEE Conf. Comm., Glasgow, UK, 24–28 June 2007, 5575–5580, 2007. Laselva, D.,Altman, Z., Balan, I., Bergström, A., Djapic, R.,
Hoff-mann, H., Jorguseski, L., Kovács, I. Z., Michaelsen, P. H., Naudts, D., Ramachandra, P., Sartori, C., Sas, B., Spaey, K., Trichias, K., and Wang, Y.: SON functions for multi-layer LTE and multi-RAT networks (first results), INFSO-ICT-316384 SE-MAFOUR, Report, 141 pp., 2013.
Leaves, P., Ghaheri-Niri, S., Tafazolli, R., Christodoulides, L., Sam-mut, T., Staht, W., and Huschke, J.: Dynamic spectrum alloca-tion in a multi-radio environment: concept and algorithm, 2nd International Conference on 3G Mobile Communication Tech-nologies, London, UK, 26–28 March 2001, Conf. Publ. No. 477, 53–57, 2001.
Leaves, P., Huschke, J., and Tafazolli, R.: A summary of dynamic spectrum allocation results from DRiVE, IST Mobile and Wire-less Telecommunications Summit, Thessaloniki, Greece, 17–19 June 2002, 245–250, 2002.
Leaves, P., Moessner, K., Tafazolli, R., Grandblaise, D., Bourse, D., Tönjes, R., and Breveglieri, M.: Dynamic spectrum allocation in composite reconfigurable wireless networks, IEEE Commun. Mag., 42, 72–81, 2004.
Madan, R., Borran, J., Sampath, A., Bhushan, N., Khandekar, A., and Tingfang, J.: Cell Association and Interference Coordination in Heterogeneous LTE-A Cellular Networks, IEEE J. Sel. Area Comm., 28, 1479–1489, 2010.
Nokia Siemens Networks: Smart Energy Control cuts CO2
foot-print and saves up to 1.2 GWh of power annually, available at: http://nsn.com/portfolio/customer-successes/success-stories/ smart-energy-control-cuts-co2-footprint-and-saves-up-to (last access: 19 May 2015), 2010.
RadiSys Corporation: Radisys LTE Solutions Enable
Ri-vada Networks’ Technology to Dynamically Allocate Ex-cess Spectrum for Public Safety Networks, available at: http://www.radisys.com/2013/ (last access: 19 May 2015), 2013. Rodriguez, V., Moessner, K. K., and Tafazolli, R.: Market driven dynamic spectrum allocation over space and time among radio-access networks: DVB-T and B3G CDMA with heterogeneous terminals, Mobile Netw. Appl., 11, 847–860, 2006.
Qualcomm Inc.: R3-112609, Carrier-based HetNet ICIC use cases and solutions, The 3rd Generation Partnership Project (3GPP), 2011.