R E S E A R C H A R T I C L E
Open Access
Online zinc reduction-sequential injection
analysis for the determination of nitrogen
species in extracts of riverine sediment
Najeem O. Oladosu
1,2*, Akeem A. Abayomi
2, Xiang Zhang
1, Kehinde O. Olayinka
2, Babajide I. Alo
2and Anping Deng
1Abstract
Background:The substitution of hazardous analytical reagents such as Cd with benign alternatives for chemical determination is one of the principles of green chemistry. An eco-friendly Zn reduction method for nitrate determination was developed to achieve this end.
Methods:Online zinc reduction-sequential injection analysis (ZnR-SIA) protocol was developed for the determination of nitrogen (N) species in the Lagos Lagoon sediments by modification of some standard methods.
Results:The novel application of boric acid-borate buffer employed in borate-buffered granular Zn reduction suppressed gas evolution from the Zn micro-column, making the Zn reduction adaptable to online use, unlike the frequently used ammonia-ammonium buffer. Further results showed that the sampling rate for the two-zone stack was 65 h−1. The boric acid-borate buffer offered 5.9-fold and 1.3-fold of the instrument response given by the ammonia-ammonium buffer at 0.50 and 5.0 mg N L−1respectively. The method detection limits of the ZnR-SIA for the three matrices studied were 24.6μg N L−1for reagent water, 0.383 mg N kg−1for KCl-extractable nitrate, and 3.18 mg N kg−1for total nitrogen. The average recovery of nitrate-N in matrix samples was 94.7%, and its precision was 4.52%. The average recoveries of total N in blanks and matrix samples were 97.9 and 93.2% respectively.
Conclusions:The method accuracies demonstrated the suitability of the ZnR-SIA for sediment N determination. Zn reduction is recommended where sustainable development is desired and is a potential substitute for the standard Cd reduction owing to Cd toxicity.
Keywords:Green chemistry, Sediment nitrogen, Online zinc reduction, Borate buffer, Sequential injection
Background
One of the tenets of green chemistry is the use of sub-stances having little or no toxic effect on human health and the environment (Sanghi et al. 2012). Therefore, the switch from Cd reduction for nitrate determination to Zn reduction will accomplish a green chemical objective (Merino 2009) because the World Health Organization’s maximum admissible concentrations for Cd and Zn in potable water are 0.005 and 5.0 mg L−1, respectively (Olajire and Imeokparia 2000), thus making Zn the more
attractive green option than Cd. And exposure to Zn is three orders of magnitude apparently incapable of causing appreciable harm in relation to Cd. Zn reduc-tor is, therefore, environmentally friendly, and environ-mentally friendly chemical analysis is geared towards achieving sustainable development (Grudpan et al. 2011). Zinc reduction coupled to sequential injection analysis is no doubt a green chemical analytical approach for sustain-able development in view of the reduced reagent input and reduced waste generation. The programmable flow derived from sequential injection analysis (SIA) in the lab-on-valve (LOV) format is a fast-growing technology in chemical process disciplines as micro-SIA-LOV minimizes resource consumption and waste generation much more than flow * Correspondence:[email protected]
1College of Chemistry, Chemical Engineering and Materials Science,
Soochow University, Suzhou 215123, China
2Department of Chemistry, University of Lagos, Akoka, Yaba, P.M.B. 1005,
Lagos, Nigeria
line persulfate oxidation is particularly recommended for marine samples in order to prevent chloride oxi-dation by persulfate, an inherent defect of acid per-sulfate digestion leading to undesirable consumption of potassium persulfate (Worsfold et al. 2005).
A standard route for determination of nitrate is through reduction of nitrate to nitrite by copperized cadmium granules in an alkaline medium. Nitrite in an acid medium is diazotized with sulfanilamide and coupled with N-(1-naphthyl) ethylenediamine dihydrochloride (NINE) to form a red azo dye which is measured spectrophotometrically (Sun et al. 2014; APHA 2005). Tetrasodium salt of ethylenediaminetetraacetic acid (EDTA) is used in the conditioning of cadmium column to increase the column life by preventing the formation and coating of Cd (OH)2. The EDTA also prevents the
surface coating of cadmium by iron, copper, and other metals in environmental samples by keeping the metals in solution (APHA 2005). Zinc had been used for ni-trate reduction to nitrite, but the method was not widely adopted (Ellis et al. 2011; Mir 2007). Devarda’s alloy and granular zinc have been used to reduce nitrate to ammonia for eventual detection of ammonia through physical methods. In the two methods, nitrate is obtained as the difference between a sample run with reduction step and another sample run without the re-duction step so as to account for the ammonium originally present in the sample (Ellis et al. 2011), and both methods become more cumbersome and time consuming when ammonium levels in samples are high relative to nitrate in view of the preliminary ammonia removal required to avoid interference, though the ammonia detection of their methods use a few reagents making them simple and economical.
Published SIA and other flow-based studies for nitrate determination are not as widely reported as for phos-phate and are always reported for water matrix, e.g., Patton and Kryskalla (2003) and APHA (2005), and where metal reductor is used, it is always Cd reduction in ammonia-ammonium buffer, e.g., Morales et al. (2001) and APHA (2005). Reagent concentrations and time for the Griess-Illosvay reaction were optimized in
were supplied by Sinopharm (China) and Sigma-Aldrich (China). Reference compounds for recovery studies were supplied by Aladdin (China), while HCl (35–38%) and NH3(25–28%) were supplied by Enox (China). Granular
zinc was procured from Xin Hua (China), while granular cadmium was procured from Sinopharm. FIAlab-3500 (USA) was the micro-SIA-LOV used for this study, and the spectrometer was Ocean Optics USB 2000 (USA) with a halogen light source (HL-2000). The light source was connected to the spectrometer through two fiber optics which were separated by a 7-mm path length to form the flowcell. The FIAlab included an inbuilt four-channel two-way peristaltic pump, and all tubings were Upchurch products (Germany).
Procedure for online nitrate reduction
Zn granules (20–30 mesh) were washed with 3.0 M HCl and copperized with 2.0% CuSO4·5H2O before loading
the homemade glass micro-column. The column
(3.0 mm i.d.) was loaded with 3.0 g of Zn to produce a 4-cm length. One milliliter of boric acid-borate buffer (pH 8.1) composed of 73.4 mM borax, 452.9 mM boric
acid, and 1.1 mM Na2EDTA was added to 4 mL of
sample. The buffer pH was adjusted with 0.3 M NaOH during its preparation. According to the SIA script implemented in the optimized manifold shown in Fig. 1a, nitrate reduction occurred as buffered sample was propelled through the micro-column for 25 s by a peri-staltic pump revolving at 50% speed. For Cd reduction-sequential injection analysis (CdR-SIA), a Cd column was prepared exactly as the Zn column but 2.0 g of 40–60 mesh granules was used, and 1 mL of ammonia-ammonium buffer (pH 8.5) composed of 243.0 mM
NH4Cl and 95.9 mM Na2EDTA was added to 7 mL of
sample. The buffer pH was adjusted with ammonia
solution(25–28%).
SI protocol for nitrate-N
analysis was looped four times per sample, and for each run, 10μL of the single reagent composed of 2.48 M HCl, 3.04 mM N-(1-naphthyl) ethylenediamine dihydrochlor-ide, and 0.12 M sulfanilamide was aspirated at 25μL s−1. This was followed by aspirating 40μL of reduced sample using port 3 for reagent and flow-through inlet port 5 for sample. Thirty-five microliters of the combined zones was dispensed to the flowcell at 25μL s−1and delayed for 45 s for color development and absorbance reading. The selected flow rates were guided by FIAlab operation manual (2005). The sampling rate was 65 h−1. The first peak of the four was discarded.
Optimization of manifold variables
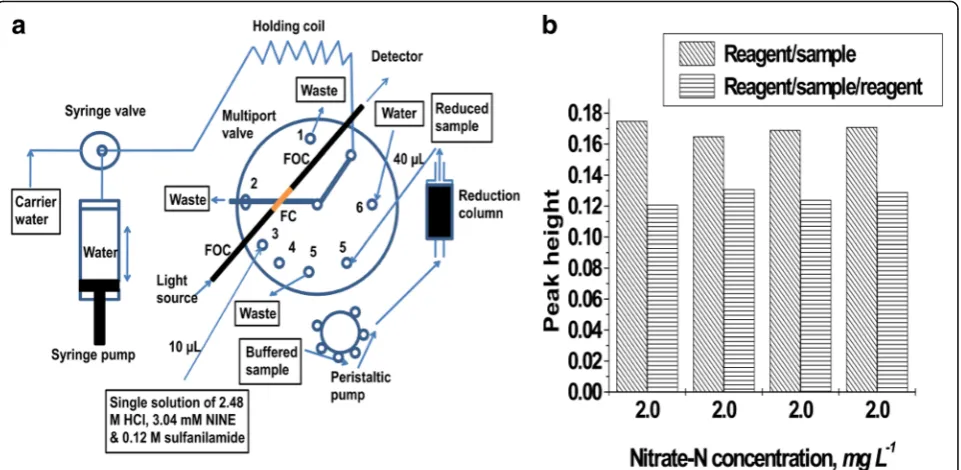
Stacking of sample and reagent zones in the holding coil was optimized to determine whether the two-zone stack (reagent/sample combined zones) or the three-zone stack (reagent/sample/reagent sandwich) would be more sensitive. In both tests, 40-μL sample aliquots of 2.0 mg N L−1 standard were used. For the two-zone stack, a 10-μL reagent zone was aspirated followed by a 40-μL sample zone. For the three-zone sandwiching, the 40-μL sample zone was sequentially piled in between two 10-μL reagent lines in the holding coil. Reagent volume was varied in search of the optimum using 40
μL of 2.0 mg N L−1 standard. The volumes investi-gated were 3, 5, 7, 10, and 15 μL of the single reagent. Optimization of volume dispensed to the flowcell (delay position) for the stopflow mode of reagent/
sample-combined zones was performed. For this test, 40 μL of 2.0 mg N L−1 standard and 10 μL reagent were sequentially aspirated. The volumes dispensed to the flowcell in separate runs were 1, 5, 10, 15, 20 25, 27, 31, 33, 35, 37, 39, and 50 μL and delayed for ab-sorbance reading. Cd reduction was employed for all the experiments in optimizing manifold configuration.
Optimization of reduction chemical variables
Sample-to-buffer ratio for Zn reduction was optimized using ammonium buffer (pH 8.5). For this test, 2.0 mg N L−1 standard was used, and eight ratios in a total fixed volume of 4.0 mL composed of simultan-eously increasing sample volume and decreasing buffer volume were tested. The eight sample/buffer combina-tions were 1/3, 2/2, 3/1, 3.5/0.5, 3.7/0.3, 3.8/0.2, 3.9/0.1, and 4/0 mL. Ammonium buffer pH was varied in search of the optimum for quantitative reduction of NO−3 to
NO−2 by Zn reduction using 10.0 mg N L−1 standard.
The pH values investigated were 8.1, 8.5, 8.75, 9.0, 9.5, and 10.5.
The Na2EDTA concentration for conditioning the Zn
reduction micro-column was optimized using ammo-nium buffer (pH 8.1) and 10.0 mg N L−1standard. The Na2EDTA concentrations tested were 0.0, 1.15, 2.30,
4.60, and 96.6 M. To eliminate gas interference in the Zn reduction column, boric acid-borate buffer (pH 8.1) was tested for zinc reduction of nitrate and was com-pared with the ammonia-ammonium buffer (pH 8.1) using 0.50 and 5.0 mg N L−1standards.
Fig. 1aOptimized manifold for SI analysis of nitrate-N in stopflow mode.bStacking of sample and reagent zones in the holding coil.FCflowcell,
ion concentration was also prepared together, and the resulting range of [H+] in this case was 0.480 to 2.86 M HCl. The reagent concentrations and delay times were tested using 1.0 mg N L−1standard.
Optimization of nitrate extraction variables
Simplex algorithm was used for the simultaneous optimization of extractant volume, extraction speed, and extraction time using Cd reduction. Extraction time was varied between 5 and 40 min. Extractant volume was varied between 10 and 40 mL, and extraction speed was varied between 160 and 240 rpm. In every experiment, 1.0 g of the same homogenized sediment was extracted with 2 M KCl and was shaken on a thermostated shaker (Jiangsu Taicang Lab, SHZ-88, China) at 25 °C (Dorich and Nelson 1984). The extracts were filtered through a 0.45-μm filter and analyzed for N. Three replicate extrac-tions were performed for each experiment. In order to standardize the peak height, it was calculated as absorb-ance times extractant volume divided by mass of sediment because the variation of extractant volume led to a differ-ent sedimdiffer-ent-to-solution ratio for each experimdiffer-ent.
Optimization of alkaline persulfate oxidation for TN Optimization of sediment digestion to achieve quantita-tive dissolution of TN and a colorless sediment was carried out by the method of alkaline persulfate diges-tion (Worsfold et al. 2005) using Cd reducdiges-tion. The mass of K2S2O8 used for digesting a constant mass of
the same homogenized sediment was increased from 0.3 to 2.1 g in 0.3-g increments. For the first experiment, 0.5 g of sediment was weighed into a 100-mL digestion flask, and subsequently, 2 mL of 0.3 M NaOH solution and 0.3 g of K2S2O8were added to it. An Allihn
conden-ser was fixed to the digestion flask, and the upper end of the condenser was corked and the coolant water flowing through the condenser was at approximately 2–3 °C and
pumped by a water-circulation pump (Zhengzhou
Greatwall, SHB-III, China). The digestion was carried out on a preheated magnetic stirrer (Jincheng Guosheng, 78–1, China) at 110 °C for 2 h. Each successive experiment had 0.3 g more K2S2O8. After digestion, 1 drop of
stirred, allowed to stand for 1 h, and analyzed for nitrate through the KCl extraction procedure stated above using 10 mL of 2 M KCl. KNO3used for recovery studies was
supplied by Surechem (UK), while Sinopharm (China) supplied KNO3used for all calibration curves.
Laboratory-fortified matrix samples and laboratory-fortified blanks were prepared for recovery studies to validate the TN method. For the matrix sample set, three 1.0-g aliquots of sediment sample previously analyzed by the TN oxidation procedure to contain 1.542 g TN kg−1 were placed in three 10-mL glass bottles. Aqueous solu-tions of 4.000 g N L−1glycine, 4.000 g N L−1adenosine 5′-diphosphate disodium (ADP), and 2.500 g N L−1 KNO3 were prepared. Then, 0.1 mL of each reference
solution was added to the 1.0-g sediment. It was corked, gently stirred, allowed to stand for 1 day, and analyzed for TN through the oxidation procedure using 3.6 g of K2S2O8in 2 mL of 0.30 M NaOH. For the fortified blank
set, three 1.0-mL aliquots of deionized water were separ-ately spiked with 0.1 mL of 0.400 g N L−1NH4Cl, 0.1 mL
of 0.400 g N L−1ADP, and 0.1 mL of 0.250 g N L−1KNO3,
and the three samples were analyzed for TN.
Results and discussion
All results reported for the optimization of nitrate re-duction chemical variables and recovery studies were ob-tained using ZnR-SIA, and all other results reported in this study were obtained using CdR-SIA. The physico-chemical characteristics of the sediment sample adopted were as follows: pH, 3.98; total organic carbon, 2.26% by the Walkley-Black method (Environment Agency 2009); and mineral Fe, 2.36 g kg−1 by SIA-spectrophotometric method (Oladosu et al. 2016).
Manifold configuration
important because less mixing was derived from a sample zone flanked on one side by a reagent zone and flanked on the other side by a water carrier zone. The result indicated that the reaction requires a very small volume of re-agent for optimum color intensity or else the sample will be unnecessarily diluted by the excessive reagent volume. Therefore, reagent/sample zone stack was adopted for this study.
The optimization of reagent volume at a constant sam-ple volume (40μL) showed that 10μL was the optimum reagent volume as depicted by the peak maximum in Fig. 2a. From 3 to 7 μL in this figure, the peak height
was lower because the reagent volume was too small and the reagent was too diluted by the penetrating sample. Above 10 μL, specifically at 15 μL, the peak height was lower because the reagent volume was too high and the sample was too diluted. A reagent volume of 10 μL was therefore adopted for further analyses.
The variation of dispensed volume out of 10-μL re-agent/40-μL sample lines showed that the optimum pos-ition was 35μL, which was at the 70% position of the total stacked line (50μL), as illustrated by the peak maximum in Fig. 2b. Unlike FIA, this position did not coincide with the supposed sample concentration maximum which was
Fig. 2aVariation of reagent volume in search of the optimum using 40μL of a 2.0 mg N L−1standard.bProfile of zone penetration in a two-zone
stack in the optimization of dispensed volume
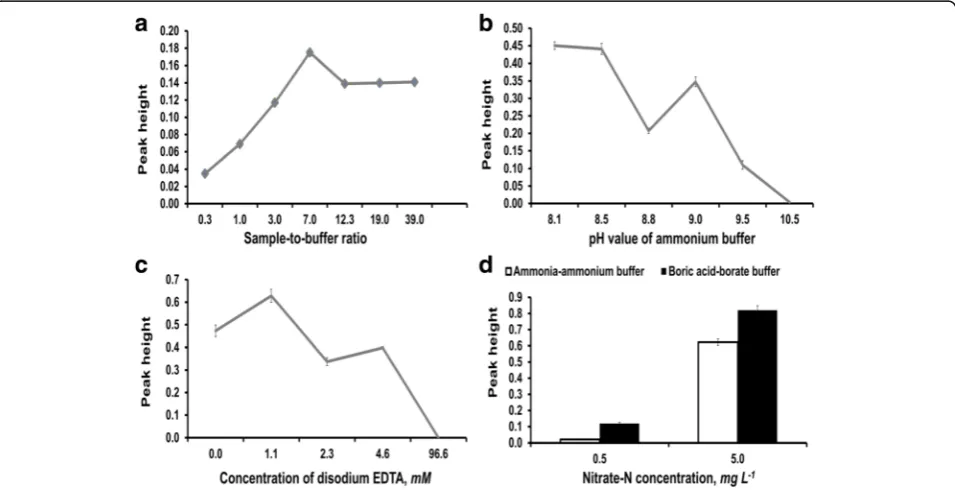
Fig. 3aEffect of sample-to-buffer ratio on Zn reduction illustrating increase in sensitivity with increasing sample-to-buffer ratio.bEffect of buffer pH on Zn reduction illustrating decrease in sensitivity with increasing buffer pH.cEffect of Na2EDTA concentration on Zn reduction using 10.0 mg N L−1
maximum in Fig. 3a. At lower ratios, sample volume was too small and too diluted by buffer volume, and at higher ratios, samples were not sufficiently buffered as the reduction process is pH dependent; these reasons accounted for the low peaks of these ratios. A sample-to-buffer ratio of 4:1 was adopted for ZnR-SIA study so as to prevent low precision and accuracy observed at 7:1 for KCl and K2S2O7matrices.
The variation of buffer pH in search of the optimum for ZnR-SIA showed a decreasing pattern in peak height with increasing pH from 8.1 to 10.5 (Fig. 3b). Therefore, 8.1 was used in all analyses. It was likely that zinc reduced nitrate to N species other than nitrite at higher pH, and this accounted for the decreasing nitrite peak height with pH. Zn was reactive in ammonia-ammonium buffer and generated copious volumes of gas which increased with pH from 8.1 to 10.5. It was also likely that Zn dissolution to release hydrogen gas dominated the chemistry over nitrate reduction at high pH in a manner similar to Zn dissolution in alkalis to form tetrahydroxo-zincate ion (Lee, 2009).
In the absence of Na2EDTA, peak height was gradually
decreasing with the number of uses. In 11 analysis runs without Na2EDTA in the conditioning buffer for the Zn
column, the 11th run had only 19.1% of the first run peak height. Therefore, EDTA was necessary to protect the column. The concentration effect of Na2EDTA on
response was shown in Fig. 3c. Low concentration of Na2EDTA, namely 1–4 mM, favored the Zn column life,
but the very high concentration did not as illustrated by the fall to zero in the figure. It is likely that excessive EDTA ions adversely competed with NO3− for Zn
sur-face because NO3− reduction to NO2− is a surface
process or the EDTA inhibited either the diazotization or coupling or both in the Griess reaction. In further study, 1.1 mM Na2EDTA was adopted.
The bar chart in Fig. 3d showed that boric acid-borate buffer was more efficient for Zn reduction of nitrate than ammonia-ammonium buffer with the tal-ler peaks of the former. The boric acid-borate buffer gave 585 and 132% of the instrument response given by ammonia-ammonium buffer at 0.5 and 5.0 mg
analysis-lab-on-valve manifold.
Colorimetric parameter conditions
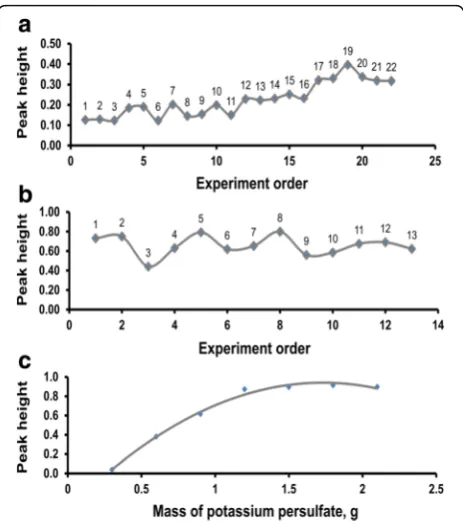
The results of three-factor optimization of the Griess-Illosvay reaction variables are displayed in Fig. 4a. The sim-plex probed around a wide region comprising 22 experi-ments to reach the highest peak height at experiment 19. The conditions at experiment 19 were 0.12 M sulfanila-mide, 2.48 M HCl, 3.04 mM NINE, and 56 s. These reagent concentrations were adopted for all sample analyses but with a delay time of 45 s. The multi-factor optimization data (Additional file 1) were further analyzed by linear re-gression with the instrument response as the dependent variable in order to determine the influence of the three univariate components.
Fig. 4aThree-factor search of the optimum colorimetric conditions for nitrate SI analysis using 1.0 mg N L−1solution.bThree-factor variation
The most important factor influencing the peak is the sulfanilamide concentration as shown by the significant variance in the peak height, which was accounted for by sulfanilamide concentration (R2= 0.598,F[1, 20] = 29.735,
p= 0.000, Additional file 2). The next important factor affecting peak height is the NINE concentration owing to the significant variance in the response explained by NINE concentration (R2= 0.147, F [1, 18] = 11.930, p< 0.05). Delay time did not exert any significant influence on the instrument response (R2= 0.033,F[1, 19] = 1.687,p> 0.05). Sulfanilamide diazotizes nitrite in the first step of the reaction, and the availability of diazotized molecular ion determines the coupling reaction of NINE in the second step (azo dye formation), and because all diazotized molecules would not be available for coupling, the influ-ence of the NINE concentration on Griess-Illosvay reac-tion is much less important than that of the sulfanilamide concentration.
The three investigated variables explained 77.8% of the variation in the azo dye (response) (model 3, Additional file 2), implying that some uninvestigated factors such as temperature might explain the remaining percentage. The optimization data—colorimetric conditions—obtained from the simplex algorithm supported the generalizability of the model becauseR2shrunk only slightly from 0.778 to 0.741 (the adjustedR2). The coefficients (Bvalues) for the sulfanilamide concentration and the NINE concentra-tion in model 3 (Addiconcentra-tional file 2) are significantly differ-ent from zero (p= 0.001 and p= 0.003 respectively) and this agrees with theFstatistic, whereas B value for delay time is not different from zero (p= 0.000), suggesting that the delay time cannot predict or explain the outcome variable—the response.
However, if the analysis and discussion of the three univariate factors were based only on Pearson correla-tions (zero-order correlacorrela-tions) where the sulfanilamide concentration, time, and NINE concentration have the Pearson values 0.773, 0.764, and 0.429, respectively, there would be misleading conclusions such as time having a strong positive association (Pearsonr= 0.764) with the instrument signal. In fact, model 3 indicates that delay time was negatively related to the signal (azo dye) in its B value (−0.005), though non-significant and due to chance by 14.1% (Additional file 2); this is sup-ported by the part correlation (−0.171), the unique rela-tionship, of time with the signal. Hence, the powerful usefulness of the linear regression was used.
Sediment nitrate extraction conditions
The results of three-factor optimization of nitrate ex-traction variables using 2 M KCl are pictured in Fig. 4b. In the figure, the highest maximum occurs at experi-ment 8 among the 13 experiexperi-ments. The conditions at
experiment 8 were 19.1 min, 16.8 mL (1:16.8 sediment-to-solution), and 224 rpm. However, 20-min extraction time, 10-mL extractant volume (2.5:10 sediment-to-solution), and 220-rpm extraction speed were adopted for sample extraction. The multivariate optimization data (Additional file 1) were further analyzed by linear regres-sion with the instrument signal as the dependent variable, and it was found that the single important factor influen-cing the peak height is extraction speed. It accounted for 0.302 of the variance in the instrument response (F[1, 11] = 4.771, p= 0.051, Additional file 2), and this was nearly significant, missing the significance criterion by 0.1% chance.
Other variables—volume of extractant and extraction time—were apparently not associated with the response (zero-order correlations −0.172 and 0.291, respectively, and their part correlations were nearly zero, Additional file 2) and lacked any predictive power on the response (F [1, 10] = 0.000 and F [1, 9] = 0.011, respectively, p> 0.05). However, the non-significant negative relation (−0.172) between extractant volume and peak height can be very important in some situations and is not likely due to the third-variable problem. This negative effect becomes important at low nitrate concentration of the sediment because only a small extractant vol-ume will make the nitrate level detectable in this situ-ation. At higher volumes, the nitrate level becomes undetectable except that sediment mass is increased relative to extractant volume. This necessitated the high 1:4 sediment-to-solution ratio adopted for fur-ther work. Literature of methods does not ascribe other factors except for those investigated in this study on nitrate extraction from soils, yet a large 69.7% of the variance in the nitrate quantitative ex-traction could not be explained by these factors. A reasonable property of nitrate which can account for the greater part of this unexplained variance is the ready solubility of all nitrate salts in water, thereby en-hancing the extraction. Another uninvestigated variable, which can account for the variance, is the particle size of sediments, since nitrate extraction will increase with decreasing particle size. The contributions of the two foregoing factors were not captured in the regression model 3 (Additional file 2), hence the high magnitude of unexplained variation.
Sediment oxidation conditions for TN
In the optimization of sediment-to-potassium persul-fate ratio to obtain an efficient mass of K2S2O8 that
would give quantitative oxidation/hydrolysis of or-ganic N to nitrate, the sediment color faded as the K2S2O8 mass used for sediment oxidation was
was obtained at the sixth and seventh experiments comprising 0.5-g sediment plus 1.8-g K2S2O8 and 0.5-g
sediment plus 2.1-g K2S2O8respectively. In further sample
oxidation for TN determination, a sediment-to-potassium persulfate ratio of 1:3.6 (that is 1.0 g sediment/3.6 g K2S2O8) was adopted. Besides visual inspection, after each
oxidation experiment, the TN absorbance of the solution was determined, and the results are displayed in Fig. 4c. The maximum of this figure is broad and occurs at approximately 0.9 (peak), and this value corresponds to 1.5 to 2.1 g K2S2O8. Therefore, quantitative
diges-tion of TN was obtained from 1.5 to 2.1 g K2S2O8
used in experiments 5 to 7, and this was closely in agreement with the visual inspection.
Validation of methods
The ZnR-SIA had good accuracies for all the matrices studied as shown by the following recoveries. The average recovery of nitrate-N in matrix samples was 94.7% (Table 1), and its precision was 4.52%. The average recoveries of total N in blanks and matrix samples were 97.9 and 93.2% respectively (Table 1). The high recoveries of TN from glycine, ADP, and NH4Cl indicate the
quanti-tative oxidation/hydrolysis of organic and reduced inor-ganic N by the sediment-to-persulfate ratio of 1:3.6 used. The method detection limits for the three matrices studied were 24.6μg N L−1for reagent water, 0.383 mg N kg−1for KCl-extractable nitrate, and 3.18 mg N kg−1for TN follow-ing alkaline persulfate digestion. In reagent water, Zn-SIA had a linear calibration range of 0.06–6.00 mg N L−1. In KCl solution, the matrix effect was not important as
the upper calibration limit for sediment nitrate was 24.0 mg N kg−1 (equal to 6.00 mg L−1 × solution-to-sediment ratio). The upper limit for solution-to-sediment TN in K2S2O8matrix was 200 mg N kg−1.
The Zn column could not be stored owing to rapid daily-scale diminishing in efficiency but could be used continuously for 24 h with sustained reduction. A white precipitate, possibly Zn (OH)2, was formed on storage.
The coating of the Zn surface by this precipitate reduced nitrate electrolytic reduction since the reduction was a surface process (Table 1).
Conclusions
The novel application of boric acid-borate buffer in the zinc reduction-sequential injection analysis virtually stopped gas evolution from the zinc micro-column and prevented gas interference, which would have been sig-nificant and disallowed the online use of zinc. This study demonstrates that zinc reduction can accurately deter-mine nitrogen species in estuarine sediments. Zinc is less monitored in human foods, potable water, and sur-face waters because it is a micronutrient although it could be toxic at high levels. Therefore, zinc reduction is a green chemical process in contrast to the cadmium re-duction owing to cadmium toxicity and likely to attract wide acceptability where sustainable development is de-sired. The automation of the technique coupled with its high turnover of 65 h−1demonstrated its suitability for routine laboratory determination of nitrate in water and sediment.
Precision, % 4.52 Fortified blank
Reference compound
Spike level, g N L−1
Found concentration, g N L−1 Recovery, %
NH4Cl 0.400 0.380 94.9
ADP 0.400 0.394 98.4
KNO3 0.250 0.251 100.4
Average recovery
Additional files
Additional file 1:Data obtained from optimization experiments and employed for regression analyses. (XLSX 10 kb)
Additional file 2:Results of regression analyses and the individual variances explained by the investigated conditions. (DOCX 15 kb)
Abbreviations
ADP:Adenosine 5′-diphosphate disodium; CdR-SIA: Cadmium reduction-sequential injection analysis; FIA: Flow injection analysis; LOV: Lab-on-valve; N: Nitrogen; NINE:N-(1-naphthyl) ethylenediamine dihydrochloride; SIA: Sequential injection analysis; TN: Total nitrogen; ZnR-SIA: Zinc reduction-sequential injection analysis
Acknowledgements
This work was supported by the Chinese Scholarship Council (CSC No. 2014ZFJ020).
Authors’contributions
ONO carried out the optimization experiments, interpreted the results, and wrote the manuscript. AAA collected the samples and contributed knowledge to the method development; ZX assisted in making the micro-column and procuring the materials. OKO, ABI, and DA supervised the optimization experiments and reviewed the manuscript. All authors agreed to the publication of the study. All authors read and approved the final manuscript.
Competing interests
The authors declare that they have no competing interests.
Publisher’s Note
Springer Nature remains neutral with regard to jurisdictional claims in published maps and institutional affiliations.
Received: 17 November 2016 Accepted: 29 March 2017
References
APHA, American Public Health Association. Standard methods for the examination of water and wastewater. Washington: APHA; 2005. Dorich RA, Nelson DW. Evaluation of manual cadmium reduction methods for
determination of nitrate in potassium chloride extracts of soils. Soil Sci Soc Am J. 1984;48:72–5.
Ellis PS, Shabani AMH, Gentle BS, McKelvie ID. Field measurement of nitrate in marine and estuarine waters with a flow analysis system utilizing on-line zinc reduction. Talanta. 2011;84(1):98–103.
Environment Agency. Updated technical background to the CLEA model. In: Jeffries J, Martin I, editors. Using science to create a better place. Bristol: Environment Agency; 2009.
Gelderman RH, Beegle D. Nitrate-nitrogen. In: Recommended chemical soil test procedures for the North Central Region. Missouri Agricultural Experiment Station SB 1001. Available via DIALOG. 2012. http://www.extension.missouri. edu/explorepdf/specialb/sb1001.pdf. Accessed 17 Jun 2013.
Grudpan K, Hartwell SK, Wongwilai W, Grudpan S, Lapanantnoppakhun S. Exploiting green analytical procedures for acidity and iron assays employing flow analysis with simple natural reagent extracts. Talanta. 2011;84:1396–400. Lee JD, editor. Concise inorganic chemistry. Delhi: Wiley; 2009.
Mendham J, Denney RC, Barnes JD, Thomas MJK. Vogel’s textbook of quantitative chemical analysis. Essex: Pearson; 2000.
Merino L. Development and validation of a method for determination of residual nitrite/nitrate in foodstuffs and water after zinc reduction. Food Anal Method. 2009;2(3):212–20.
Mir SA. An improved zinc reduction method for direct determination of nitrate in presence of nitrite. Asian J Chem. 2007;19(7):5703–10.
Morales JA, Albornoz A, Socorro E, Morillo A. An estimation of the nitrogen and phosphorus loading by wet deposition over lake Maracaibo, Venezuela. Water Air Soil Poll. 2001;128:207–21.
Oladosu NO, Zhao K, Abayomi AA, Olayinka KO, Alo BI, Deng A. Sequential injection analysis for the monitoring of riverine phosphorus and iron inputs into the Lagos Lagoon sediments. J Flow Injection Anal. 2016;33(1):13–21.
Olajire AA, Imeokparia FE. A study of the water quality of the Osun River: metal monitoring and geochemistry. Bull Chem Soc Ethiop. 2000;14(1):1–8. Patton CJ, Kryskalla JR. Evaluation of alkaline persulfate digestion as an alternative
to Kjeldahl digestion for determination of total and dissolved nitrogen and phosphorus in water. Water-Resources Investigations Report 03–4174. Denver: United States Geological Survey; 2003.
Sanghi R, Singh V, Sharma SK. Environment and the role of green chemistry. In: Sanghi R, Singh V, editors. Green chemistry for environmental remediation. Massachusetts: Scrivener; 2012.
Solich P, Polasek M, Klimundova J, Ruzicka J. Sequential injection technique applied to pharmaceutical analysis. Trend Anal Chem. 2003;22(7):116–26. Sun HF, Wang HW, Yuan CY. Optimization of zinc-cadmium reduction method for
determination of nitrate in seawater. Adv Mater Res. 2014;864–867:1004–7. Walters FH, Morgan SL, Parker LR, Deming SN. Sequential simplex optimization: a
technique for improving quality and productivity in research, development and manufacturing. Boca Raton: CRC; 1991.
Worsfold PJ, Gimbert LJ, Mankasingh U, Omaka ON, Hanrahan G, Gardolinski PCFC, Haygarth PM, Turner BL, Keith-Roach MJ, McKelvie ID. Sampling, sample treatment and quality assurance issues for the determination of phosphorus species in natural waters and soils. Talanta. 2005;66:273–93.
Submit your manuscript to a
journal and benefi t from:
7 Convenient online submission 7 Rigorous peer review
7 Immediate publication on acceptance 7 Open access: articles freely available online 7 High visibility within the fi eld
7 Retaining the copyright to your article