DOI: 10.5958/2230-732X.2016.00141.8
©2016 New Delhi Publishers. All rights reserved
AGRICULTURAL STATISTICS
Weather based Statistical Modelling for Forecasting of Yearly
Spot Blotch Severity in different Growth Stages of Wheat
Anil Kumar Pant
1, G.C. Mishra
1*, Ramesh Chand
2, V.K. Mishra
31Section of Statistics, Department of Farm Engineering, 2Department of Mycology and Plant Pathology, 3Department of Genetics and Plant Breeding, Institute of Agricultural Sciences, Banaras Hindu University, Varanasi-221005, India
Corresponding author: [email protected]
Paper No. 544 Received: 27 August 2016 Accepted: 17 December 2016
Abstract
The Objective of the present study was to develop regression models for forecasting spot blotch severity in susceptible and resistant genotypes of wheat crop under Irrigated timely sown condition (ITS), Irrigated
late sown condition (ILS) and Rainfed timely sown condition (RFTS). CRI, tillering, jointing, flowering, milking and dough stages of wheat were considered for studying the effect of weather parameters on
yearly spot blotch severity. Yearly disease severity data and weekly weather data during the period 1975 to 2012 of North eastern plains zones of India were used for this purpose. On the basis of 37 years
data, the correlation coefficients between the yearly spot blotch severity and weekly weather parameters (Maximum temperature, maximum relative humidity and their joint effects) were calculated for measuring the quantitative relationship between these variables. These values of correlation coefficients were used
for developing weighted weather indices of weather parameters. Values of rTw and rTRHw were found
higher and positive in between jointing stage and flowering stage in both the genotypes. The lower
RMSE value of MLR models at jointing stage suggested that forecasted value at jointing stage is more precise than other stages.
Highlights
• Duration between 8th week and 11th week from the date of sowing was found critical for the spot
blotch progression in wheat. In this consideration best management practices are required during this duration to restrict the progression of spot blotch. The forecasted values of yearly spot blotch
severity in susceptible genotype for the period 2016-17 were obtained as 73.08 %, 75.01% and 52.00%
for ITS, ILS and RFTS sowing conditions respectively. For the same period forecasted values of
spot blotch disease severity were obtained as 37.95 %, 43.91 % and 38.60 % for ITS, ILS and RFTS
conditions respectively in the case of resistant genotypes.
Keywords: Regression models, Sowing conditions, Spot blotch severity, Weather parameters, Growth stages
Wheat (Triticum aestivum) is the main source of nutrients and energy in the Indian diet. It is not only rich source of minerals but high content of antioxidant is also found in the Wheat grain, which provides additional health benefits (Rosegrant et al., 1995). Rice being the first and wheat is the
second most important crop of the country, which contributes nearly one – third of the total food grain production. The area under wheat has steadily gone up since the start of the green revolution in 1965
and its production and productivity have increased tremendously. The wheat area has increased from
12.8 million-ha in 1966-67 to 29.8 million-ha in 2015-16. During the same period productivity and
production of this staple food has been increased
by 263% and 711% respectively. With the record production of 95.85 million tonnes of wheat in 2013-14, India ranked second in wheat production after
India. India produced 2.95 ton wheat in a hectare
against 5.34 ton by china in 2015-16.
Several biotic and abiotic stresses are responsible for less productivity of wheat in India. Spot blotch caused by Bipolaris sorokiniana emerged as a major threat to wheat production in North eastern plains zones (NEPZ) of India, which has the second highest
share in the total wheat production in India (Dubin, 1984; Gilchrist and Pfeiffer, 1991; Joshi et al., 2002). The risk of Spot blotch epidemics is high in areas characterized by average temperature greater than 17° C during night of the coolest months, with high
relative humidity. Disease severity increases with
crop growth stage and is generally devastating
after flowering (Joshi et al., 2007). The centres under
NEPZ are eastern Utter Pradesh, Bihar, Jharkhand,
West Bengal and plains of far eastern states. These regions are characterized by high temperature and humidity at the late ‘growth stage’, which are very favourable conditions for spot blotch progression in wheat.
Reliable forecast for disease and yield is necessary for taking timely action regarding disease control and for assessing losses (Zhang et al., 2003; Ho
et al., 2002; Mishra and Singh, 2013; Kumari et al., 2013, Kumari et al., 2014; Shukla et al., 2015). Weather parameter contributes a major role in the development of different growth stages of crop and infestation of pest and diseases (Nema and
Joshi, 1973, Paul et al., 2013). In this consideration statistical models based on weather parameters are
very efficient for forecasting purposes.
The objective of the present study was to develop weather based multiple linear regression (MLR) models for forecasting yearly spot blotch severity
at different growth stages of wheat crop viz.CRI,
tillering, jointing, flowering, milk and dough, for North eastern plains zone (NEPZ) of India. Studies reveals that the nature of genotypes and
showing date also influences the progression of disease (Sharma and Duveiller, 2004; Duveiller et al., 2005), for this consideration susceptible and resistance genotypes of wheat crop and three sowing conditions i.e. irrigated timely sown (ITS), irrigated late sown (ILS) and rainfed timely sown (RFTS) conditions were considered in the present study.
Materials and Methods
Data Set
Time series data of yearly spot blotch severity during wheat crop seasons 1975-1976 to 2011-2012, related to genotypes of wheat in NEPZ of India , at
different sowing conditions i.e. ITS, ILS and RFTS,
was collected from annual reports of Institute of
Wheat and Barley Research Karnal (Indian Council
of Agricultural Research ) India.
Previous studies revels that weather parameters such as high temperature and high relative humidity are very favourable for progression of Spot blotch (van Ginkel and Rajaram, 1993). In the light of this fact weekly data related to maximum temperature and maximum relative humidity, during 1975 to 2012 were collected from India Meteorological
Department, New Delhi (India).
Development of weighted indices of weather parameters
Weather indices were computed from weekly weather parameters, where weights being correlation coefficient between yearly spot blotch severity and weather parameters with respective week’s. Equation (2.1) and (2.2) represents the mathematical form of weather indices:
, 1
m j i j iw iw
w
Z r X
= =
∑
(2.1) , , 1 m ji i j ii w iw i w w
Z ′ r X X′ ′
=
=
∑
(2.2) Where,
J =0, or 1 (where, ‘0’ represents un-weighted indices and ‘1’ represents weighted indices), w represents week number (1, 2... m)
riw is the Correlation coefficient between disease severity and ith weather variable in wth week, r
ii’w
is Correlation coefficient between disease severity
and the product of i and i’th weather variable of
wth week X
iw is the i weather variables in wth week respectively.
MLR Model
1 1
0 , , . . , ,
1 0 1 1
p p
i j i j i i j i i j
i j i i j
Y A a Z a ′ Z ′ e
= = ≠ =′ =
= +
∑∑
+∑ ∑
+ (2.3)Where,
j i
Z
, andZ
i,i,'j weather indices obtained by equation (2.1) and (22) , i,i’: 1, 2, …pp: Number of weather variables under study Y: Dependent Variable
A0: Intercept
e: Error term normally distributed with mean zero and constant variance .
Accuracy Measurement of the Model
To make comparison of forecasting ability among models is Root mean square Error (RMSE) given as:
(
)
2t t
P A
RMSE
T
Σ −
= (2.4)
Where, T: Total number of observations in the time series.
Pt: Predicted Value at time t. At: Actual value at time t.
Results and Discussion
Three type of sowing conditions are more common in North eastern plains zones of India for wheat cultivation i.e. Rainfed timely sown conditions (sowing time: between last week of October and 12 November), Irrigated timely sown conditions (sowing time: between 10 November and 30 November) and Irrigated late sown condition (sowing time: between 25 November and last week
of December). In the collection phase of spot blotch
severity data, a problem regarding sowing dates has been experienced for each sowing conditions. It was found that in many years, sowing date of a
particular year was different than sowing date of its
previous and next year. In this study, 1 November
for RFTS, 15 November for ITS and 1 December
for ILS, has been considered as a sowing dates in model building process (Since these dates were the most common sowing dates during 37 years at the particular sowing conditions). Crown root initiation
(CRI), Tillering, Jointing, Flowering, Milking and Dough growth stages of wheat crop were
considered for studying the behaviour of disease.
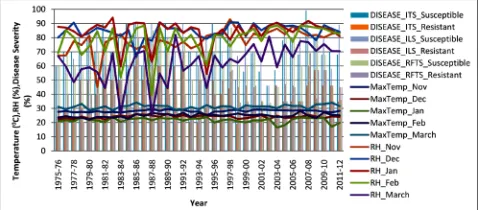
Time series data, during the crop seasons 1975-76 to 2011-12, of the monthly average maximum temperature (°C), monthly average maximum
relative (%) and yearly spot blotch disease severity (%) in susceptible and resistant genotypes at ITS,
ILS and RFTS conditions was shown in Fig. 1. Based on the 37 year data, the correlation coefficients between the yearly spot blotch severity and weekly weather parameters were calculated for measuring the quantitative relationship between these variables
.These values of correlation coefficients were used
for developing weighted weather indices of weather parameters with the help of procedure mentioned in material and method section.
Fig. 1: Time series data of the monthly average maximum temperature (°C), monthly average maximum relative (%)
and yearly spot blotch disease severity (%) in susceptible and resistant genotypes at ITS, ILS and RFTS conditions
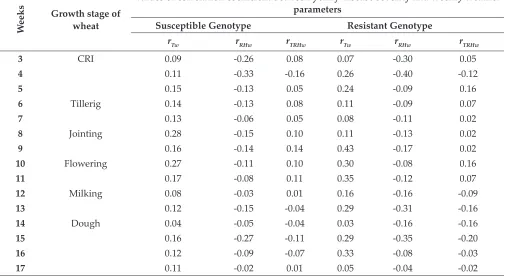
Table 1, 2 and 3 represents the values of correlation
coefficients between the yearly disease severity and
weekly weather parameters at RFTS, ITS and ILS conditions respectively. In these tables symbol rTw
used for the values of correlation coefficients between
disease severity and maximum temperature in wth
week, symbol rRHw used for the values of correlation
coefficients between disease severity and maximum
relative humidity in wth week. Symbol r
TRHw used for
the values of correlation coefficients between disease
severity and the product of maximum temperature and maximum relativehumidity of wth week. In
other words rTRHw used for the values of correlation
coefficients between disease severity and joint effect
of maximum temperature and maximum relative humidity.
In this study tabulated in Table 1, 2 and 3, it was found that at each sowing condition value of rTw was found higher in the jointing stage for both genotypes. This high positive correlation indicates
that temperature at jointing stage is severely affects
Table 1: Correlation coefficient between yearly disease severity and weekly weather parameters for susceptible
and resistant genotypes at RFTS condition
W
eeks Growth stage of wheat
Values of correlation coefficient between yearly disease severity and weekly weather
parameters
Susceptible Genotype Resistant Genotype
rTw rRHw rTRHw rTw rRHw rTRHw
3 CRI -0.12 -0.04 -0.07 0.17 0.02 0.06
4 0.08 -0.09 -0.06 0.08 0.02 0.04
5 -0.08 -0.13 -0.17 -0.10 -0.12 -0.16
6 Tillerig 0.21 -0.07 0.03 0.01 0.12 0.10
7 -0.06 -0.04 -0.08 0.29 -0.05 0.12
8 Jointing 0.10 -0.26 0.03 0.29 -0.31 0.11
9 0.49 -0.27 0.06 0.40 -0.49 0.23
10 Flowering 0.21 -0.35 0.10 0.17 -0.28 0.11
11 0.30 -0.35 0.24 0.21 -0.28 0.13
12 Milking 0.22 -0.07 0.15 0.27 0.05 0.30
13 0.12 -0.01 0.10 0.23 0.05 0.19
14 Dough 0.28 -0.19 -0.23 0.21 -0.02 0.03
15 -0.01 -0.17 -0.15 0.09 -0.01 0.15
16 0.05 -0.28 -0.24 0.22 0.07 0.13
17 0.22 -0.11 -0.01 0.20 0.08 0.09
Table 2: Correlation coefficient between yearly disease severity and weekly weather parameters for susceptible
and resistant genotypes at ITS condition
W
eeks Growth stage of wheat
Values of correlation coefficient between yearly disease severity and weekly
weather parameters
Susceptible Genotype Resistant Genotype
rTw rRHw rTRHw rTw rRHw rTRHw
3 CRI -0.08 0.04 0.02 0.02 0.10 0.10
4 0.21 0.08 0.14 0.20 0.04 0.10
5 0.06 -0.10 -0.08 0.22 -0.23 -0.16
6 Tillerig 0.06 -0.05 -0.01 0.04 -0.04 -0.02
7 -0.27 -0.04 -0.01 -0.11 -0.03 0.01
8 Jointing 0.27 -0.02 0.14 -0.10 -0.12 0.11
9 0.41 -0.19 0.28 0.46 -0.36 0.12
10 Flowering 0.05 -0.23 0.29 0.10 -0.22 0.01
11 0.15 -0.23 0.10 0.11 -0.22 0.10
12 Milking 0.08 0.10 0.16 0.01 0.01 .029
13 -0.19 0.18 0.21 -0.20 0.11 .098
14 Dough -0.13 0.07 0.01 0.11 0.08 0.13
15 0.14 0.04 0.11 0.23 0.13 0.21
16 -0.13 -0.17 -0.19 0.04 -0.13 -0.05
at RFTS and ILS conditions in susceptible genotypes
(Table 1 and 3). However values of rTRHw were found higher and positive in between jointing stage
and flowering stage in both the genotypes. This
indicates that, the relative humidity is not alone responsible for progression of disease severity. This
is the temperature, whose joint effect with relative
humidity is responsible for progression of disease severity.
Regression models for forecasting yearly spot blotch severity
CRI, tillering, jointing, flowering, milking and dough
stages of wheat crop have been used for developing relationship between weather parameters and spot blotch severity. Three weighted indices for weather parameters (Z1,1 for maximum temperature, Z2,1 for maximum relative humidity and Z12,1 for joint effect of maximum temperature and maximum relative humidity) have been obtained for each growth stages of wheat crop. Multiple linear regression (MLR) model was used for establishing the relationship between weather indices (Z1,1 , Z2,1 and Z12,1) and yearly spot blotch severity (Y). Table
4 and Table 5 represents the weather based MLR
models for forecasting yearly spot blotch severity
in different growth stages of wheat at ITS, ILS and
RFTS sowing conditions in susceptible and resistant genotypes respectively.
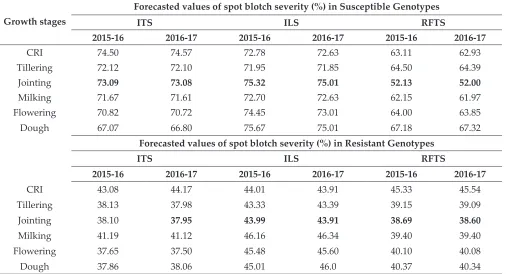
Forecasted yearly spot blotch severity for season 2015-16 and 2016-17
Autoregressive Integrated Moving Average (ARIMA) technique was used for forecasting weather conditions of year 2015-16 and 2016-17. Based on these forecasted values of weather conditions, value of disease severity has been estimated during these period with the help of regression models mentioned in materials and methods section. Table 6 represents the forecasted values of yearly spot blotch severity obtained by,
MLR models discussed in Table 4 and 5, for the
crop seasons 2015-16 and 2016-17. It was found
from Table 4 and 5 that for both the genotypes at
each sowing conditions the RMSE values of the MLR models at the jointing stage was minimum compared to other growth stages. The lower RMSE value at jointing stage indicates that, forecasted value at this stage is more precise than any other stage value. On this consideration forecasted Table 3: Correlation coefficient between yearly disease severity and weekly weather parameters for susceptible
and resistant genotypes at ILS condition
W
eeks Growth stage of wheat
Values of correlation coefficient between yearly disease severity and weekly weather
parameters
Susceptible Genotype Resistant Genotype
rTw rRHw rTRHw rTw rRHw rTRHw
3 CRI 0.09 -0.26 0.08 0.07 -0.30 0.05
4 0.11 -0.33 -0.16 0.26 -0.40 -0.12
5 0.15 -0.13 0.05 0.24 -0.09 0.16
6 Tillerig 0.14 -0.13 0.08 0.11 -0.09 0.07
7 0.13 -0.06 0.05 0.08 -0.11 0.02
8 Jointing 0.28 -0.15 0.10 0.11 -0.13 0.02
9 0.16 -0.14 0.14 0.43 -0.17 0.02
10 Flowering 0.27 -0.11 0.10 0.30 -0.08 0.16
11 0.17 -0.08 0.11 0.35 -0.12 0.07
12 Milking 0.08 -0.03 0.01 0.16 -0.16 -0.09
13 0.12 -0.15 -0.04 0.29 -0.31 -0.16
14 Dough 0.04 -0.05 -0.04 0.03 -0.16 -0.16
15 0.16 -0.27 -0.11 0.29 -0.35 -0.20
16 0.12 -0.09 -0.07 0.33 -0.08 -0.03
Table 4: Weather based MLR models for forecasting of spot blotch in different growth stages of wheat at ITS, ILS
and RFTS sowing conditions in susceptible genotypes
Stage MLR models for forecasting disease severity RMSE
Irrigated Timely Sown Condition
C.R.I Y = 20.00 + 8.90Z1,1 + 3.11Z2,1 + .005Z12,1 12.15 Tillring Y = 97.45 + 0.58Z1,1 + 2.87Z2,1 – .004Z12,1 13.05
Jointing Y = 100.8 + 2.29Z1,1 + 0.87Z2,1 – .029Z12,1 11.31
Flowering Y = 37.41 + 0.87Z1,1 + 0.34Z2,1 + .008Z12,1 11.71 Milking Y = 101.0 + 1.21Z1,1 + 0.78Z2,1 – .014Z12,1 13.72
Dough Y = 132.5 + 0.96Z1,1 + 0.68Z2,1 + .002Z12,1 11.88
Irrigated Late Sown Condition
C.R.I Y = 111.6 + 1.47Z1,1 + 0.81Z2,1 – .010Z12,1 12.20 Tillring Y = 80.95 + 2.537Z1,1 + 0.51Z2,1 – .034Z12,1 12.83
Jointing Y = 170.2 – 3.15Z1,1 + 0.60Z2,1 + .037Z12,1 11.18
Flowering Y = 48.83 + 2.79Z1,1 + 0.26Z2,1 – .037Z12,1 12.70 Milking Y = 56.56 + 2.01Z1,1 + 0.33Z2,1 – .027Z12,1 12.87
Dough Y = 34.93 + 1.95Z1,1 + 0.31Z2,1 – .025Z12,1 11.70
Rainfed Timely Sown Condition
C.R.I Y = 173.9 + 24.4Z1,1 + 1.55Z2,1 – .023Z12,1 15.04 Tillring Y = 120.3 + 3.02Z1,1 + 1.81Z2,1 – .052Z12,1 15.93
Jointing Y = 64.7 + 4.11Z1,1 + 0.67Z2,1 – .030Z12,1 13.16
Flowering Y = 106.6 + 2.14Z1,1 + 0.51Z2,1 – .001Z12,1 13.76 Milking Y = 80.76 + 2.45Z1,1 + 0.45Z2,1 – .010Z12,1 15.50
Dough Y = 52.51 + 2.42Z1,1 + 0.34Z2,1 – .007Z12,1 15.92
Table 5: Weather based MLR models for forecasting of spot blotch in different growth stages of wheat at ITS, ILS
and RFTS sowing conditions in resistant genotypes
Stage MLR models for forecasting disease severity RMSE
Irrigated Timely Sown Condition
C.R.I Y = 10.61 + 3.79Z1,1 + 2.88Z2,1 + .025Z12,1 12.06 Tillring Y = 101.9 + 0.87Z1,1 + 3.05Z2,1 – .008Z12,1 12.16
Jointing Y = 88.18 + 1.75Z1,1 + 1.01Z2,1 – .023Z12,1 11.15
Flowering Y = 71.96 + 1.90Z1,1 + 0.99Z2,1 – .026Z12,1 12.32 Milking Y = 88.85 + 1.16Z1,1 + 1.02Z2,1 – .014Z12,1 12.84
Dough Y = 126.6 + 0.30Z1,1 + 0.93Z2,1 – .001Z12,1 11.22
Irrigated Late Sown Condition
C.R.I Y = 52.54 + 1.04Z1,1 + 0.79Z2,1 – .040Z12,1 11.38 Tillring Y = 59.84 + 2.98Z1,1 + 0.66Z2,1 – .034Z12,1 11.44
Jointing Y = – 28.9 + 2.7Z1,1 + 0.23Z2,1 – .029Z12,1 10.03
Flowering Y = – 37.4 + 2.2Z1,1 + 0.32Z2,1 – .022Z12, 1 11.96 Milking Y = – 54.6 + 1.7Z1,1 +
0.23Z2,1 – .001Z12, 1 10.38
value of yearly spot blotch severity in susceptible
genotypes for the period 2016-17 obtained as 73.08% (with RMSE value 11.31), 75.01 % (with RMSE value 11.18) and 52.00 % (with RMSE value 13.16) at ITS,
ILS and RFTS conditions respectively.
In the same cropping season forecasting value of yearly spot blotch severity in resistant genotype
obtained as 37.95% (with RMSE value 11.15), 43.91% (with RMSE value 10.03) and 38.60% at ITS, ILS and
RFTS conditions respectively.
Conclusion
The higher values of rTw and rTRHw between the
jointing and flowering growth stages indicates that duration between 8th week and 11th week from the
date of sowing is very critical for the spot blotch progression in wheat. Therefore, proper care is required in this duration to restrict the progression of spot blotch. On the basis of lower RMSE value at jointing stage forecasted values of yearly spot blotch severity in susceptible genotype for the period
2016-17 were obtained as 73.08 %, 75.01% and 52.00% for
ITS, ILS and RFTS sowing conditions respectively. For the same period forecasted values of spot blotch
disease severity were obtained as 37.95 %, 43.91 % and 38.60 % for ITS, ILS and RFTS conditions
respectively in the case of resistant genotypes.
Acknowledgements
The authors are thankful to the ICAR-Indian
Institute of Wheat and Barley Research Karnal
Rainfed Timely Sown Condition
C.R.I Y = – 1.6 + 10.2Z1,1 – 0.85Z2,1 – .135Z12,1 12.28 Tillring Y = 115.3 – 1.92Z1,1 + 2.35Z2,1 + .034Z12,1 11.90
Jointing Y = 96.13 – 1.12Z1,1 + 0.73Z2,1 – .009Z12,1 10.12
Flowering Y = 118.4 – 0.16Z1,1 + 0.80Z2,1 – .012Z12,1 10.94 Milking Y = 95.13 + 0227Z1,1 + 0.80Z2,1 + .007Z12,1 13.71
Dough Y = 86.65 + 0.42Z1,1 + 0.83Z2,1 + .004Z12,1 13.52
Table 6: Forecasted values of yearly spot blotch severity (%) for cropping season 2015-16 and 2016-17
Growth stages
Forecasted values of spot blotch severity (%) in Susceptible Genotypes
ITS ILS RFTS
2015-16 2016-17 2015-16 2016-17 2015-16 2016-17
CRI 74.50 74.57 72.78 72.63 63.11 62.93
Tillering 72.12 72.10 71.95 71.85 64.50 64.39
Jointing 73.09 73.08 75.32 75.01 52.13 52.00
Milking 71.67 71.61 72.70 72.63 62.15 61.97
Flowering 70.82 70.72 74.45 73.01 64.00 63.85
Dough 67.07 66.80 75.67 75.01 67.18 67.32
Forecasted values of spot blotch severity (%) in Resistant Genotypes
ITS ILS RFTS
2015-16 2016-17 2015-16 2016-17 2015-16 2016-17
CRI 43.08 44.17 44.01 43.91 45.33 45.54
Tillering 38.13 37.98 43.33 43.39 39.15 39.09
Jointing 38.10 37.95 43.99 43.91 38.69 38.60
Milking 41.19 41.12 46.16 46.34 39.40 39.40
Flowering 37.65 37.50 45.48 45.60 40.10 40.08
(Indian Council of Agricultural Research) India
and India Meteorological Department, New Delhi
(India) for providing data to carry out the present study.
References
Dubin, H.J. 1984. Regional and in-country activities: Andean
region, Report on wheat improvement 1981. CIMMYT,
Mexico D.F.:102-104
Duveiller,E., Kandel, Y.R., Sharma, R.C. and Shrestha, S.M.
2005. Epidemilogy of Foliar Blights (Spot Blotch and
Tan Spot) of wheat in Plains Bordering the Himalayas. Phytopathology95:248-256.
Gilchrist, L.I. and Pfeiffer, W.H. 1991. Resistant to Helminthosporium sativum in bread wheat: Relation ship of infected plant parts and the association of agronomic
traits :Wheat for the Nontraditional, Warm Areas, D.A. saunders, ed, CIMMYT, Mexico, D.F.:473-476
Ho, S.L., Xie, M. and Goh, T.N. 2002. A comparative study of neural network and Box-Jenkins ARIMA modeling in
time series prediction. Computers and Industrial Engineering
42:371– 375.
Joshi, A.K., G.Ortiz-Ferrara J. Crossa, R. Chand, G. Alvarado, M.R. Bhatta, E. Duveiller, G. Singh, R.C. Sharma, D.B. Pandit, M.M.A.B. Siddique, S.Y. Das and Sharma, R.N.
2007. Associations of environments of South Asia based
on spot blotch disease of wheat caused by Bipolaris
sorokiniana.Crop Sciences 43:1071- 1081.
Joshi, A.K., Chand, R. and Arun, B. 2002. Relation of plant
height and days to maturity with resistant to spot blotch in wheat (Triticum aestivum). Euphytica 123: 221-278. Kumari, P., Mishra, G.C. and Srivastava C.P. 2013. Forecasting
of productivity and pod damage by Helicoverpa armigera
using Artificial neural network model in Pigeonpea (Cajanus cajan). International Journal of Agriculture, Environment and Biotechnology6: 335-340.
Kumari, P., Mishra G.C .and Srivastava, C.P. 2014. Time series forecasting of losses due to pod borer, pod fly and
productivity of pigeonpea (Cajanus cajan) for North West
Plain Zone (NWPZ) by using artificial neural network
(ANN). International Journal of Agricultural and Statistical
Science10: 15-21.
Mishra,G.C. and Singh, A. 2013. A study on forecasting,
prices of groundnut oil in Delhi by ARIMA methodology and Artificial Neural Networks. AGRIS online papers in Economics and Informatics5: 25-34.
Nema, K.G. and Joshi, L.H. 1973. Spot blotch disease of wheat
in relation to host age, temperature and moisture. Indian
Phytopathol.,26:41-48.
Paul R.A., Prajneshu and Ghosh, H. 2013. Statistical modelling
for forecasting of wheat yield based on weather variables.
Indian Journal of Agricultural Sciences83: 60-63.
Rosegrant, M.W., Agcaoili-Sombilla, A. and Perez, N. 1995.
Global food projections to 2020. Discussion paper 5. Washington, D.C: IFPRI.
Sharma, R.C. and Duveiller, E. 2004. Effect of Helminthosoporium leaf blight on performance of
timely and late seeded wheat under optimal and stressed
levels of Soil fertility and moisture. Field Crop Research
89: 205-218.
Shukla, G., Mishra, G.C. and Singh, S.K. 2015. Kriging approach for estimating deficient micronutrients in the
soil: A case study. International Journal of Agriculture,
Environment and Biotechnology8: 309-314.
Van Ginkel, M. and Rajaram, S. 1998. Breeding for resistance to spot blotch in wheat: Global perspective. In: Duveiller E, Dubin HJ, Reeves J, McNab A (eds) Helminthosporium
Blights of Wheat: Spot Blotch and Tan Spot. CIMMYT,
Mexico DF. Pp. 162-169.
Zhang, G.P. 2003. Time series forecasting using a hybrid
ARIMA and neural network model. Neurocomputing50: