C H A P T E R 1
System Behavior and
Causal Loop Diagrams
H
uman beings are quick problem solvers. From an evolutionary standpoint, this makes sense—if a sabertooth tiger is bounding toward you, you need to quickly decide on a course of action, or you won’t be around for long. Thus, quick problem solvers were the ones who survived. We quickly determine acausefor anyevent that we think is a problem. Usually we conclude that the cause is another event. For example, if sales are poor (the event that is a problem), then we may conclude that this is because the sales force is insufficiently motivated (the event that is the cause of the problem).
This approach works well for simple problems, but it works less well as the problems get more complex, for example in addressing management problems which are cross-functional or strategic. General Motors illustrates the issue. For over half a century, GM dominated the automotive industry. GM’s difficulties did not come from a lightning attack by Japanese auto manufacturers. GM had a couple of decades to adapt, but today it is still attempting to find a way to its former dominance, more than three decades after the start of Japanese auto-mobile importation. During this period, many of GM’s employees and managers have turned over, but the company still has difficulty adjusting. There seems to be something about the way that GM is put together that makes its behavior hard to change.
1.1 Systems Thinking
The methods of systems thinking provide us with tools for better understand-ing these dif ficult management problems. The methods have been used for over thirty years (Forrester 1961) and are now well established. However, these approaches require a shift in the way we think about the performance of an orga-nization. In particular, they require that we move away from looking at isolated
2 CHAPTER 1 SYSTEM BEHAVIOR AND CAUSAL LOOP DIAGRAMS
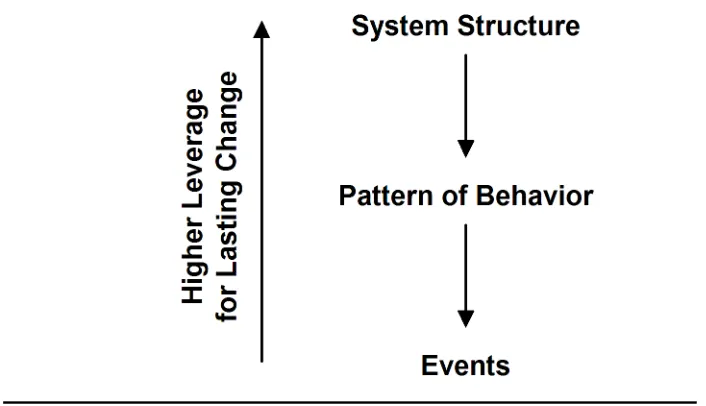
Figure 1.1 Looking for high leverage
We use the term system to mean an interdependent group of items forming a unified pattern. Since our interest here is in business processes, we will focus on systems of people and technology intended to design, market, produce, and distribute products or services. Almost everything that goes on in business is part of one or more systems. As noted above, when we face a management problem we tend to assume that some external event caused it. With a systems approach, we take an alternative viewpoint—namely that the internal structure of the system is often more important than external events in generating the problem.
This is illustrated by the diagram in Figure 1.1.1Many people try to explain
business performance by showing how one set of events causes another or, when they study a problem in depth, by showing how a particular set of events is part of a longer termpattern of behavior. The difficulty with this “events causes events” orientation is that it doesn’t lead to very powerful ways to alter the undesirable performance. This is because you can always find yet another event that caused the one that you thought was the cause. For example, if a new product is not selling (the event that is a problem), then you may conclude that this if because the sales force is not pushing it (the event that is the cause of the problem). However, you can then ask why the sales force is not pushing it (another problem!). You might then conclude that this is because they are overworked (the cause of your new problem). But you can then look for the cause of this condition. You can continue this process almost forever, and thus it is difficult to determine what to do to improve performance.
1 Figure 1.1 and this discussion of it are based on class notes by John Sterman of the MIT Sloan
1.2 PATTERNS OF BEHAVIOR 3
If you shift from this event orientation to focusing on the internal system structure, you improve your possibility of improving business performance. This is because system structure is often the underlying source of the difficulty. Un-less you correct system structure deficiencies, it is likely that the problem will resurface, or be replaced by an even more difficult problem.
1.2 Patterns of Behavior
To start to consider system structure, you first generalize from the specific events associated with your problem to consideringpatterns of behaviorthat character-ize the situation. Usually this requires that you investigate how one or more variables of interest change over time. (In a business setting, variables of in-terest might be such things as cost, sales, revenue, profit, market share, and so forth.) That is, whatpatterns of behaviordo these variables display. The systems approach gains much of its power as a problem solving method from the fact that similar patterns of behavior show up in a variety of different situations, and the underlying system structures that cause these characteristic patterns are known. Thus, once you have identified a pattern of behavior that is a problem, you can look for the system structure that is know to cause that pattern. By finding and modifying this system structure, you have the possibility of permanently eliminating the problem pattern of behavior.
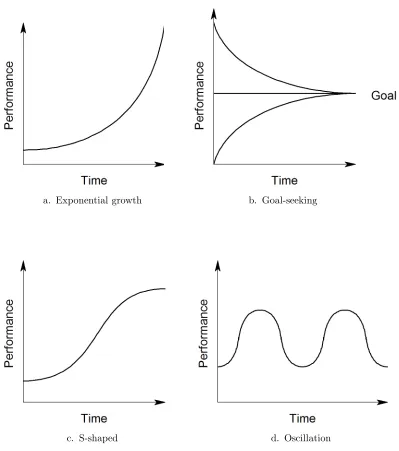
The four patterns of behavior shown in Figure 1.2 often show up, either in-dividually or in combinations, in systems. In this figure, “Performance” refers to some variable of interest. This is often a measure of financial or operational effectiveness or efficiency. In this section, we summarize the characteristics of these patterns. In later sections, we examine the types of system structures which generate these patterns.2
With exponential growth (Figure 1.2a), an initial quantity of something starts to grow, and the rate of growth increases. The term “exponential growth” comes from a mathematical model for this increasing growth process where the growth follows a particular functional form called the exponential. In business processes, the growth may not follow this form exactly, but the basic idea of accelerating growth holds. This behavior is what we would like to see for sales of a new product, although more often sales follow the s-shaped curve discussed below.
With goal-seeking behavior (Figure 1.2b), the quantity of interest starts either above or below a goal level and over time moves toward the goal. Figure 1.2b shows two possible cases, one where the initial value of the quantity is above the goal, and one where the initial value is below the goal.
Withs-shaped growth(Figure 1.2c), initial exponential growth is followed by goal-seeking behavior which results in the variable leveling off.
2 The following discussion draws on Senge (1990), Senge et al (1994), and notes from
4 CHAPTER 1 SYSTEM BEHAVIOR AND CAUSAL LOOP DIAGRAMS
a. Exponential growth b. Goal-seeking
c. S-shaped d. Oscillation
1.3 FEEDBACK AND CAUSAL LOOP DIAGRAMS 5
With oscillation (Figure 1.2d), the quantity of interest fluctuates around some level. Note that oscillation initially appears to be exponential growth, and then it appears to be s-shaped growth before reversing direction.
Common combinations of these four patterns include
• Exponential growth combined with oscillation. With this pattern, the general trend is upward, but there can be declining portions, also. If the magnitude of the oscillations is relatively small, then growth may plateau, rather than actually decline, before it continues upward.
• Goal-seeking behavior combined with an oscillation whose amplitude grad-ually declines over time. With this behavior, the quantity of interest will overshoot the goal on first one side and then the other. The amplitude of these overshoots declines until the quantity finally stabilizes at the goal. • S-shaped growth combined with an oscillation whose amplitude gradually
de-clines over time.
1.3 Feedback and Causal Loop Diagrams
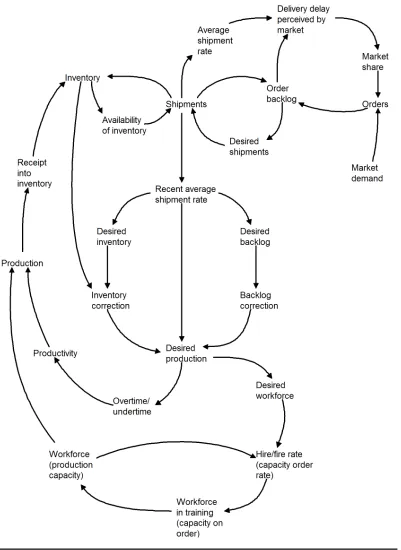
To better understand the system structures which cause the patterns of behavior discussed in the preceding section, we introduce a notation for representing sys-tem structures. The usefulness of a graphical notation for representing syssys-tem structure is illustrated by the diagram in Figure 1.3 which is adapted from a figure in Richardson and Pugh (1981). This shows the relationships among the elements of a production sector within a company. In this diagram, the short descriptive phrases represent the elements which make up the sector, and the arrows represent the causal influences between these elements. For example, ex-amining the left hand side of the diagram, we see that “Production” is directly influenced by “Workforce (production capacity)” and “Productivity.” In turn, “Production” influences “Receipt into inventory.”
This diagram presents relationships that are difficult to verbally describe be-cause normal language presents interrelations in linear be-cause-and-effect chains, while the diagram shows that in the actual system there are circular chains of cause-and-effect. Consider, for example, the “Inventory” element in the upper left-hand corner of the diagram. We see from the diagram that “Inventory” in-fluences “Availability of inventory,” which in turn inin-fluences “Shipments.” To this point in the analysis, there has been a linear chain of cause and effect, but continuing in the diagram, we see that “Shipments” influence “Inventory.” That is, the chain of causes and effects forms a closed loop, with “Inventory” influenc-ing itself indirectly through the other elements in the loop. The diagram shows this more easily than a verbal description.
6 CHAPTER 1 SYSTEM BEHAVIOR AND CAUSAL LOOP DIAGRAMS
1.3 FEEDBACK AND CAUSAL LOOP DIAGRAMS 7
action and information (Richardson and Pugh 1981). The reason for emphasiz-ing feedback is that it is often necessary to consider feedback within management systems to understand what is causing the patterns of behavior discussed in the preceding section and shown in Figure 1.2. That is, the causes of an observed pattern of behavior are often found within the feedback structures for a man-agement system.
To complete our presentation of terminology for describing system structure, note that a linear chain of causes and effects which does not close back on itself is called anopen loop. An analysis of causes and effects which does not take into account feedback loops is sometimes called open loop thinking, and this term usually has a pejorative connotation—it indicates thinking that is not taking the full range of impacts of a proposed action into account.
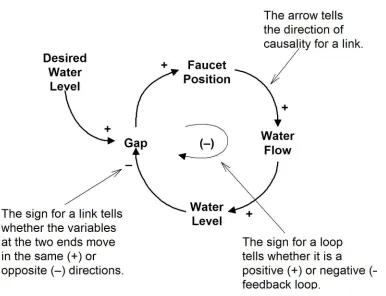
A map of the feedback structure of a management system, such as that shown in Figure 1.3, is a starting point for analyzing what is causing a particular pattern of behavior. However, additional information aids with a more complete analysis. Figure 1.4 defines notation for this additional information. This figure is an annotatedcausal loop diagram for a simple process, filling a glass of water. This diagram includes elements and arrows (which are called causal links) linking these elements together in the same manner as shown in Figure 1.3, but it also includes a sign (either + or −) on each link. These signs have the following meanings:
1 A causal link from one element A to another element B ispositive (that is, +) if either (a) A adds to B or (b) a change in A produces a change in B in thesame direction.
2 A causal link from one element A to another element B isnegative (that is, −) if either (a) A subtracts from B or (b) a change in A produces a change in B in theopposite direction.
This notation is illustrated by the causal loop diagram in Figure 1.4. Start from the element “Faucet Position” at the top of the diagram. If the faucet position is increased (that is, the faucet is opened further) then the “Water Flow” increases. Therefore, the sign on the link from “Faucet Position” to “Water Flow” is positive. Similarly, if the “Water Flow” increases, then the “Water Level” in the glass will increase. Therefore, the sign on the link between these two elements is positive.
8 CHAPTER 1 SYSTEM BEHAVIOR AND CAUSAL LOOP DIAGRAMS
Figure 1.4 Causal loop diagram notation
the definition of “Gap” given above, the influence is in the same direction along this link, and therefore the sign on the link is positive.
In addition to the signs on each link, a complete loop also is given a sign. The sign for a particular loop is determined by counting the number of minus (−) signs on all the links that make up the loop. Specifically,
1 A feedback loop is called positive, indicated by a + sign in parentheses, if it contains an even number of negative causal links.
2 A feedback loop is called negative, indicated by a−sign in parentheses, if it contains an odd number of negative causal links.
1.4 SYSTEM STRUCTURE AND PATTERNS OF BEHAVIOR 9
Figure 1.5 Positive (reinforcing) feedback loop: Growth of bank balance
An alternative notation is used in some presentations of causal loop diagrams. With this alternate notation, a lower case s is used instead of a + on a link, and a lower case o is used instead of a −. The s stands for “same,” and the o stands for “opposite,” indicating that the variables at the two ends of the link move in either the same direction (s) or opposite directions (o). For the loops, a capital R is used instead of (+), and a capital B is used instead of (−). The R stands of “reinforcing,” and the B stands for “balancing.” The reason for using these specific terms will become clearer as we discuss the patterns of behavior associated with different system structures in the next section.
1.4 System Structure and Patterns of Behavior
This section presents simple structures which lead to the typical patterns of be-havior shown earlier in Figure 1.2. While the structures of most management systems are more complicated than those shown here, these structures are build-ing blocks from which more complex models can be constructed.
Positive (Reinforcing) Feedback Loop
10 CHAPTER 1 SYSTEM BEHAVIOR AND CAUSAL LOOP DIAGRAMS
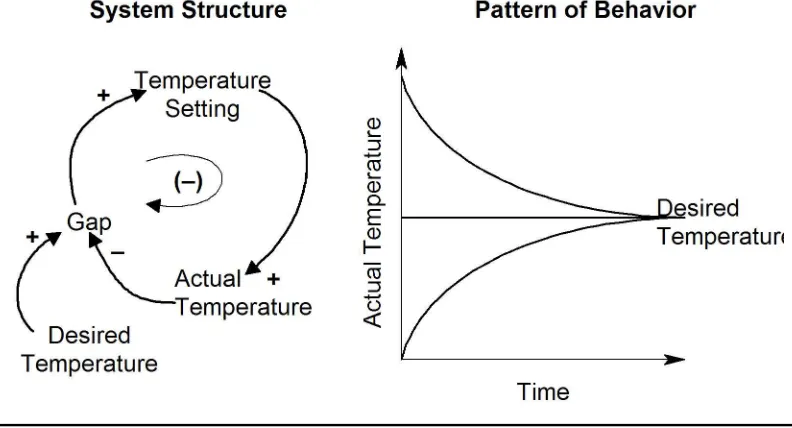
Figure 1.6 Negative (balancing) feedback loop: Regulating an elective blanket
growing slowly. By the time the growth speeds up, it may be too late to solve whatever problem this growth is creating. Examples that some people believe fit this category include pollution and population growth. Figure 1.5 shows a well know example of a positive feedback loop: Growth of a bank balance when interest is left to accumulate.
Sometimes positive feedback loops are called vicious or virtuous cycles, de-pending on the nature of the change that is occurring. Other terms used to describe this type of behavior include bandwagon effects or snowballing.
Negative (Balancing) Feedback Loop
1.4 SYSTEM STRUCTURE AND PATTERNS OF BEHAVIOR 11
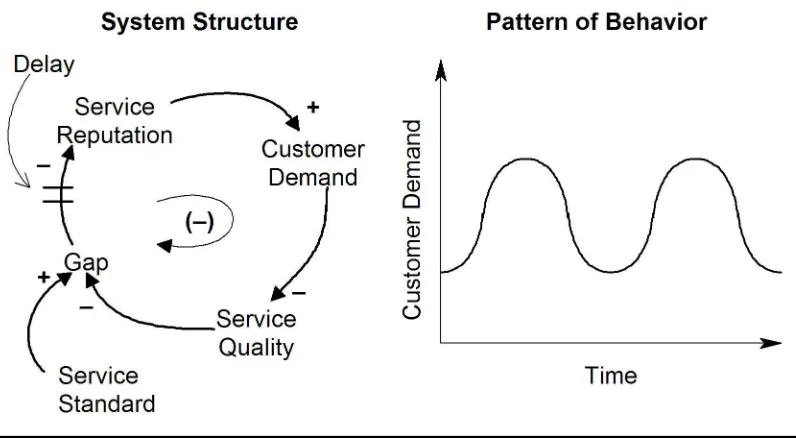
Figure 1.7 Negative feedback loop with delay: Service quality
Negative Feedback Loop with Delay
A negative feedback loop with a substantial delay can lead to oscillation. The specific behavior depends on the characteristics of the particular loop. In some cases, the value of a variable continues to oscillate indefinitely, as shown above. In other cases, the amplitude of the oscillations will gradually decrease, and the variable of interest will settle toward a goal. Figure 1.7 illustrates negative feedback with a delay in the context of service quality. (This example assumes that there are fixed resources assigned to service.)
12 CHAPTER 1 SYSTEM BEHAVIOR AND CAUSAL LOOP DIAGRAMS
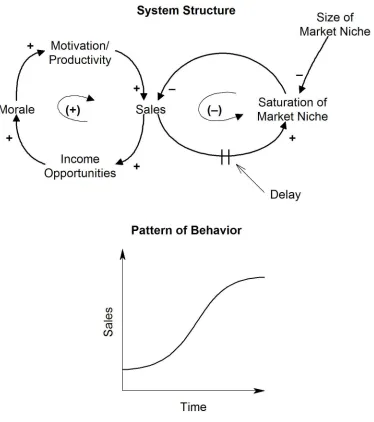
Figure 1.8 Combination of positive and negative loops: Sales growth
Combination of Positive and Negative Loops
1.5 CREATING CAUSAL LOOP DIAGRAMS 13
Most growth processes have limits on their growth. At some point, some resource limit will stop the growth. As Figure 1.8 illustrates, growth of sales for a new product will ultimately be slowed by some factor. In this example, the limiting factor is the lack of additional customers who could use the product.
1.5 Creating Causal Loop Diagrams
To start drawing a causal loop diagram, decide whichevents are of interest in developing a better understanding of system structure. For example, perhaps sales of some key product were lower than expected last month. From these events, move to showing (perhaps only qualitatively) the pattern of behavior
over time for the quantities of interest. For the sales example, what has been the pattern of sales over the time frame of interest? Have sales been growing? Oscillating? S-shaped? Finally, once the pattern of behavior is determined, use the concepts of positive and negative feedback loops, with their associated generic patterns of behavior, to begin constructing a causal loop diagram which will explain the observed pattern of behavior.
The following hints for drawing causal loop diagrams are based on guidelines by Richardson and Pugh (1981) and Kim (1992):
1 Think of the elements in a causal loop diagram asvariables which can go up or down, but don’t worry if you cannot readily think of existing measuring scales for these variables.
• Use nouns or noun phrases to represent the elements, rather than verbs. That is, the actions in a causal loop diagram are represented by the links (arrows), and not by the elements. For example, use “cost” and not “increasing cost” as an element.
• Be sure that the definition of an element makes it clear which direction is “up” for the variable. For example, use “tolerance for crime” rather than “attitude toward crime.”
• Generally it is clearer if you use an element name for which the positive sense is preferable. For example, use “Growth” rather than “Contrac-tion.”
• Causal links should imply a direction of causation, and not simply a time sequence. That is, a positive link from element A to element B does not mean “first A occurs and then B occurs.” Rather it means, “when A increases then B increases.”
2 As you construct links in your diagram, think about possible unexpected side effects which might occur in addition to the influences you are drawing. As you identify these, decide whether links should be added to represent these side effects.
14 CHAPTER 1 SYSTEM BEHAVIOR AND CAUSAL LOOP DIAGRAMS
4 A difference between actual and perceived states of a process can often be important in explaining patterns of behavior. Thus, it may be important to include causal loop elements for both the actual value of a variable and the perceived value. In many cases, there is a lag (delay) before the actual state is perceived. For example, when there is a change in actual product quality, it usually takes a while before customers perceive this change.
5 There are often differences between short term and long term consequences of actions, and these may need to be distinguished with different loops. For example, the short term result of taking a mood altering drug may be to feel better, but the long run result may be addiction and deterioration in health.
6 If a link between two elements needs a lot of explaining, you probably need to add intermediate elements between the two existing elements that will more clearly specify what is happening.
7 Keep the diagram as simple as possible, subject to the earlier points. The purpose of the diagram is not to describe every detail of the management process, but to show those aspects of the feedback structure which lead to the observed pattern of behavior.
1.6 References
J. W. Forrester, Industrial Dynamics, The MIT Press, Cambridge, Mas-sachusetts, 1961.
D. H. Kim, “Toolbox: Guidelines for Drawing Causal Loop Diagrams,”The Sys-tems Thinker, Vol. 3, No. 1, pp. 5–6 (February 1992).
G. P. Richardson and A. L. Pugh III,Introduction to System Dynamics Modeling with DYNAMO, Productivity Press, Cambridge, Massachusetts, 1981. P. M. Senge, The Fifth Discipline: The Art and Practice of the Learning
Orga-nization, Doubleday Currency, New York, 1990.