Ormestad
et al.
D A T A B A S E
Open Access
A comparative gene expression database for
invertebrates
Mattias Ormestad, Mark Q Martindale and Eric Röttinger
*Abstract
Background:As whole genome and transcriptome sequencing gets cheaper and faster, a great number of‘exotic’ animal models are emerging, rapidly adding valuable data to the ever-expanding Evo-Devo field. All these new organisms serve as a fantastic resource for the research community, but the sheer amount of data, some published, some not, makes detailed comparison of gene expression patterns very difficult to summarize - a problem sometimes even noticeable within a single lab. The need to merge existing data with new information in an organized manner that is publicly available to the research community is now more necessary than ever.
Description:In order to offer a homogenous way of storing and handling gene expression patterns from a variety of organisms, we have developed the first web-based comparative gene expression database for invertebrates that allows species-specific as well as cross-species gene expression comparisons. The database can be queried by gene name, developmental stage and/or expression domains.
Conclusions:This database provides a unique tool for the Evo-Devo research community that allows the retrieval, analysis and comparison of gene expression patterns within or among species. In addition, this database enables a quick identification of putative syn-expression groups that can be used to initiate, among other things, gene regulatory network (GRN) projects.
Background
Laboratories which use well-established developmental biology model systems have recognized the importance of species-specific databases and developed extensive tools for their community, for example Zfin (zebrafish, http://zfin.org) [1], MEPD (medaka, http://ani.embl. de:8080/mepd/) [2], FlyBase (Drosophila, http://flybase. org[3], BDGB (Drosophila, http://www.fruitfly.org/DGC/ index.html) [4], WormBase (C. elegans, http://wormbase. org), Aniseed (Ciona, http://aniseed-ibdm.univ-mrs.fr/), Gene Expression Database (GXD) at MGI (mouse, http://www.informatics.jax.org/) [5-7]) EMAGE (mouse, http://www.emouseatlas.org) ([8-10]), XENBASE ( Xeno-pus, http://www.xenbase.org) ([11-13]) and a compara-tive database 4DXpress for major animal model species http://ani.embl.de/4DXpress[14]. Recently, efforts have also been made to create databases for emerging model systems such as cnidarians (StellaBase (http://www.stel-labase.org) [15] and PlatynereisPEPD (http://ani.embl.
de:8080/pepd/). These databases are mainly used to combine all available resources (genome, expressed sequence tag’s (EST), transgenes, publications, expres-sion data, and so on) and the large amount of data makes it sometimes tricky to retrieve a simple gene expression pattern and its related information in an intuitive manner.
Although some of these databases offer comparison between taxonomically related species (for example, among tunicates, Aniseed), we know of no user-friendly and intuitive tool for large-scale comparison of gene expression patterns among diverse organisms.
To address questions about functional embryonic development and body plan patterning or evolution, it is crucial to identify genes involved in developmental pro-cesses and tissue specific markers.
The increased feasibility of sequencing projects, due to massively parallel sequencing technologies, is lead-ing to a steady appearance of new data and gene expression patterns from a growing list of formerly understudied species. Currently, comparison of gene expression patterns among species involves numerous
* Correspondence: [email protected]
Kewalo Marine Laboratory, PBRC, University of Hawaii at Manoa, 41, Ahui Street, Honolulu, 96734, HI, USA
hours of searching for the publications of interest. Interpretation of the data may be quite difficult in the case of taxonomically unrelated organisms. In order to collect, manage and facilitate the process of organization and mining of data we have created a freely accessible online comparative gene expression database for invertebrates. We expect this to aid in the study, analysis and interpretation of developmen-tally regulated processes across evolutionary diverse organisms. The following sections will describe the basic features of that database and how to easily identify putative syn-expression groups [16] for further GRN analysis. A more detailed manual of this scientific tool can be downloaded directly from the database website (http://www.kahikai.org/index.php? content=genes).
A comparative gene expression database for invertebrates
As several genomic and/or transcriptome resources are already available for most currently studied species (vertebrate as well as invertebrate models), we focused our interest on an intuitive way to gather, store, make available and compare gene expression patterns of invertebrates. Currently, the database contains data from 18 different species from seven distinct phyla (Ctenophores, Cnidaria, Aceolomorpha, Ecdysozoa, Lophotrochozoa, Echinodermata, Hemichordata), more than 180 genes, 210 experiments (72 ‘unpublished’, that is not accessible to the whole community) and more than 1,300 images. The database is used for stor-ing and browsstor-ing in situ gene expression data as well as immunohistochemistry (IHC) information, compar-ing gene expression patterns within or among species and identifying possible syn-expression groups. The contributor can assign expression data to different experiment types such as wild type expression, drug treatments, mRNA or morpholino injection and so on, providing an easy means of organizing functional stu-dies. The unique aspect of this database is the flexibil-ity of data storage and organization allowing for a set of gene expression patterns whose access can be dis-tributed to a given laboratory, a group of collaborators or the whole community, by the contributor (refer to the online manual for more details). In any case, the data will always be accessible to the current members of a laboratory who can add new experiments to plete missing information (for example stages) or com-plementary information (for example drug treatments, gene perturbation) for a given expression pattern. This database can be accessed from anywhere in the world and is backed up frequently on the host servers http:// www.dreamhost.com, removing this burden from indi-vidual laboratories.
Construction and data integration
The primary objective of this platform is to create one database in which users can easily compare datasets from a diverse selection of organisms. In this first ver-sion of the database we have chosen not to include any sequence information and instead fully concentrate on the comparison of manually annotated expression pat-terns. Since these kinds of comparisons are fairly simple we have chosen to build the site using a PHP/MySQL backend. The manual annotation steps are kept to a minimum in order to keep data uploads homogenous and straightforward for the user. Our database can store all the information required for the MISFISHIE standard (minimum information specification forin situ hybridi-zation and immunohistochemistry (IHC) experiments) ([17,,18]). This format will allow us to integrate other systems and provide the information required to interact and exchange information with other resources in the future.
Integration of this database into an online community
This database is openly accessible via Internet and is hosted on our web community platform ‘Kahi Kai’ (meaning ‘one ocean’in Hawaiian, http://www.kahikai. org), allowing researchers to interact, collaborate, and share their data. All contributions will have a clear iden-tification of the author of the expression pattern and the laboratory they are associated with. Every user can decide if they want to ‘publish’and therefore share the gene expression pattern with the whole community or keep it ‘unpublished’and visible only to a user-defined subset of members (for example the lab where he/she works). These‘unpublished’expression patterns can be made accessible to other groups, allowing collaboration and sharing of unpublished data with other users out-side of the local lab (refer to the online manual). For security reasons and to avoid unsolicited content in our database, unpublished data are also visible to the site administrators and will be handled with the highest con-fidentiality. Our vision is that this database becomes an integral part of the Evo-Devo community and that it will provide a useful tool for ongoing and future collaborations.
Expression data
Gene orthology
groups, may not yet be available. Therefore, we decided not to implement an automatic way to analyze gene orthologies in the first version of this database, but plan to do so when a reliable online platform becomes avail-able. In the meantime each user has responsibility for assigning gene orthology before publishing it within the database (as is the case for peer reviewed articles). All genes that cannot be assigned to a clear ortholog group can be named as XXX-like gene (for example.‘ nodal-like’). Raw sequence data will be available as a Genbank retrieval accession number.
Developmental stages and expression domains
Comparing developmental stages within a single spe-cies does not represent major difficulties and depends on the fine scale precision of the gene expression annotation generated by the user. However, the exis-tence of different life cycles in marine invertebrates within the same phylum (for example echinoids) gives rise to developmental stages (larval stage) within indir-ect developing species that are absent in dirindir-ect develo-pers (no larval phase per se). These differences make comparison between two species a difficult task, and it gets more complicated as a greater number of species are added to the list. So to avoid matching non-com-parable stages in cross-species analysis we decided to compare only broadly accepted parent stages. In table 1, we compare the developmental stages of the cnidar-ian Nematostella vectensis with the acoel flatworm Convolutriloba longifissura and classify the various stages that will be used in the comparison algorithm of our database. Obviously, some temporal resolution is lost when reducing development into only six chrono-logical stages shared among invertebrates, so each par-ent stage is assigned taxon-specific child stages that are used when doing intra-species comparisons of gene expression.
Even more difficult than comparing developmental stages is the comparison of localized gene expression among ‘complex’ animals that possess taxon-specific structures (for example gill slits or tube feet). In order to overcome the issue of comparing non-homologous structures, we defined parent territories that can be sub-divided in species-specific expression domains. In table 2 we show the expression domains defined for the same species as described above (N.vectensisand C. longifis-sura) sorted by broad domains by which it can be argued to be homologous between different taxa.
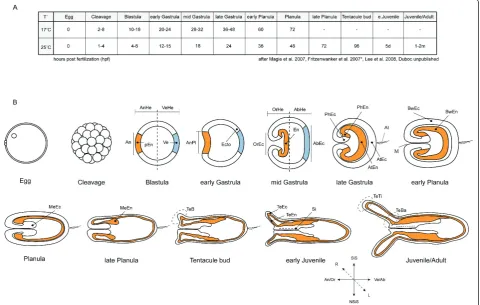
To standardize experiments, developmental stages in a given species should correspond to a time line that reflects distinctive developmental stages based on mor-phological signs and hours of development post fertiliza-tion (hpf) at a given temperature that is shared by all users. The same should be done for expression domains, where expression territories at particular times are
clearly defined and acknowledged by all users. Figure 1 represents such a chart forN. vectensis.
In order to extend this standardization of species-spe-cific developmental stages and expression domains to all species present in the database, we are currently imple-menting a Comparative Embryonic Developmental data-base that will provide an overview of the main developmental steps and morphological structures of a variety of animals. We anticipate that this database may help facilitate the move towards a common set of experimental conditions in studies of a particular organ-ism. In addition, by cross referencing both gene expres-sion and embryology databases we can provide information required for the understanding of species-specific development and expression domains for the non-specialist.
Adding and editing species, genes and experiments
highly recommend the use of original images (that have or have not been used in publications).
A more detailed manual and guidelines can be requested by email or downloaded directly on the web-site. http://www.kahikai.org/index.php?content=genes.
Utility - a case study
In its current state, this database is used to store anno-tated RNA in situ hybridization and IHC information for marine invertebrates that can be searched and com-pared within or between different species. The expres-sion data is assigned to different experiment types such as wild type expression, mRNA or morpholino injection and so on, making it easy to analyze results from func-tional studies. We will present the general aspects of the database and guide the reader through the various query
options and the analysis of the result pages using as examples published endodermal genes expressed in the cnidarianN. vectensis.
Querying the database
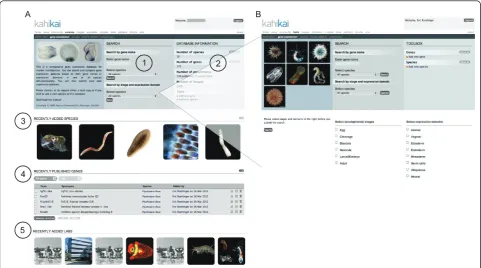
The start page (Figure 2) is divided in several parts that give the user a quick overview of general statistics (Figure 2A.2) of recently added species (Figure 2A.3), recently published genes (Figure 2A.4) and laboratories that recently joined the community (Figure 2A.5). The user has two ways of querying the database (Figure 2A.1); i) by entering a gene name in the search field or ii) by using the advanced search feature that allows querying the database by developmental stage and/or expression domain (Figure 2B). Advanced searches allow cross-species searches among all species present in the
Figure 1Chart defining developmental stages and expression domains inN. vectensis. (A) The twelve main developmental stages of
Nematostella vectensis, according to [24, 25*, 26], Duboc unpublished, *raised at 18°C) and the developmental time required to reach them (in hours post fertilization (hpf), days (d) or month (m)) depending on the temperature of rearing. (B) Schematic representations of the
database by developmental stages and domains to be defined as search values. If the user selects a single spe-cies, the entire list of developmental stages and expres-sion domains of that given species would be apparent and could be used to query the database (not shown).
Query by gene name
Species-specific query
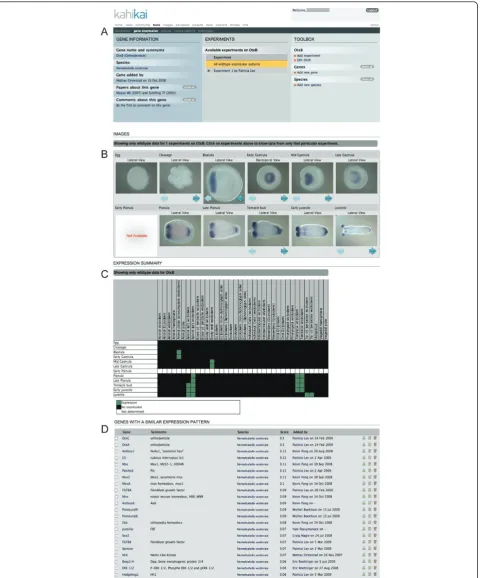
The output of a query by gene name, in this example, the N. vectensistranscription factorotxB, [19] will show gen-eral information about gene, species, contributor and rele-vant publications (Figure 3A left panel). In the center panel the available experiments are listed and the contri-butor (and affiliation) that uploaded the gene expression pattern. Each registered user can add a new experiment that involves otxB expression but only the user that uploaded the selected experiment (in this case Patricia Lee) is authorized to edit information about the experi-ment, add or delete images and edit the gene expression annotation (stages, view and expression domain). Below (Figure 3B) this general information the expression pattern ofotxBis shown and is represented by individual images sorted by developmental stages (by default all wild-type
expression patterns are shown, including wild-type con-trols from perturbation experiments). If several images of the same stage (for example different views) have been uploaded, this is indicated by the presence of the blue arrows at the bottom of each image. By clicking on any image, the user will have access to a single image view (example shown in Figure 4C), providing more informa-tion about the experiment and the opinforma-tion to access a high-resolution image for personal use or scientific presenta-tions (written permission by the author required). The ori-ginal paper should be cited and if an unpublished expression is used the author/laboratory and Kahi Kai should be cited. In addition, a table view (Figure 3C) of developmental stages versus expression domain is pre-sented, where the green cells indicate expression ofotxb. Based on the annotation information provided by each user, the software identifies genes with similar expression patterns (Figure 3D). The similarity score is a percentage of the number of similar stage and/or domain matches in a comparison, and a value of one would correspond to 100% similarity of the annotated gene expression. In our example,otxCand otxAare the most similar genes to otxb. From that proposed list, either an individual gene,
several genes or all genes can be selected for comparison withotxB(Figure 5A).
Cross-species query
In order to compare gene expression patterns across lar-ger evolutionary distances, the user can query the data-base for all species available in the repository. He can do so by entering the gene name (otx) or its synonyms (orthodenticle, otd) into the search field on the starting page and keep the species selector on its default posi-tion (All species) (Figure 4A). The following results page lists all the otxgenes from all the species uploaded into the database. In this example, all three above men-tioned N. vectensis (Cnidaria, [19]), one Ptychodera flava (Hemichordata, [20]), two Parhyale hawaiensis (Ecdysozoa, [21]), one Fungia scutaria(Cnidaria, Loef-fler et al. unpublished) and one Terebratalia transversa (Spiralia, [22] are shown. Clicking the gene name in front of the species name will lead to the entire uploaded expression pattern for that gene in the given animal (data not shown). On the other hand, selecting and comparing all identified genes will lead to a com-parison table that will indicate in what animal otx orthologs are expressed at a similar developmental stage in a similar expression domain. Clicking the yellow square will provide access to the gene expression
patterns in the various species at the given stage. This quick analysis shows that similar to N. vectenis otxA, otxBandotxC, F. scutaria otx is expressed in the phar-yngeal ectoderm in larval stages, and P. flava otx is expressed similarly to all N. vectenis otx in the pre-sumptive endomesoderm (data not shown).
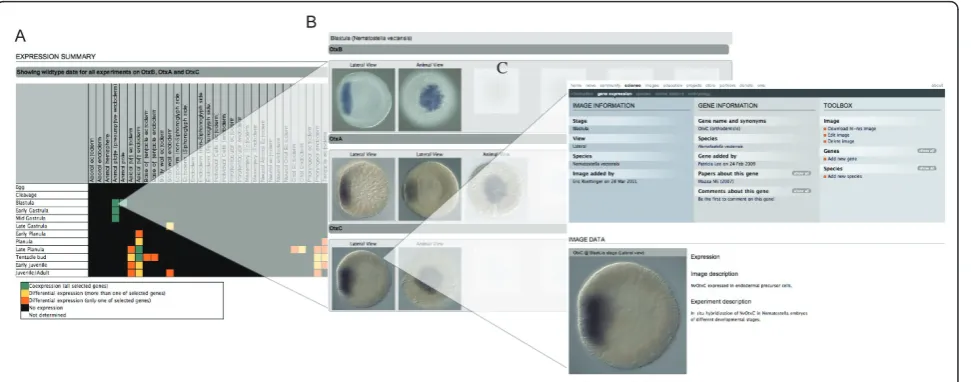
Species-specific comparison of gene expression (otxA, otxB and otxC)
For the following example we selected otxA and otxC and compared it with the initial N. vectensis query otxB (Figure 3B). The default output (Figure 5A) of this comparison is a table (developmental stages versus expression domains) in which all green cells indicate co-expression of the selected genes at that particular combination of stage and domain, suggesting that these genes may be involved in a same biological pro-cess, defining a putative syn-expression group [16]. Yellow cells indicate that at least two of the three genes are co-expressed at that stage in the given domain, while orange, black or white cells indicate that only one gene is expressed, no gene is expressed or no information is available, respectively. By clicking on one of the green cells the images corresponding to the genes co-expressed at the given stage are shown in a new window (Figure 5B), and by selecting an image, a
final window will present detailed information about that particular stage/experiment with the option of downloading the image (Figure 5C). Analysis of these three expression patterns shows that these three cni-darian otx paralogs are co-expressed during most of embryonic development, but that otxC is not detected in the apical domain of the planula larvae, suggesting a differential transcriptional control of these factors in later stages (see [19]).
Species-specific identification of co-expressed genes
The previous example demonstrated that all threeotx genes inN. vectensisare co-expressed at the blastula stage in the presumptive endoderm (animal plate). To further understand the initiation of endoderm formation in cni-darians, it would be useful to identify other genes co-expressed with theotxgenes at the blastula stage. Selecting blastula stage and animal plate (presumptive endoderm) in the advanced search option forN. vectensis(Figure 6A) will result in a list of genes that share those properties (Figure 6B). By selecting and comparing all genes with a high similarity score (corresponding to the query) the resulting comparison table (Figure 6C) indicates in green that indeed all the selected genes are co-expressed at the blastula stage while their expression patterns differ in other stages suggesting different transcriptional controls and additional roles of those genes in a different develop-mental context. Clicking on the green cell will open a new window (Figure 6D) in which all blastula stages of the identified genes are shown for further examination.
Cross-species (Larval/Embryo, Ectoderm)
By using the advanced search function on all species (default value) but defining the simplified and optimized ‘parent’ stage (Larval/Embryo) and the domain (Ecto-derm) as search values the user will obtain a list of genes from all species that fulfill the query require-ments. The steps are similar to the ones described for the species-specific advanced search and will lead to a comparison table that allow the visualization of the given gene expression patterns with access to a more detailed species-specific annotation simply by clicking on the image of interest. This can quickly identify candi-date genes from different species that are expressed with similar developmental patterns.
Functional experiments
The design of our database not only allows storing and analyzing wild type experiments but also the inclusion of functional studies (Figure 7, drug treatments, RNA or RNAi injection, morpholino, and so on). A compila-tion of all wild-type expression patterns (wt, control of Experiment 1, control of Experiment 2, and so on) of a given gene (in this example Paracentrotus lividus nova1) is shown on the results page, as indicated by a yellow bar (Figure 7A). By selecting one of the experi-ments listed (in this case experiment 1) details of the experiments are un-collapsed showing the actual func-tional experiment (LiCl 15mM) and the control it is associated with (Figure 7B). Each functional experi-ment needs to be linked to a control expression
pattern in order to be uploaded. At this stage the user has the option of selecting either the control or the treatment experiment that will open a new window, allowing visualization of all images and associated information (Figure 7C).
Discussion and future directions
The major challenges for data repositories include the initial and continuous input of data into the database and their long-term sustainability. As described by Merali and Giles [23] community-based and driven
Figure 6Species-specific advanced search. (A)A detailed list of all defined developmental stages and expression domains (to reduce the size of the figure some have been omitted) is available for a species-specific advanced search (in this caseNematostella vectensis). By selecting the stage(s) and domain(s) of interest (in this example animal plate (presumptive endoderm) at the blastula stage, indicated by green circles) the user will retrieve (B) a list of genes that fulfill the search criteria. (C) Comparison table obtained after selecting all genes of the result list with a score of one. All green cells indicate that indeed the identified genes are co-expressed in the same domain at the same stage, while their expressions differ in other stages (orange and yellow cells). (D) Clicking on the green cell (in this case the blastula stage), will open a new window in which all blastula stages of the given genes are shown allowing the user to verify the information directly on the submitted images.
databases are generally more successful than projects initiated and maintained by single labs or small research groups. The Evo-Devo field is an interactive and growing community and members are invited to submit their gene expression patterns as well as sug-gestions for improvement to this new database. Cur-rently, the database contains only data from marine invertebrates, but contributions for terrestrial organ-isms are welcome. Our hope is that this will encourage researchers to share their data with the Evo-Devo community through a community platform that acts in parallel to peer-to-peer publications, improves the visi-bility of the published work and fosters scientific interactions.
We hope that community driven projects like this one will help improve the way we publish gene expression data today. Instead of collecting all information in static PDF’s for print, all image data should primarily be anno-tated and published in a searchable and standardized format that then can be summarized for print (with automatic creation of hyperlinks to the online data).
The Kahi Kai non-profit organization is in the process of assembling an international scientific committee from different laboratories. We are considering using part of this committee to screen all added genes to minimize erroneous additions to the database in regard to naming conventions, duplicate entries, orthologies and image orientations. This review process will require all new additions to be put in a queue causing a slight delay (the reviewing time) before the expression data is visible to all users.
To make this tool even more useful, we are planning to add additional features including possibilities to implement qPCR and other quantified expression data such as RNA-seq and microarray that will enable gene regulatory network predictions. Therefore, we will develop tools to organize this information in gene regu-latory networks where each node can be linked to the corresponding data, making it easy to check, confirm and compare relations.
Gene expression patterns are defined by precise devel-opmental stages and embryonic regions/or germ layers of a given species. This information is usually only known by specialists, making comparison between spe-cies for non-specialists sometimes difficult. To facilitate this, we will associate each species present in the data-base with detailed information about their embryonic/ larval development (database in progress). In addition, we anticipate adding illustrations of the developmental stages high-lighting the various domains relevant for the gene expression data (refer to Figure 1). We also con-sider that each species present in the database will be associated with information about habitat, life cycle, feeding behavior, spawning season and advice for
laboratory cultures. This information will also be illu-strated with high-resolution pictures of the animals, which can be used for outreach, education, scientific presentations and publications for example.
We encourage independent Principal Investigators who submit data to open access journals such as Evo-Devo to also submit expression data to the Kahi Kai gene expression database.
Conclusions
The present comparative gene expression database allows storing, querying and sharing of data not only with the research community, but also in a more restricted way with a group of collaborators or at the level of a single laboratory. In its current state, this tool has been used to track and store the content of gene expression patterns from current and former lab mem-bers allowing new studies based on these resources. As described above, a few steps are sufficient to retrieve the expression pattern of a single gene, compare it to genes expressed in a similar way or even identify putative syn-expression groups in order to predict genetic interac-tions that can be tested with functional experiments. All available information is tightly linked to the user as well as the laboratory he is associated with, ensuring that each user and laboratory gets proper credit for their contributions. We have a strong focus on making simple and intuitive interfaces and we believe that this com-parative gene expression pattern database in its current state will be a useful tool for the research community and students interested in zoology, and evolutionary and developmental biology. Further improvements and addi-tions to the existing database in the future will further enhance its usability for the Evo-Devo community. By integrating scientific data, educational material and gen-eral information about animals on a community plat-form we hope to improve scientific outreach as well as provide students and teachers with means to study and to interact directly with the research community.
Availability and requirements
The database can be accessed at: http://www.kahikai. org/index.php?content=genes.
To query the database no restrictions apply. To add, edit or delete data, the user needs to be logged in.
Abbreviations list
GRN: gene regulatory network; hpf: hours post fertilization; IHC: immunochemistry; EST: expressed sequence tag.
Acknowledgements
reading the manuscript and discussion. This project was funded by the European Molecular Biology Organisation, (EMBO; to ER), by the Swedish Research Council, (Vetenskapsrådet; to MO) and by the National Science Foundation (NSF; to MQM).
Authors’contributions
ER and MO conceived and designed the database; MO programmed the database; ER, MO and MQM wrote the article. All authors read and approved the final manuscript.
Competing interests
The authors declare that they have no competing interests. Received: 23 May 2011 Accepted: 24 August 2011 Published: 24 August 2011
References
1. Sprague J, Bayraktaroglu L, Clements D,et al:The Zebrafish Information Network: the zebrafish model organism database.Nucleic Acids Res2006, 34:D581-D585.
2. Heinrich T, Ramialison M, Wittbrodt B,et al:MEPD: a resource for medaka gene expression patterns.Bioinformatics2005,21:3195-3197.
3. Tomancak P, Berman BP, Beaton A,et al:Global analysis of patterns of gene expression during Drosophila embryogenesis.Genome Biol2007,8: R145.
4. Grumbling G, Strelets V:FlyBase: anatomical data, images and queries.
Nucleic Acids Res2006,34:D484-D488.
5. Finger JH, Smith CM, Hayamizu TF,et al:The mouse Gene
Expression Database (GXD): 2011 update.Nucleic Acids Res2011,39: D835-D841.
6. Hill DP, Begley DA, Finger JH,et al:The mouse Gene Expression Database (GXD): updates and enhancements.Nucleic Acids Res2004,32:D568-D571. 7. Smith CM, Finger JH, Hayamizu TF,et al:The mouse Gene Expression
Database (GXD): 2007 update.Nucleic Acids Res2007,35:D618-D623. 8. Christiansen JH, Yang Y, Venkataraman S,et al:R: EMAGE: a spatial
database of gene expression patterns during mouse embryo development.Nucleic Acids Res2006,34:D637-D641.
9. Richardson L, Venkataraman S, Stevenson P,et al:EMAGE mouse embryo spatial gene expression database: 2010 update.Nucleic Acids Res2010, 38:D703-D709.
10. Venkataraman S, Stevenson P, Yang Y,et al:EMAGE–Edinburgh Mouse Atlas of Gene Expression: 2008 update.Nucleic Acids Res2008,36: D860-D865.
11. Bowes JB, Snyder KA, Segerdell E,et al:Xenbase: a Xenopus biology and genomics resource.Nucleic Acids Res2008,36:D761-D767.
12. Bowes JB, Snyder KA, Segerdell E,et al:Xenbase: gene expression and improved integration.Nucleic Acids Res2009,38:D607-D612.
13. Segerdell E, Bowes JB, Pollet N,et al:An ontology for Xenopus anatomy and development.BMC Dev Biol2008,8:92.
14. Haudry Y, Berube H, Letunic I,et al:4DXpress: a database for cross-species expression pattern comparisons.Nucleic Acids Res2008,36: D847-D853.
15. Sullivan JC, Ryan JF, Watson JA,et al:StellaBase: the Nematostella vectensis Genomics Database.Nucleic Acids Res2006,34:D495-D499. 16. Niehrs C, Pollet N:Synexpression groups in eukaryotes.Nature1999,
402:483-487.
17. Deutsch EW, Ball CA, Berman JJ,et al:Minimum information specification for in situ hybridization and immunohistochemistry experiments (MISFISHIE).Nat Biotechnol2008,26:305-312.
18. Deutsch EW, Ball CA, Bova GS,et al:Development of the Minimum Information Specification for In Situ Hybridization and
Immunohistochemistry Experiments (MISFISHIE).OMICS2006,10:205-208. 19. Mazza ME, Pang K, Martindale MQ,et al:Genomic organization gene
structure and developmental expression of three clustered otx genes in the sea anemone Nematostella vectensis.J Exp Zool B Mol Dev Evol2007, 308:494-506.
20. Harada Y, Okai N, Taguchi S,et al:Developmental expression of the hemichordate otx ortholog.Mech Dev2000,91:337-339.
21. Browne WE, Schmid BG, Wimmer EA,et al:Expression of otd orthologs in the amphipod crustacean,Parhyale hawaiensis.Dev Genes Evol2006, 216:581-595.
22. Passamaneck YJ, Furchheim N, Hejnol A,et al:Ciliary photoreceptors in the cerebral eyes of a protostome larva.Evodevo2011,2:6.
23. Merali Z, Giles J:Databases in peril.Nature2005,435:1010-1011. 24. Magie CR, Daly M, Martindale MQ:Gastrulation in the cnidarian
Nematostella vectensis occurs via invagination not ingression.Dev Biol
2007,305:483-497.
25. Fritzenwanker JH, Genikhovich G, Kraus Y,et al:Early development and axis specification in the sea anemone Nematostella vectensis.Dev Biol
2007,310:264-279.
26. Lee PN, Kumburegama S, Marlow HQ,et al:Asymmetric developmental potential along the animal-vegetal axis in the anthozoan cnidarian, Nematostella vectensis, is mediated by Dishevelled.Dev Biol2007, 310:169-186.
doi:10.1186/2041-9139-2-17
Cite this article as:Ormestadet al.:A comparative gene expression database for invertebrates.EvoDevo20112:17.
Submit your next manuscript to BioMed Central and take full advantage of:
• Convenient online submission
• Thorough peer review
• No space constraints or color figure charges
• Immediate publication on acceptance
• Inclusion in PubMed, CAS, Scopus and Google Scholar
• Research which is freely available for redistribution