G.Visalatchi et al, International Journal of Computer Science and Mobile Applications,
Vol.2 Issue. 2, February- 2014, pg. 100-105 ISSN: 2321-8363
©2014, IJCSMA All Rights Reserved, www.ijcsma.com 100
A Survey on Data Mining Methods and
Techniques for Diabetes Mellitus
G.Visalatchi
1, S.J Gnanasoundhari
2, Dr.M.Balamurugan
3 1School of Computer Science and Engineering, Bharathidasan University Tiruchirappalli-620023, India
2
School of Computer Science and Engineering, Bharathidasan University Tiruchirappalli-620023, India
3
School of Computer Science and Engineering, Bharathidasan University Tiruchirappalli-620023, India
Abstract
Detection of knowledge patterns in clinical data through data mining. Data mining algorithms can be trained from past examples in clinical data and model the frequent times non-linear relationships between the independent and dependent variables. The consequential model represents formal knowledge, which can often make available a good analytic judgment. Classification is the generally used technique in medical data mining. This paper presents results comparison of five supervised data mining algorithms. We evaluate the performance for C4.5, SVM, k-NN, Naïve Bayes and Apriori then Comparison a performance of data mining algorithms based on accuracy. The study describes algorithmic discussion of the dataset for the disease acquired from on line repository of large datasets.
Keywords- C4.5, SVM, K-NN, Apriori, Naive Bayes.
I.INTRODUCTION
G.Visalatchi et al, International Journal of Computer Science and Mobile Applications,
Vol.2 Issue. 2, February- 2014, pg. 100-105 ISSN: 2321-8363
©2014, IJCSMA All Rights Reserved, www.ijcsma.com 101
II.DATA ANALYSIS
The most important methodology use for this paper throughout the analysis of journals and publications in the field of medicine. The explore focused on more recent publications. The data study consists of diabetes dataset. It includes name of the attribute as well as the explanation of the attributes. Indian Council of Medical Research– Indian Diabetes study has provides data from three states and one Union Territory, representing nearly 18.1 percent of the nation’s population.
The occurrences of pre-diabetes (impair fasting glucose or impair glucose tolerance was 8.3 percent, 12.8 percent, 8.1 percent, 14.6 percent correspondingly. Nineteen years to the lead of that deadline, India has 62.4 million, and further 77.2 million in the pre-diabetes period. According to the diabetes atlas of 2009, there were 50.8 million people with diabetes in India [4].
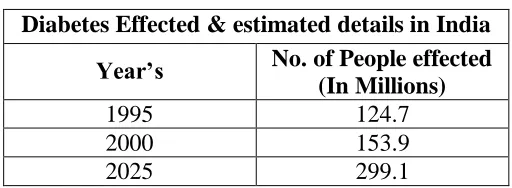
Table 1 Increasing occurrence of Diabetes: India
Diabetes Effected & estimated details in India
Year’s
No. of People effected
(In Millions)
1995
124.7
2000
153.9
2025
299.1
The chart express the increase prevalence of diabetes in India, approximation in 2025, there were 299.1 millions of people effect in diabetes. The occurrence of diabetes in Tamilnadu was 10.4 percent, in Maharashtra it was 8.4 percent, in Jharkhand 5.3 percent, and in terms of percentage, highest in Chandigarh at 13.6 percent. [3]
III.ALGORITHMS USED
1. C4.5 Algorithm:
Decision trees are controlling categorization algorithms. Accepted decision tree algorithms consist of C4.5. At the equivalent time as the name imply, this performance recursively sep-arate inspection in branches to build tree for the purpose of improving the calculation accuracy. Systems that construct classifiers are one of the commonly used tools in data mining. Such systems take as input a collection of cases, each belong-ing to one of a small number of classes and described by its values for a fixed set of attributes, and output a classifier that can accurately predict the class to which a new case belongs. C4.5 generates classifiers expressed as decision trees, but it can also construct classifiers in more comprehensible rule set form [2].
2.
The K-Nearest Neighbour Algorithm:The k-nearest neigh-bour’s algorithm is a technique for classifying objects based on the next training data in the feature space. It is among simplest of all mechanism learning algorithms. The algorithm op-erates on a set of
d-dimensional vectors, D = {x
i | i = 1. . . N}, where xi ∈k
d
denotes the i th data point. The algorithm is ini-tialized by
selection k points in kd as the initial k cluster repre-sentatives or “centroids”. Techniques for select these primary seeds include sampling at random from the dataset, setting them as the solution of clustering a small subset of the data or perturbing the global mean of the data k times. Then the algorithm iterates between two steps till junction:
Step 1: Data Assignment each data point is assign to its adjoin-ing centroid, with ties broken arbitrarily. This results in a par-titioning of the data.
G.Visalatchi et al, International Journal of Computer Science and Mobile Applications,
Vol.2 Issue. 2, February- 2014, pg. 100-105 ISSN: 2321-8363
©2014, IJCSMA All Rights Reserved, www.ijcsma.com 102
3
. Naive Bayes Algorithm:Naïve Bayes Classifier is a term dealing with simple probabilistic classifier based on applying Bayes Theorem with strong independence assumptions. It assumes that the presence or absence of particular feature of a class is unrelated to the presence or absence of any other feature [10].
The Naive Bayes algorithm is based on conditional probabilities. It uses Bayes' theorem, a formula that calculates a probability by counting the frequency of values and combinations of values in the historical data. Bayes' Theorem finds the probability of an event occurring given the probability of another event that has already occurred. If B represents the dependent event and A represents the prior event, Bayes' theorem can be stated as follows. Prob (B given A) = Prob (A and B)/Prob (A)
To calculate the probability of B given A, the algorithm counts the number of cases where A and B occur together and divides it by the number of cases where A occurs alone [7].
4. Support Vector Machines (Svm):
Support vector machines are a moderately new-fangled type of learning algorithm, originally introduced. Naturally, SVM aim at pointed for the hyper plane that most excellent separates the classes of data. SVMs have confirmed the capability not only to accurately separate entities into correct classes, but also to identify instance whose establish classification is not supported by data. Although SVM are comparatively insensitive define distribution of training examples of each class.
SVM can be simply extended to perform numerical calculations. Two such extension, the first is to extend SVM to execute regression analysis, where the goal is to produce a linear function that can fairly accurate that target function. An extra extension is to learn to rank elements rather than producing a classification for individual elements. Ranking can be reduced to comparing pairs of instance and producing a +1 estimate if the pair is in the correct ranking order in addition to −1 otherwise [6].
5. The Apriori Algorithm:
One of the most popular data mining approaches is to find frequent itemsets from a transaction dataset and derive association rules. Finding frequent itemsets (itemsets with frequency larger than or equal to a user specified minimum sup-port) is not trivial because of its combinatorial explosion. Once frequent itemsets are obtained, it is straightforward to generate association rules with confidence larger than or equal to a user specified minimum confidence. Apriori is a seminal algorithm for finding frequent itemsets using candi-date generation. It is characterized as a level-wise complete search algorithm using anti-monotonicity of itemsets, “if an itemset is not frequent, any of its superset is never frequent”. By convention, Apriori assumes that items within a transac-tion or itemset are sorted in lexicographic order. Let the set of frequent itemsets of size k be F
k and their candidates be Ck .
G.Visalatchi et al, International Journal of Computer Science and Mobile Applications,
Vol.2 Issue. 2, February- 2014, pg. 100-105 ISSN: 2321-8363
©2014, IJCSMA All Rights Reserved, www.ijcsma.com 103
IV.RESEARCH FINDINGS
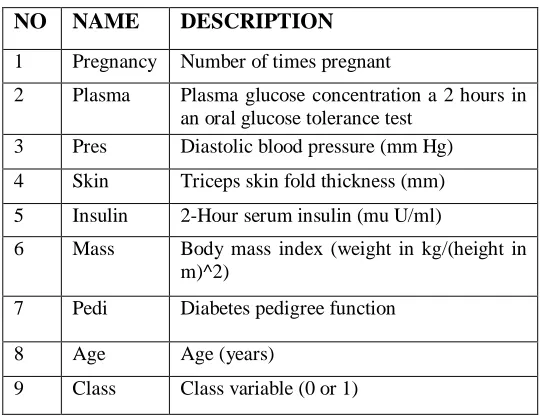
1. DATASOURCE:
Table 2. Attributes of diabetes dataset
NO NAME DESCRIPTION
1 Pregnancy Number of times pregnant
2 Plasma Plasma glucose concentration a 2 hours in an oral glucose tolerance test
3 Pres Diastolic blood pressure (mm Hg)
4 Skin Triceps skin fold thickness (mm)
5 Insulin 2-Hour serum insulin (mu U/ml)
6 Mass Body mass index (weight in kg/(height in m)^2)
7 Pedi Diabetes pedigree function
8 Age Age (years)
9 Class Class variable (0 or 1)
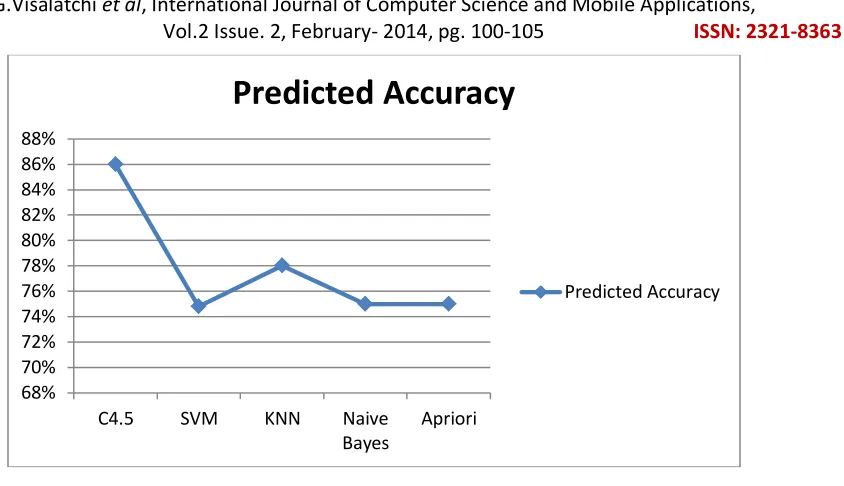
2. PERFORMENCE OF ANALYSING ALGORITHM
Table 2. Performance of Analysing Algorithm
Algorithm used Accuracy %
C4.5 86
SVM 74.8
KNN 78
Naïve Bayes 75
Apirori 75
G.Visalatchi et al, International Journal of Computer Science and Mobile Applications,
Vol.2 Issue. 2, February- 2014, pg. 100-105 ISSN: 2321-8363
©2014, IJCSMA All Rights Reserved, www.ijcsma.com 104
Figure 1 Predicted Accuracy
V.CONCLUSION
There are different data mining classification techniques can be used for the identification and prevention of diabetes disease among patients. This paper describes some classification techniques in data mining to predict diabetes disease in patients. Namely: C4.5, SVM, K-NN, Naive Bayes, and Apriori. These techniques are compared by disease among patients using five classification algorithms accuracy. Then one has highest accuracy above 85%. The C4.5 algorithm best among fives. They are used in various healthcare units all over the world. In future to improve the performance of these classification.
68% 70% 72% 74% 76% 78% 80% 82% 84% 86% 88%
C4.5 SVM KNN Naive
Bayes
Apriori
Predicted Accuracy
G.Visalatchi et al, International Journal of Computer Science and Mobile Applications,
Vol.2 Issue. 2, February- 2014, pg. 100-105 ISSN: 2321-8363
©2014, IJCSMA All Rights Reserved, www.ijcsma.com 105
REFERENCES
1. J. Han, and M. Kamber, 2006. Data Mining Concepts and Techniques, Elsevier Publishers.
2. N.Satyanandam, Dr. Ch. Satyanarayana, Md.Riyazuddin, A.Shaik.“Data Mining Machine Learning Approaches and Medical Diagnose Systems” A Survey. International journal of computer applications, Vol. 2, No. 2, 2009. 3. F.Hosseinkhah, H.Ashktorab, R.Veen, M. M. Owrang O (2009), “Challenges in Data Mining on Medical
Databases”, IGI Global, pp. 502-511.
4. Raj Kumar, Dr. Rajesh Verma,‖ Classification Algorithms for Data Mining P: A Survey‖ IJIET Vol. 1 Issue August 2012, ISSN: 2319 – 1058.
5. Breiman,L.,Friedman,J.,Olsen,R., Stone.C .,1984, .“Classification and Regression Trees”, Chapman & Hall. 6. J. Smola, B. Scholkopf, ‖A tutorial on support vector regression‖, Stat Comput 14 (2004) 199–222.
7. Vidhya.K.A, G.Aghila‖ A Survey of Naïve Bayes Machine Learning approach in Text Document Classification‖ (IJCSIS) Vol. 7, No.2, 2010.
8. G. Parthiban, A. Rajesh, S.K.Srivatsa, “Diagnosis of Heart Disease for Diabetic Patients using Naive Bayes Method “, International Journal of Computer Applications (0975 – 8887) Volume 24– No.3, June 2011.
9. Sarah Wild et al , Global prevalence of diabetes estimates for the year 2000 and projections for 2030, Diabetes Care, Vol. 27, No. 10, Oct. 2004, p. 25-60.
10. Nitin Bhatia,Vandana,‖ Survey of Nearest Neighbor Techniques‖ (IJCSIS) Vol. 8, No. 2, 2010, ISSN 1947-5500. 11. Charanjeet Kaur, ―Association Rule Mining using Apriori Algorithm: A Survey‖, IJARCET Volume 2, Issue 6,
June 2013.
12. V.Karthikeyani, I.Parvin Begum, I.Shahina Begam K.Tajudin, “Comparative of Data Mining Classification Algorithm (CDMCA) in Diabetes Disease Prediction” , volume 60- No.12 December 2012