Published online November 10, 2013 (http://www.sciencepublishinggroup.com/j/ijefm) doi: 10.11648/j.ijefm.20130106.18
The statistical feature analysis and simulation study of
supply chain based on fixed spread risk probability
Lei Wen, Mingfang Guo, Yachao Shi
Department of Economics and Management, North China Electric Power University, Baoding 071003, China
Email address:
[email protected](Lei Wen), [email protected](Mingfang Guo), [email protected](Yaochao Shi)
To cite this article:
Lei Wen, Mingfang Guo, Yachao Shi. The Statistical Feature Analysis and Simulation Study of Supply Chain Based on Fixed Spread Risk Probability. International Journal of Economics, Finance and Management Sciences. Vol. 1, No. 6, 2013, pp. 318-322.
doi: 10.11648/j.ijefm.20130106.18
Abstract:
Understanding supply chain network are important for modeling the spread of risks in enterprise nodes. This study characterizes the supply chain risk network of the spread of several nodes. To identify the rule of the movement of risk nodes, several parameters describing these properties are measured (degree, risk, the number of risk nodes, average risk, average path length and average clustering). The simulation results indicate: (1) this risk network has small-world and scale-free property; (2) the basic topological characteristics on static network displayed a regular change; (3) the characteristics of the spread of risk is measured by risk distribution which obeys a double power law and average risk which has a negative correlation with the number of risk node. In summation, this paper tries to analyze the risk spread of several nodes in supply chain network from macroscopic perspective.Keywords:
Supply Chain, Complex Network, Risk Spread, Fixed Probability, Degree Distribution, Risk Distribution, Average Path Length, Average Clustering1. Introduction
The risk of the complex network reflects the tolerance of the network to failures and attack[1]. It begins with the study of the risk of the computer, then in a wide range of research in all kinds of network application field, including random network, the tolerance of random networks to intentional attack is a fraction of the most connected sites is removed[2], scale-free networks use percolation theory to study analytically and numerically the critical fraction needed for the disintegration of the network, as well as the size of the largest connected cluster[3], cascade transit networks may undergo a global of overload failures when highly loaded nodes or edges are removed due to attacks or failures[4].
The risk of the supply chain is the ability of maintaining supply chain’s operation function when the system faces to the external and internal management in emergencies and other uncertainty of disturbance, including the business contacts among node enterprise and the efficiency of node enterprise business dealings among node enterprises. In today’s uncertain and turbulent markets, supply chain vulnerability has become an issue of significance for many companies. As supply chains become more complex as a
result of global sourcing and the continued trend to ‘leaning-down’, supply chain risk increases. [5]
input data in a closed-loop supply chain network design problem[11]. Sara Hosseini and Wout Dullaert proposed an improved stochastic programming which called robust programming to control and reduce the adverse effects of these uncertainties[12]. Terry L. Friesz etc. presents a dynamic supply chain network model for lessening supply disruption based on strategic capacity, tactical inventory and operational transportation decisions[13]. Michael Schönleina etc. formulate a mathematical program that minimizes the required service rates for keeping a desired level of robustness[14].
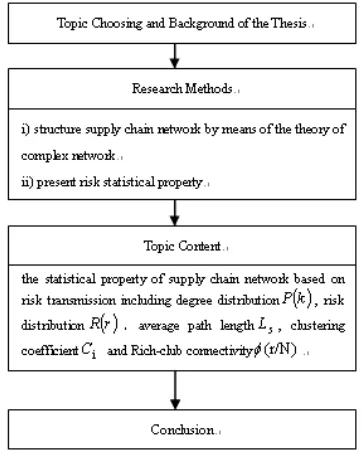
This paper researches the risk of supply chain network on the basis of complex network theory. At first, it builds the supply chain network model based on risk; and then makes a simulation experiment and observes its statistical indicators changes; finally, make the conclusion. The specific structural framework is showed by Fig.1.
Fig 1. the map of conceptual framework
2. Methods
2.1. Risk Network Model
The supply chain’s contact structure may be visualized in terms of a network or graph. Each of the nodes in the network represents an enterprise which consists of supply, seller and customer. An edge is placed between any pair of enterprise who establishes relationship with each other. The resulting network topology is summarized by the symmetric adjacency matrix A who elementsaij=0if there
is the absence of such a contact, whileaij =1oraij=-1 if
there is a contact between the node enterprise
i
andj
, which from upstream entity to downstream entity or contrary direction. According to different volume of business, there is different connection strength among associated nodes. Here, we assume that the graph isweighted network, andwij =wji.
In the supply chain risk network, each node was assumed to be a risk enterprise, and each edge was assumed to be a method of spread of the risk from one risk node enterprise to another. Node added sequentially until the network reaches the required size with probability
connection
k
p
(
)
, which can be defined by( )
( )
(
1)
r( )
ll r )
( m
A l m
A l
Π
Π
∈ ∈
∗ −
− =
m
k r k
p connection
Here, m is the total number of risk nodes, r
( )
k is the risk value of new nodek
, r( )
lm
A
lΠ∈ is all risk value of its
associated node.
A
is the ultimate supply chain network. However, it's obvious that the new added nodes make a big change to the network structure and should have been implemented to change the risk value of associated node. In the process of adding new node, risk of associated node may be augmented or diminished with the probability proportionalp
( )
i
distribution, which can be defined by( )
( )
( )
l r ni r l r k
r i
p n
A l n
A l on
distributi
∈ ∈
Π −
− Π −
=
* ) 1 (
) ( *
40 ) (
1 arctan 2
π
And the actual risk value of associated node is defined by:
r
'( )
i
=
r
(
i
)
+
r
(
i
)
*
p
(
i
)
distribution.Here, n is the number of associated nodes,
r
( )
k
is the risk value of new added nodek
,r
( )
i
is the risk value ofassociated node i before risk be transmitted,
r
( )
l
m
A l
Π
∈is all risk value of its associated node.
2.2. Topological Description of Network
The following network characteristics were calculated as follows:
(i) Degree
k
i: The degreek
i is the number of nearest neighbors a node. It has two components: in-degree (means the supply channel) and out-degree (means the sale channel). The distribution functionP
( )
k
which expounds the mechanisms of structure's evolution is the probability that a node has degree k.(iii) Average effective path length
L
s: The minimum distance between a lowest-level supplier and a customer is denoted by path lengthL
. It indicates the minimum number of intermediate links between any two randomly chosen nodes. The average effective path lengthL
s is all of edges over the entire edge set of the effective network.(iv) Effective clustering coefficient
C
i: The Clustering coefficientC
i is defined as the proportion of number of links shared by the neighborhoods node, which is adjacent to each other. Average clustering coefficientC
measures the prevalence of local connections in supply chain risk network. Under the influence of the risk, the effective clustering coefficient will wave violently, and the value of average clustering coefficient perhaps not by much.(v) Rich-club connectivity
φ
(
r/N
)
: The rich-club phenomenon in complex networks digests the observation that the high-degree nodes prefer to attach to other high-degree nodes. The rich-club connectivityφ
(
r/N
)
can be defined as the ratio of the number of edges connecting the club members over the maximally possible number of edges. The rich-club connectivity measures how densely connected the nodes with degree larger are.3. Simulation Experiment of Risk Nodes
of Spread
In simulation process, the initial network is set to 30 nodes and the number of suppliers, sellers and customers’ edge is set as 3, 5, 8 respectively. The ranges of the risk values are specified 30 to 50 at random and corresponding risk threshold increase one risk strength compared with itself risk value. The number of risk spread node is almost 6% of the all. The simulation of each experimental data is performed 50 times. The specific data value for the three categories is showed in table 1.
Table 1. The supply complex network experimental data
Experiment number
The number of initial node
Supplier s
Selle r
Customer s
1 30 120 200 320
2 30 180 300 480
3 30 240 400 640
4 30 300 500 800
5 30 360 600 960
6 30 420 700 1120
7 30 480 800 1280
3.1. Degree Distribution
Degree is one of the measures of centrality of a node in the network. For supply chain, degree symbolizes the synthesis operation ability of an entity, the larger the degree, the more important it is.
100 101 102 10-3
10-2 10-1 100
The degree k
T
h
e
p
ro
b
a
b
ili
ty
P
(K
)
o
f
d
e
g
re
e
k
Fig 2. The degree distribution of supply chain risk network
In Fig. 2, we find that the degree distribution of supply chain network follows a power law distribution. The power-law exponent of all nodes degree distribution
05
.
0
63
.
1
-degree
=
±
γ
.That means the most business entities have relatively less business relation with other entities, but few have a large number of business relation with other entities and become the core of supply chain.
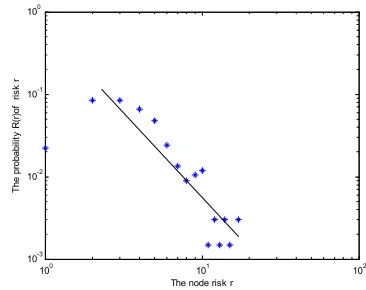
3.2. Risk Distribution
The risk distribution of simulation supply chain network is showed in Fig. 3.
100 101 102 10-3
10-2 10-1
100
The node risk r
T
h
e
p
ro
b
a
b
ili
ty
R
(r
)o
f
r
is
k
r
Fig 3. The risk distribution of supply chain risk network
In Fig. 3, we find that the risk distribution of supply chain network is also follows a power law distribution. The power-law exponent of all nodes risk distribution
05
.
0
.43
1
-
±
=
risk
γ
. That means the most business entities have relatively lower risk, but few have a large risk. The node with large risk will cause the unstable of supply chain.3.3. Average Path Length
network has faster reflection and shorter response time when several risk nodes start to transmit.
Table 2. The supply chain risk network average effective path length
calculated results
Experiment
number Suppliers Seller Customers
average path length
1 120 200 320 2.2756
2 180 300 480 2.4851
3 240 400 640 2.5159
4 300 500 800 2.6234
5 360 600 960 2.8879
6 420 700 1120 2.9839
7 480 800 1280 2.9962
3.4. Average Clustering Coefficient
Average clustering coefficient C measures the closeness of interconnected nodes in supply chain risk network. From table 3, we can find that while the network scale grows larger, the average clustering coefficient tend to become smaller. Furthermore, the whole change of the average clustering coefficient C is not obvious and it is nearly to 0.0017 with the scale of supply chain increased.
Table 3. The risk supply chain network clustering coefficient calculated
results
Experiment
number Suppliers Seller Customers
average clustering coefficient
1 120 200 320 0.0088
2 180 300 480 0.0068
3 240 400 640 0.0054
4 300 500 800 0.0044
5 360 600 960 0.0032
6 420 700 1120 0.0024
7 480 800 1280 0.0017
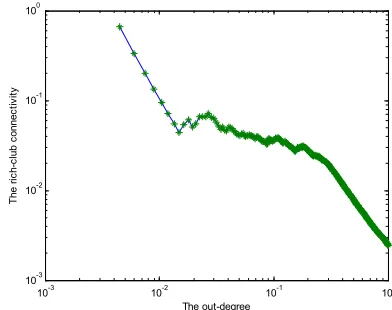
3.5. Rich-Club
Fig. 4 and Fig. 5 are the rich-club connectivity distribution graph of the node in-degree and the node out-degree respectively.
10-3 10-2 10-1 100 10-3
10-2 10-1 100
The in-degree
T
h
e
r
ic
h
-c
lu
b
c
o
n
n
e
c
ti
v
it
y
Fig 4. The rich-club connectivity distribution of the node in-degree k
10-3 10-2 10-1 100 10-3
10-2 10-1 100
The out-degree
T
h
e
r
ic
h
-c
lu
b
c
o
n
n
e
c
ti
v
it
y
Fig 5. The rich-club connectivity distribution of the node in-degree k
The characteristic of the rich-club connectivity is decreasing tendency. The change rules are similar to the degree distribution and all of them obey power-law distribution. In supply chain, rich nodes are interconnected to one another more intensely than to low-degree nodes. These nodes which called “core enterprise” make a contribution to keep supply chain running smoothly. When the rich-club phenomenon is present, these “core enterprises” may play the leading role in the supply chain activities, which will in turn prompt their positions more strong.
4. Conclusions
Complex networks provide a new angle of view to understand the regularity of changes of things. Graphs reveal interior movements by a visual image. In this paper, depending on complex network theory and graph theory, it investigates risk spreading of several nodes on a supply chain network. By means of statistic analysis, we conclude that: (1) this risk network has small-world and scale-free property; (2) there is a relationship between risk and degree that with larger degree, the more likely nodes is to infect; (3) average risk show a negative correlation with the total number of risk nodes; (4) the supply chain has a high average path length and a low average clustering coefficient; (5) the rich-club connectivity follows power-law distribution.
Acknowledgments
This paper is supported by Humanity and Social Science Youth foundation of Ministry of Education under Grant Nos. 10YJC630271.
References
[2] Cohen R,ErezK, ben-Avraham D, et a.l Resilience of the internet to random breakdowns [J]. PhysRevLett, 2000,85(21): 4626-4628.
[3] Bollobas B, Riordan O. Robustness and vulnerability of scale-free random graphs[J]. InternetMath, 2003, 1: 1-35.
[4] A.E.Motter. Cascade Control and defense in Complex Networks[J].Phys Rev Lett,2004,93: 098701.
[5] Christopher M, Peck H. Building the resilient supply chain[J]. International Journal of Logistics Management, The, 2004, 15(2): 1-14.
[6] Klibi W, Martel A, Guitouni A. The design of robust value-creating supply chain networks: a critical review[J]. European Journal of Operational Research, 2010, 203(2): 283-293.
[7] Vahdani B, Tavakkoli-Moghaddam R, Modarres M, et al. Reliable design of a forward/reverse logistics network under uncertainty: A robust-M/M/c queuing model[J]. Transportation Research Part E: Logistics and Transportation Review, 2012, 48(6): 1152-1168.
[8] Longinidis P, Georgiadis M C. Managing the trade-offs between financial performance and credit solvency in the optimal design of supply chain networks under economic uncertainty[J]. Computers & Chemical Engineering, 2012.
[9] Klibi W, Martel A. Scenario-based supply chain network risk modeling[J]. European Journal of Operational Research, 2012.
[10] Tang C S. Robust strategies for mitigating supply chain disruptions[J]. International Journal of Logistics: Research and Applications, 2006, 9(1): 33-45.
[11] Pishvaee M S, Rabbani M, Torabi S A. A robust optimization approach to closed-loop supply chain network design under uncertainty[J]. Applied Mathematical Modelling, 2011, 35(2): 637-649.
[12] Hosseini S, Dullaert W. Robust Optimization of Uncertain Logistics Networks[J]. Logistics Operations and Management: Concepts and Models, 2011: 359.
[13] Friesz T L, Lee I, Lin C C. Competition and disruption in a dynamic urban supply chain[J]. Transportation Research Part B: Methodological, 2011, 45(8): 1212-1231.