* Corresponding author Tel +98-917-1003767 Fax +98-711-6271747. E-mail addresses: [email protected] (R. Akbari),
© 2011 Growing Science Ltd. All rights reserved. doi: 10.5267/j.ijiec.2010.03.002
Contents lists available atGrowingScience
International Journal of Industrial Engineering Computations
homepage: www.GrowingScience.com/ijiec
A multilevel evolutionary algorithm for optimizing numerical functions
Reza Akbaria* and Koorush Ziaratia
a
Department of Computer Science and Engineering, Shiraz University, Shiraz, Iran
A R T I C L E I N F O A B S T R A C T
Article history: Received 15 April 2010 Received in revised form 15 May 2010
Accepted 16 May 2010 Available online 17 May 2010
This is a study on the effects of multilevel selection (MLS) theory in optimizing numerical functions. Based on this theory, a Multilevel Evolutionary Optimization algorithm (MLEO) is presented. In MLEO, a species is subdivided in cooperative populations and then each population is subdivided in groups, and evolution occurs at two levels so called individual and group levels. A fast population dynamics occurs at individual level. At this level, selection occurs among individuals of the same group. The popular genetic operators such as mutation and crossover are applied within groups. A slow population dynamics occurs at group level. At this level, selection happens among groups of a population. The group level operators such as regrouping, migration, and extinction-colonization are applied among groups. In regrouping process, all the groups are mixed together and then new groups are formed. The migration process encourages an individual to leave its own group and move to one of its neighbour groups. In extinction-colonization process, a group is selected as extinct, and replaced by offspring of a colonist group. In order to evaluate MLEO, the proposed algorithms were used for optimizing a set of well known numerical functions. The preliminary results indicate that the MLEO theory has positive effect on the evolutionary process and provide an efficient way for numerical optimization.
©2011 Growing Science Ltd. All rights reserved.
Keywords: Meta-heuristic Genetic algorithm Multilevel selection Colonization Regrouping Migration Numerical functions
1. Introduction
are passed to the third level and the processes such as migration, extinction-colonization, regrouping, etc are applied on them. This scenario may repeat for higher levels. One may think that only the lower levels could influence the higher level, but it is not true. It seems that higher level dynamics are not only influenced by lower level dynamics, but also the reverse process may occur. The reverse process determines the structure of the lower level ones (Hogeweg, 2002). For example, the colonization process at group level may ignore all the results which are obtained through crossover and mutation at lower levels by replacing an extinct group by a group of new individuals from colonist group. Similar phenomenon may occur among other layers and we can say that low level operations influence higher level ones and vice versa. The MLS theory provides the ability for one to develop a multilevel evolutionary mechanism in order to evolve more powerful individuals. Hence, the MLS theory is used in this work, and three multilevel evolutionary algorithms are proposed. The proposed algorithms are based on standard genetic algorithm (GA). GA is an evolutionary algorithms, in which a population of individuals evolves according to a set of rules such as selection, crossover and mutation, as well as controller parameters such as mutation rate, crossover points, crossover probabilities, etc (Srinivasan & Seow, 2003). In such algorithm, individuals employ a selection mechanism such as tournament, ranking or proportionate in order to choose new regions with higher fitness. Also, the evolution of the individuals is controlled by perturbing individuals using crossover and mutation operators (Boyer et al., 2007). The proposed approaches work by subdividing a species in cooperative populations and then subdividing each population in groups and cooperation is carried out by sharing information among populations. Evolution occurs at individual and group levels and a fast population dynamics occur at individual level. At this level, reproduction occurs by selecting individuals as parents, producing offspring by means of crossover, and replacing worst parents by offspring with better fitness. The mutation occurs at this level and a slow population dynamics also appear at group level. At this level, three different processes (i.e. regrouping, migration, and extinction-colonization) are used and three variants of the algorithm are proposed. In regrouping process, all the groups in a population are mixed at the mixing phase, and new groups are emerged at regrouping phase. The migration process provides the ability for an individual to leave its current group and move to another group in order to obtain better fitness. Finally, in colonization process, the worst group is selected as extinct, and its individuals are killed. The colonist group replaces the extinct one by its offspring.
The rest of the paper is organized as follows. Section 2 introduces required basic concepts. The proposed multilevel evolutionary algorithms are described in section 3. This section describes the structure of the algorithms along with natural selection which is adopted with genetic algorithm. In order to study the effect of multi-level selection on GAs, a set of numerical optimization problem is considered. Section 4 reports numerical test functions, experimental settings and experimental results of the proposed algorithms. Finally, section 5 concludes this work.
2. Basic Concepts
During the past few years, there have been tremendous efforts considered either for developing or for implementing the multilevel selection (see for instance Valleriani & Meene; 2007, Fletchera & Zwick; 2007, Ichinose & Arita; 2008). It seems that, multilevel selection is an important organizing principle which permits evolutionary processes from emerging of the first cells to the economics of nations (Traulsen & Nowak; 2006). The proposed method of this paper applies social dynamics at individual and group levels. The proposed method extends traditional evolutionary algorithms by introducing new social dynamics among various groups of a population. The algorithm subdivides a population in groups and evolves through within and among group dynamics. Hence, the cornerstones of the proposed algorithm contain social processes, mechanisms, and conditions which could be described as follows,
Group boundary: a mechanism which is used to restrict interactions among individuals such that the population is partitioned into groups. Group boundary may be closed or opened. Groups with opened boundaries influence each other at each cycle of algorithm. Groups with closed boundaries influence themselves only at the time of between-group selection.
Population topology: presents the way a group in the population interacts with its neighbors. The interaction between adjacent groups is performed through communication channels. A communication channel connects two neighbor groups in a population.
Group formation: a process which forms groups in a population at the initial time. Such process usually uses a random way to assign an individual to a group.
Mixing: a process which destroys previously formed groups and adds their individuals to the population. This process depends on group level condition.
Regrouping: is a kind of group formation process which forms new groups from mixed groups throughout the execution of the algorithm.
Colonization: a process by which an extinct group is replaced by individuals from a colonist group. Migration: a process by which individuals may leave their own groups and move to neighbor groups.
Conditions: cost/benefit ratio of individual interactions and other conditions which are sufficient for producing group-level selection (e.g. as described in sub-section 3.2.2, population temperature is used as condition of group level selection).
3. Multilevel Evolutionary Optimization
MLEOs are designed as a multilevel social psychological process. We use the multilevel selection theory to design an algorithm in which social dynamics occur at two levels: At the first level, individual level, the individuals within groups are considered and at the second level, group level, a population composed of such groups is considered. Each group is a subpopulation whose social dynamics are modeled by individual level genetic operators. The social dynamics at group level are modeled by performing group level process. The schematic diagram of the MLEO algorithm is presented in Fig. 1. Assume that we have a species subdivided in k cooperative populations. In a D dimensional optimization problem, the problem is partitioned into the k sub-problem each of which is
optimized by a distinct population. In this way, each population i is responsible to optimize only Di
dimensions of the search space where D=UDi(1≤i≤k). At this level, the complete solution is
constructed by assembling partial solutions and MLEO acts similar to CCGA algorithm proposed by Potter and De Jong (1994). Each population i is subdivided and Gnum groups each of which contains
Gsize individuals are formed and the neighbor groups are connected by communication channels. It is
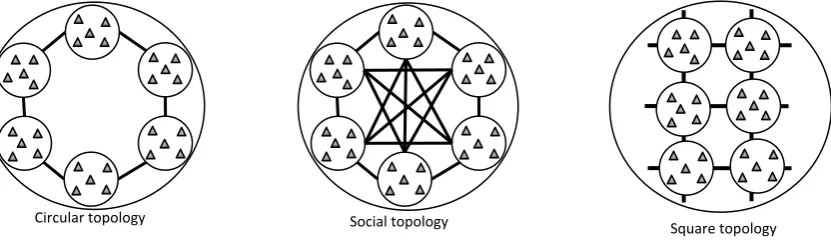
possible to establish different neighborhood configurations among groups. Three population topologies called circular, social, and square topology are used as presented in Fig 2. The groups are depicted as circles and the communication channels depicted as links between them. The population can be considered as a network where the circular topology of the network results a chain of groups each of which is connected to its’ previous and next groups, and the last group is connected to the first group. In social topology, each group is connected to all the other groups in the population. In square topology, the groups are arranged in a matrix and each group is connected to the left, right, top, and down groups. In previous studies on population based algorithms, the network topology was considered in individual level.
When the topological configuration of a population i is formed, the individuals of each group in this
population are initialized randomly in the Di dimensions of the search space. Each group j in
population i is coded as Gsize arrays of bits each of which has Di×Nbit length. Each array filled
randomly by zeros and ones using the following,
( )
(randomDi Nbit ) round
Ind= × , (1)
round function rounds the numbers to zero or one.
Fig.1. Schematic diagram of the MLEO algorithm
After initiation, the algorithm starts and iteratively applies within and between group dynamics until the termination condition are met and a fast evolutionary dynamics occur within each group. At each cycle of the algorithm, the individuals of a group are evolved according to the low level evolutionary processes such as individual selection, crossover, and mutation. A slow evolutionary dynamics occur at group level. Between-group dynamics occurs when the conditions for between-group selection are satisfied. Between-group dynamics includes extinction-colonization, migration, and regrouping processes. The details of the within and between group dynamic are described in the following subsections. Usually, between-group dynamics occurs when group level conditions are satisfied. Different conditions such as temperature of groups, cost/benefit ratio of individuals in groups, etc
Bet
w
e
en
gr
oup
dy
namics
Wi
th
in
gr
oup
dyna
mics
iter=1
iter≤itermax iter=iter+1
j=j+1
j≤Gnum
j=1
End
Divide Species in populations. Divide each population in groups Initialize individuals in the search space Evaluate fitness of each individual in population i
Inputs: Gsize, Gnum, k, itermax
Yes
No
Yes
No
iter%itercol=0
No
Yes
Selection
Mating
Mutation
Replacement l=1
l≤Di
l=l+1
Selection
Reproduction
Extinction i=1
i≤k i=i+1
Yes
No
Evaluate fitness of each individual in population i
Mixing
Regrouping
Perform Migration
Group level process?
TP>Tmax
Yes
No
Migration Regrouping
Colonization
iter%itermig=0
Yes
may be considered to decide if the group level process need to be occurred or not. In this work, we have used different conditions for each of the group level processes. The provided information by groups is then used in population level for constructing the complete solution. The cooperative populations evolve by exchanging information. A population use the information about the best individual other population to evaluate the fitness of its own individuals.
Fig. 2. The representation of circular, social and square topology
Fig. 2. Shows the details of three different topologies used for the proposed method. Two neighbor groups are connected through a communication channel and the communication channels between adjacent groups result a population with different topologies such as circular, social, and square.
3.1Within-Group Dynamics
Within-Group dynamics occur between individuals of a group at each cycle of the algorithm. In MLEO, each individual is considered as a group of cells where each of them encodes one dimension of the problem to be optimized. These dynamics are performed in four main steps: selection, mating, mutation, and replacement. The selection and mating are separately performed between cells, or dimension, of individuals while mutation and replacement are applied between individuals of a group. More precisely, in each group, the selection and mating are applied between only one dimension of
two parents. In a Di dimension, individual has the chance to mate with Di other individuals.
Performing these two steps in a finer granular level, i.e. the cell level, provide the ability for a group to maintain an appropriate level of diversity.
Selection: In selection step, two individual are selected randomly from the same group to produce two new offspring. These individuals considered as parents are selected using a uniform random number generator,
( )
⎣ 1⎦
1 G random
parent = size× (2)
( )
⎣ 1⎦
2 G random
parent = size× (3)
Pairing takes place between Gsize individuals of a group until each individual pairs with another one.
Under this regulation, Gsize offspring are born in the mating group.
Mating: Mating is the creation of one or more offspring from the parents selected in the pairing process. The most common form of mating involves two parents that use crossover to produce two offspring. The point and flat crossover are among the commonly used crossover techniques. In k-point technique, k crossover k-points within the range of an individual are selected randomly and the individual parts between these points are swapped by the parts of another individual. In this paper, we use two-point crossover technique, where the points are selected, randomly. Using the two-point crossover, each of the parents is divided to three parts. The second part of the individuals is swapped and two offspring are formed.
Social topology
Circular topology
Mutation: After mating process, a part of offspring are mutated. Random mutations alter a certain number of bits in a mutant offspring. We have used single point mutation which changes a bit one to
zero and vice versa. Mutation points are randomly selected from the Di×Nbit number of bits in the
offspring array. Mutation rate influences convergence of the algorithm. On one hand, large mutation rate increases diversity of the algorithm which is considered as a good way for avoiding premature convergence. On the other hand, it tends to distract the algorithm from converging on a popular solution. Hence, an appropriate mutation is always needed. Our empirical studies have indicated that
the best results are found when we choose to mutate 20% of group.
Replacement: After the process of the mutation takes place, the fitness associated with offspring and old group are calculated and they are sorted based on their fitness. A half of old population with poor fitness is replaced by offspring with better fitness.
3.2Between-Group Dynamics
3.2.1 Colonization
As described in the previous sections, group dynamics are influenced by operations such as crossover, replacement, and leader selection. Similarly, working at group level needs appropriate operations. Migration, colonization, and regrouping are among the most important operations at group level. These operations have fundamental role for the success of an individual. The extinction-colonization is a social process which occurs at group level. MLEO with extinction-extinction-colonization process called MLEO_C. The MLEO_C algorithm performs the extinction colonization process after
predefined number of cycles (i.e. itercol). The colonization process is presented in Fig. . This process
has three steps: selection, reproduction, and colonization.
Selection: In first step, a group in the population is selected as colonist and another group is selected as extinct. These groups are selected based on their fitness. In this work, the fitness of the best individual in a group is considered as the fitness of that group. The group with the best fitness is selected as colonist while the group with the worst fitness is selected as extinct.
Reproduction: For the second step, the colonist group is considered as the mother group, and the new generation is produced by applying crossover process among its individuals. The new generation is added to the mother group. The individuals in the mother group are partitioned randomly and two new daughter groups are formed. The mother group is replaced by the first daughter group. The second daughter group is used as input of colonization step.
Fig. 2. At the extinction time, a group is selected as extinct, and a group is selected as colonist. The
colonist group kills the individuals of the extinct group and new group formed by the offspring of the colonist group.
Colonization: For the third step, the individuals in the extinct group can be replaced in two ways. In first way, the extinct group is eliminated with probability p and the second daughter group is considered as new emerging group. In the second step, a part of individuals of the extinct group are replaced by the best individuals of the second daughter group with probability 1-p. The selection of an individual as extinct depends on its fitness. As the fitness of an individual increases its selection decreases.
Colonization Selection Phase
Reproduction
New population Old population
Mother group Daughter
3.2.2 Migration
The migration process is presented in this part where MLEO with migration process is called MLEO_M. Migration plays fundamental role for the success of an individual. Cooperation among groups is performed through bidirectional migration channels (Valleriani and Meene; 2007). A migration channel connects two adjacent groups as shown in Fig. 2. This configuration results a chain of groups in a population in which each group j is connected to its neighbour groups. The migration
of the individuals between neighbour groups is controlled by parameter D. This parameter, called
migration rate, shows the percentage of the individuals in a swarm which could migrate to one of their neighbour groups. A migrant may choose one of its neighbour groups as its destination with the
probability of
N 1
, where N is the number of its neighbours.
The migration rate depends on the status of the social environment and the status is defined using the number of individuals in an environment and the fitness of the group. Therefore, we have
( ) ( )
(
j j)
j =Ψrs ,ns
D , where r
( )
sj is the fitness of the group j in a population, and n( )
sj is the number ofindividuals in group j. The average fitness of a swarm j is defined as
( )
( )
( )
j s n i i js n
f s
r
j
∑
== 1 where
i
f
represents the fitness of an individual i in group j. The migration rate D is limited to the range
[
Dmin,Dmax]
, where Dmin and Dmax represent the maximum and minimum values of the migration rate,respectively. The fitness of a group is compared with fitness of the other groups in the population. The individuals of a group with lower fitness have more favour to leave their group and migrate to other groups. Also, an environment with large number of individuals encourages its individuals to migrate to other environments. Usually, a migrant considers different factors (Valleriani and Meene; 2007)., such as the competition (Hamilton, and May; 1977), the stochastic behaviour of the environment (Venable and Brown; 1998), the change of the social environment (Valleriani and Meene; 2007)., and the avoidance of inbreeding depression (Frank; 1986) to decide if we need to remain in the current environment or we have to leave the environment and migrate to the new one. The aforementioned factors influence the proposed model for migration from two perspectives:
migration rate, and selection of migrant individual. In our work, migration is carried out after itermig
iterations. The migrant individual in each of the groups are selected based on the roulette wheel method. This method selects an individual as migrant by evaluating its’ relative fitness. Note that that this method is indirectly affected by the age of the individuals. The individual age is determined as a number of iteration in which its position is not changed. The relative fitness r of an individual in a
group which is calculated as
∑
== n
j j i i
f f r
1
, where n represents the number of individuals in the group.
Under this method, individuals with lower fitness have more tendencies to leave their group and migrate to neighbour groups. Also, the stagnant individuals with relatively good fitness are favoured to escape their positions and migrate to obtain better fitness.
3.2.3 Regrouping
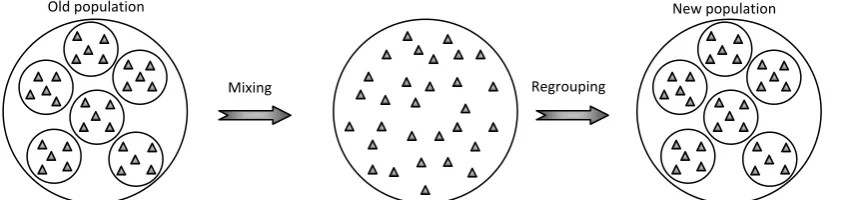
In this section, we propose another selection approach in group level through regrouping operation. MLEO with regrouping process called MLEO_R. The regrouping process is presented in Fig. 2. Regrouping process has two steps. In mixing step, the group boundaries are removed and the individuals of the groups are embedded within the population and the regrouping is carried out next. At this step, new groups are emerged and each individual is added to a group, randomly. Therefore,
an individual selects a group as its target with the probability of
num
G 1
, where Gnum is the number of
newly emerged groups which depends on regrouping model. The regrouping process may be static or dynamic: in the static model the number of groups remains constant, while in dynamic model, at the
Fig. 2. Regrouping process is performed in two steps. In the mixing step, the previously formed groups are removed and their individuals are embedded within the population. In regrouping step, new groups are emerged.
A regrouping process usually depends on some dependent factors. Time is the first factor which influences the performance of individuals of a population. One may assume a separation of time scales for dynamics within groups and between groups. In a normal way, within-group dynamics occurs faster than between-group dynamics. As described previously, within-group dynamics occur at each cycle of the MLEO algorithm. The time factor may be dependent or independent. Using independent time, an algorithm performs the regrouping process after predefined number of cycles. Using dependent time, an algorithm may consider social state of the groups to determine the time at which the regrouping process is occurred. In this work, we use temperature factor to determine the time of regrouping. Hence, the social state of a group is modelled by its own temperature. The temperature of a group j is defined based on its own fitness as follows,
( )
( )
⎟⎟ ⎟ ⎠ ⎞ ⎜⎜
⎜ ⎝
⎛ −
− =
U fit fit
TGj exp newβj old βj , (8)
where fitnew
( )
βj and fitold( )
βj are the best fitness of the individuals in group j in the current and theprevious iterations, and U is a control parameter. Under this configuration, the regrouping process
occurs when the temperature of the population reaches a predefined temperature Tmax. The population
temperature is defined as follows,
num G
j j
G TG TP
num
∑ =
= 1
, (9)
The temperature implies the performance of a group in optimizing the problem on the hand. The temperature of a group decreases when the better fitness is obtained. A cool group has no tendency to contribute in regrouping process. The temperature of a group increases when it has difficulty in improving its performance. In such case, little or no improvement is achieved by the group. This may occur under different conditions such as stagnation or trapping in local optima. The individuals in a warm group try to break the group boundary and find new neighbours from other groups in order to improve their performances. In our implementation, the regrouping process occurs when the
population temperature remains over threshold Tmax during predefined number of iterations.
4. Experiments
In this section, we perform the experiments to evaluate the effect of multilevel selection in optimizing analytical test functions. The performance of the MLEOs are evaluated and compared with standard GA and its cooperative co-evolutionary variant (CCGA) presented by Potter and Jong (1994).
4.1Experimental settings
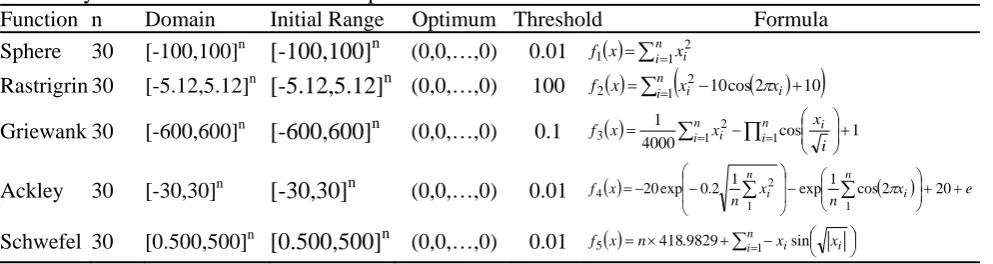
To test the performance of MLEOs, five well known benchmark functions are used and different factors such as the optimum solution after a predefined number of iterations, convergence speed, and the rate of convergence to the optimum solution are evaluated. The analytical test functions and their parameters are presented in Table 1. These benchmarks are widely used in evaluating the
Regrouping Mixing
performance of the population based methods. The first function is unimodal, and others are multimodal. A unimodal function has only one optimum while a multimodal function has two or more local optima. Note that each problem represents a candidate for an actual real-world problem. They have different characteristics (e.g. they are unimodal or multimodal, or have dependent or independent variables). A robust optimization algorithm needs to maintain a balance between exploration and exploitation, to control the diversity, to mitigate the premature convergence and to stagnate to cope with test function of different types.
Table 1
The analytical test functions and their parameters
Function n Domain Initial Range Optimum Threshold Formula Sphere 30 [-100,100]n [-100,100]n (0,0,…,0) 0.01 f( ) ∑x = in=1xi
2 1
Rastrigrin 30 [-5.12,5.12]n [-5.12,5.12]n (0,0,…,0) 100 f ( )x =∑in=1
(
xi − ( xi)+)
2
2 10cos2π 10
Griewank 30 [-600,600]n [-600,600]n (0,0,…,0) 0.1 ( ) cos 1 4000
1
1 1
2
3 ⎟⎟+
⎠ ⎞ ⎜⎜ ⎝ ⎛ −
= ∑n= ∏=
i n i i i i x x x f
Ackley 30 [-30,30]n [-30,30]n (0,0,…,0) 0.01 ( ) ( x) e
n x n x f n i n
i ⎟⎟+ +
⎠ ⎞ ⎜ ⎜ ⎝ ⎛ − ⎟ ⎟ ⎠ ⎞ ⎜ ⎜ ⎝ ⎛ − −
= 20exp 0.2 1∑ exp1∑cos2 20
1 1
2
4 π
Schwefel 30 [0.500,500]n [0.500,500]n (0,0,…,0) 0.01 f5( )x =n×418.9829+∑ni=1−xisin⎝⎛⎜ xi⎟⎠⎞
4.2Settings of the Algorithms
Simulations were performed to observe the performance of the proposed algorithms to find the optimal solutions. There are two types of common and specialized parameters associated with each test problems. Common parameters are the number of dimensions for the search space, the maximum generation, the population size, and total number of the trials. All experiments were run for 30 error function evaluations and the number of iterations was chosen at 1000. For all the test functions, the population size is set to 200, and a total of 50 runs for each experimental setting have been conducted. For GA and CCGA algorithm, the same settings as reported by Potter and Jong (1994) were used. In MLEO, the number of populations was set to five and each population was subdivided to five groups. Each population in MLEOs utilizes social topology, and uses closed groups. The
extinction-colonization process in MLEO_C is performed after 10 iterations (i.e. itermig=10). The
migration process in MLEO_M is performed after two iterations (i.e. itermig=2). The following
settings were used for five algorithms,
Each individual has been coded in binary and 48 bits have been used for each function variable (the chromosome length is 48 bit). The scaling window technique of length five is used for fitness scaling. The two-point crossover and genetic mutation are selected as genetic operators. The crossover
probability is set to 0.6 and the mutation probability is set at 1
(
chromlength×sf)
. The selection ofindividuals corresponds to their fitness and an elitist strategy is used in which a single copy of best individual is preserved.
4.3Experimental results
4.3.1 Performance analysis
The performance of an algorithm determines if its solution has better quality than the solution produced by the other methods for the same problem instance or not. Hence, the performance is an important measure in optimization problems which determines the success of the probability of an algorithm. One may wish to use the algorithm which produces the best solution.
Table 2
Evaluation results on test functions
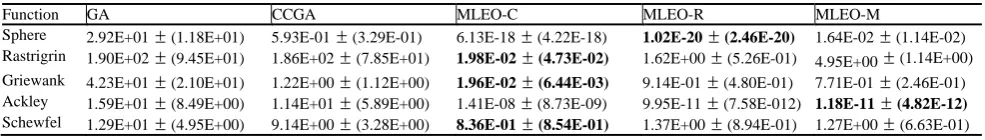
Function GA CCGA MLEO-C MLEO-R MLEO-M
Sphere 2.92E+01 (1.18E+01) 5.93E-01 (3.29E-01) 6.13E-18 (4.22E-18) 1.02E-20 (2.46E-20) 1.64E-02 (1.14E-02) Rastrigrin 1.90E+02 (9.45E+01) 1.86E+02 (7.85E+01) 1.98E-02 (4.73E-02) 1.62E+00 (5.26E-01) 4.95E+00 (1.14E+00) Griewank 4.23E+01 (2.10E+01) 1.22E+00 (1.12E+00) 1.96E-02 (6.44E-03) 9.14E-01 (4.80E-01) 7.71E-01 (2.46E-01) Ackley 1.59E+01 (8.49E+00) 1.14E+01 (5.89E+00) 1.41E-08 (8.73E-09) 9.95E-11 (7.58E-012) 1.18E-11 (4.82E-12)
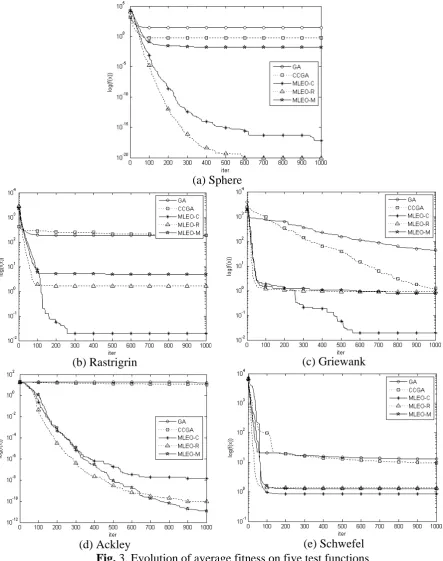
Schewfel 1.29E+01 (4.95E+00) 9.14E+00 (3.28E+00) 8.36E-01 (8.54E-01) 1.37E+00 (8.94E-01) 1.27E+00 (6.63E-01) The unimodal function Sphere presents an easy problem to solve. There is a big difference between the performance of MLEO_C and MLEO_R algorithms and the other algorithms on Sphere function. Fig. 3(a) shows evolution of these algorithms on the Sphere function. From the results, we can see that the GA, CCGA, and MLEO_M algorithms rapidly trapped in local optima at early iterations. However, MLEO_M surpass GA and CCGA algorithms. The MLEO_C and MLEO_R algorithms significantly outperform other three algorithms. The Rastrigrin function is a highly multimodal with frequent local optima. An algorithm with poor balance between exploration and exploitation simply trapped in local optima in early iterations. It is apparent from the Fig. 3(b) that the MLEOs improve the quality of the optimization solutions. However, the colonization process results better improvement and the best results are found by MLEO_C. Also the other two variants of MLEO produce better results than GA and CCGA algorithms. We normally expect that an optimization algorithm move in direction of the gradient. In Griewank function, the local optima are placed in the direction of the gradient. Therefore, an optimization algorithm needs to provide an appropriate level of global search to escape from the local optima and moves toward the global optima. It seems that group level process especially extinction-colonization process enriches the evolutionary algorithms to cope with this type of complexity. From Fig. 3(c), the best result was found by MLEO_C algorithm. The evolution of algorithms on Ackley function is presented in Fig. 3(d). From the results we can see that the GA and CCGA trapped in local optima at early iterations. This function was successfully optimized by MLEO algorithm. The three variants of MLEO strongly outperform GA and CCGA algorithm and the best result was obtained by MLEO_M algorithm. The Schwefel function is hard to solve. However, MLEOs surpass GA and CCGA algorithms. From Fig. 3(e), The best result was found by MLEO_C algorithm.
4.3.2 Algorithm reliability
When two algorithms have to be compared on a given set of problem instances, one can use the success for an algorithm to determine if a solution has better quality than the solution produced by the other method for the same problem instance. Hence, the success ratio is an important measure in optimization problems. It determines the success probability of an algorithm. One would like to use the algorithm having the highest success probability.
The success rates for 50 runs of each test function are recorded in Table 3. The success rate indicates the robustness of each algorithm. Different successful criteria for different functions are presented in the literature. When the maximum number of iteration is exceeded, if the minimum value is reached by the algorithm is not below than threshold, the run is considered unsuccessful. Threshold of each function is presented in Table 1. In this paper, if the algorithm converges to the given threshold, then this run of the algorithm is regarded as successful. It is apparent from the results that MLEOs have better performance than GA and CCGA algorithms for all the test functions. MLEO_C successfully optimizes all trials for all test functions except Schwefel. However, it has a high success rate on the Schwefel function. MLEO_R successfully converges to the success criteria when optimizing Sphere, Rastrigrin, and Ackley functions. It has relatively good success rate on Griewank functions. However, it never converges to the success criteria in optimizing Schewefel function. MLEO_M algorithm has success rate 1 on Rastrigrin and Ackley functions. It provides relatively high success rates on Sphere and Griewank functions. Similar to MLEO_R, it never converges to the success criteria on Schwefel function. The standard GA never also converges to the success criteria, while CCGA has relatively small success rates on Sphere and Griewank functions.
± ± ± ± ±
± ± ± ± ±
± ± ± ± ±
± ± ± ± ±
(a) Sphere
(b) Rastrigrin (c) Griewank
(d) Ackley (e) Schwefel
Fig. 3. Evolution of average fitness on five test functions
Table 3
Success rates and convergence speeds of the algorithms
GA CCGA MLEO-C MLEO-R MLEO-M
S. Rate
C.
Speed S. Rate C. Speed
S. Rate
C. Speed
S.
Rate C. Speed S. Rate
C. Speed
Sphere 0.00 N/A 0.24 860.42 1 81.20 1 65.18 0.88 409.25
Rastrigrin 0.00 N/A 0.00 N/A 1 42.54 1 29.52 1 44.64 Griewank 0.00 N/A 0.12 917.46 1 466.38 0.64 596.22 0.76 642.18
Ackley 0.00 N/A 0.00 N/A 1 140.66 1 113.34 1 152.84
4.3.3 Convergence Speed
The speed of convergence to the global optimum is an important measure for evaluating the performance of the algorithm. The measure is evaluated by the average number of iteration before the convergence. The columns “C. Speed” in Table 3 presents the convergence speeds of the algorithms. As we can observe from Table 3, The MLEOs have the fastest convergence speed for the optimization test functions. The best convergence speeds on Griewank and Schwefel functions were achieved by MLEO_C algorithm. The MLEO_R algorithm results best convergence speeds on Sphere, Rastrigrin, and Ackley functions.
5. Conclusions
In this paper, the effect of the multilevel selection theory has been studied in MLEO algorithm. MLEOs have been compared with original genetic algorithm and its cooperative co-evolutionary variant on five well known benchmark functions. The proposed algorithms are reliable with relatively fast convergence speeds and outperform the other evolutionary algorithms investigated in this paper. However, a word of cautious is necessary since the test problems studied in this paper do not necessarily represent all real-world problems.
References
Bergmuller, R., Russell, A. F., Johnstone, R. A. & Bshary, R. (2007). On the further integration of cooperative breeding and cooperation theory, Journal of Behavioural Processes, 76, 170–181. Billard, S. & Lenormand, T. (2005). Evolution of migration under kin selection and local adaptation,
The Society for the Study of Evolution. 59(1), 13–23.
Boyer, D. O., Martnez, C. H. & Pedrajas, N. G. (2007). Crossover Operator for Evolutionary Algorithms Based on Population Features, Applied Soft Computing, 39(3), 459-471.
Fletchera, J. A. & Zwick, M. (2007). The evolution of altruism: Game theory in multilevel selection and inclusive fitness, Journal of Theoretical Biology, 245, 26–36.
Frank, S. A. (1986). Dispersal polymorphism in subdivided populations, Journal of Theoretical Biology, 122:303–309.
Hamilton, W. D. & May, R. M. (1977). Dispersal in stable habitats, Nature, 269:578–581.
Hogeweg, P., 2002. Multilevel processes in evolution and development: Computational models and biological insights, Springer-Verlag Berlin Heidelberg, 217–239.
Ichinose, G. & Arita, T. (2008). The role of migration and founder effect for the evolution of cooperation in a multilevel selection context”, journal of ecological modelling, 210, 221–230. Kennedy, J. & Eberhart, R. (1995). Particle swarm optimization, Proceeding of IEEE Int. Conference
of Neural Networks, 4, 1942–1947.
McAndrew, F. T. (2002). New Evolutionary Perspectives on Altruism: Multilevel-Selection and Costly-Signaling Theories, Current Directions in Psychological Science, 11(2), 79-81.
Potter, M. A. & de Jong, K. A. 1994, A cooperative coevolutionary approach to function
optimization, The Third Parallel Problem Solving From Nature. Berlin, Germany:
Springer-Verlag, 249–257.
Sober, E. & Wilson, D. S. (1998). Unto others, the evolution and psychology of unselfish behaviour, Harvard University Press.
Srinivasan, D. & Seow, T. H. 2003. Evolutionary Computation, The 2003 congress on evolutionary computations, Canberra, Australia, 2292–2297, 2003.
Traulsen, A. & Nowak, M. A. (2006). Evolution of cooperation by multilevel selection, Proceedings of the national academy of sciences of the United States of America, 103(29), 10952-10955, 2006. Valleriani, A. & Meene, T. (2007). Multilevel selection in a gradient, journal of ecological modeling,
208, 159–164.